

Apache HTTP Server, widely known as Apache, is one of the most popular and versatile web servers powering millions of websites worldwide. Its open-source nature, extensive configurability, and robust performance have made it a cornerstone of web hosting. However, like any critical piece of infrastructure, ensuring its optimal performance and availability requires continuous monitoring.
Effective monitoring of an Apache web server goes beyond checking whether it’s up and running. It involves tracking metrics such as response times, server load, resource utilization, and error rates. Proactively identifying potential issues—like traffic spikes, server misconfigurations, or resource bottlenecks—can prevent downtime, enhance user experience, and maintain service reliability.
This is where specialized Apache web server monitoring tools come into play. These tools provide deep insights into your server’s health and performance, enabling administrators to detect problems early and take corrective action. Whether you’re managing a single Apache server or a fleet of them in a large enterprise, monitoring tools can simplify maintenance, automate alerts, and even optimize resource usage.
Here is our list of the best Apache Web Server monitoring tools:
- ManageEngine Applications Manager (FREE TRIAL) Has a dedicated Apache monitoring tool offering agentless performance monitoring on various metrics.
- Paessler PRTG Network Monitor (FREE TRIAL) Autodetects your network structure on install and has over a dozen server monitoring modules for Apache.
- Site24x7 Server Performance Monitoring (FREE TRIAL) A cloud-based monitoring tool for networks, servers, applications, services, and websites that includes Apache Web Server monitoring.
- Datadog Apache Monitor A cloud-based application performance monitor that has specific screens for Apache monitoring.
- SolarWinds Apache Monitor with Server & Application Monitor Comprehensive server and application monitoring tool that can monitor key Apache performance metrics with a dedicated module.
- Sematext Apache Web Server Monitoring This package is part of an infrastructure monitoring service that can watch over networks, physical servers, and virtualization as well as applications. Offered as a SaaS package or for hosting over Docker.
- Dynatrace Monitor and visualize Apache metrics through the context of your web services that run Apache.
- AppDynamics Real-time monitoring solution for identifying bottlenecks with auto-discovery and end-to-end business transaction performance.
In this guide, we explore some of the best monitoring tools tailored for Apache web servers. We’ll cover comprehensive solutions that integrate with broader IT monitoring systems. Each tool will be evaluated based on features such as ease of use, data visualization, alerting capabilities, and cost-effectiveness.
By selecting the right monitoring tool for your needs, you can ensure that your Apache web servers perform at their best, reducing downtime and improving reliability for your users. Dive into our detailed breakdown to find the ideal solution for your environment.
What is Apache Web Server?
Apache Web Server is an open-source web server managed by the Apache Software Foundation. A web server is a service that sits between a server and a client device. Apache Web Server runs as a piece of software on a server and takes client requests from a user’s web browser. It then sends a response to the request in the form of a webpage. What makes Apache Web Server popular is the range of modules it offers enterprises additional features.
Modules enable customization in the form of additional features. For example, IPv6, FTP, HTTP/2, bandwidth throttling, WebDAV, load balancing, and URL rewriting are just some of the extra features that Apache Web Server has to offer. These features grant you greater control over the experience you provide to the end-user.
To use Apache all you need to do is download the software from the official website. The server software is completely free so you can start improving your website’s service without breaking the bank.
Why is it Important to Monitor Apache Web servers?
Apache Web server is an essential service. It is important to monitor all of your IT infrastructure to ensure that it continues to perform effectively – that applies equally to your Web server.
A Web server is subject to a number of potential hazards. It can become overloaded with too many connection requests. Even without the problem of dealing with the intentional overloading of a DDoS attack, a genuine surge in interest in one of your websites could use up all of the capacity of the Apache Web server.
You also have to pay attention to the host resources that are available to the Web server. Just like any application, Apache Web server needs a certain amount of CPU capacity in order to run. If it is sharing a server with other applications, those processing resources might run short. The same problem can occur with memory and disk space availability.
Monitoring all of these factors usually gives you time to head off problems. Normally, capacity issues don’t hit in an instant – they build. You should select a Web server monitor that includes performance thresholds and set those levels below full capacity for each resource – say at 70 percent of utilization. These thresholds should trigger alerts if they are crossed. That warning gives you enough time to make more resources available to your Web server and prevent it from stalling.
The best Apache Web Server monitoring tools
If you’re currently using Apache Web Server, using a server monitoring tool is vital to providing an excellent experience. Part of the battle of monitoring web servers is having the necessary tools and visibility to address performance concerns.
Our methodology for selecting Apache Web Server monitoring tools
We reviewed the market for Apache Web Server monitoring software and analyzed the options based on the following criteria:
- A system that can watch the load on an Apache Web Server instance
- An alerting mechanism that is triggered by a threshold as capacity on the web Server reaches its limits
- A notification service that will forward alerts to technicians by email or SMS
- Live performance reports including load and response times
- Stored statistics for historical data analysis
- A free trial for a no-cost assessment period or a money-back guarantee
- Value for money judged by the number of functions included set against the price of the package
All of the tools mentioned in this article are excellent choices for overseeing the performance of Apache Web Server.
1. ManageEngine Applications Manager (FREE TRIAL)
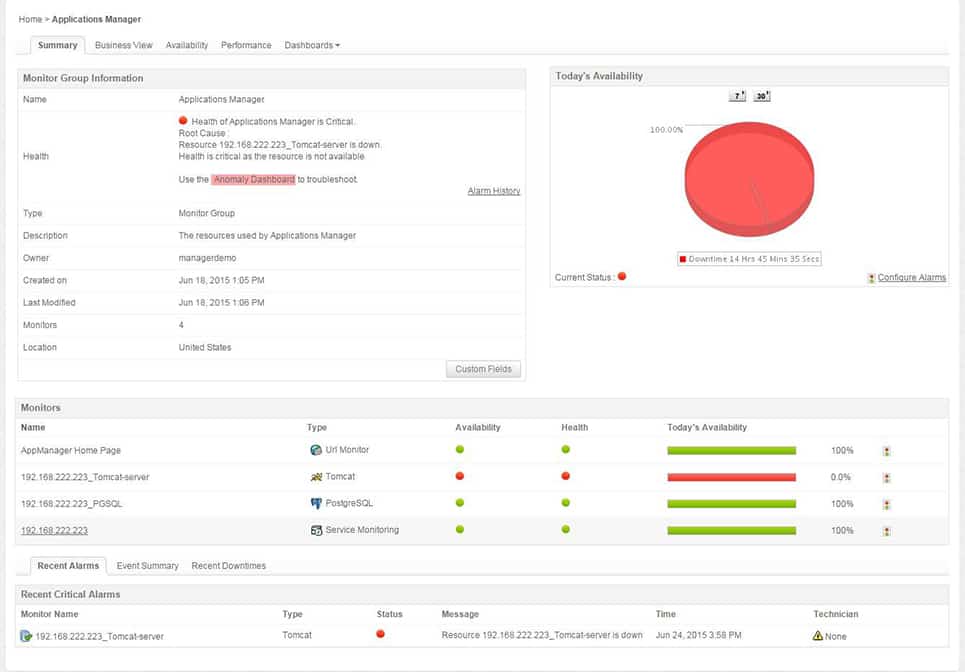
ManageEngine Applications Manager is an application monitoring software platform that offers Apache Web Server monitoring. With ManageEngine Applications Manager you can monitor the availability, response time, CPU utilization, Bytes transferred/sec, request details of Apache Web Server, and more. The range of connection metrics supported by the program make sure that you know if there is anything affecting your end-users.
Key Features:
- Application discovery: Application dependency mapping
- Records Apache metrics: Tracks demand, throughput, and error rates
- Resource usage: Apache’s requirements from the physical server
Why do we recommend it?
ManageEngine Applicaiotns Manager is a mahjor rival to the SolarWinds Server & Application Monitor. This system includes Apache Web server monitoring together with simultaneous tracking of the physical server that monitors the Web server. This system discovers and maps all of your applications and services to provide root cause analysis.
The alerts system included with ManageEngine Applications Manager enables the user to set up thresholds to monitor performance metrics. Alerts are sent via email and SMS so you know when a performance event takes place. Alerts are highly configurable so you can control what activities the tool notifies you about. For example, you can set a threshold for response time so that you receive alerts if the server is slow to respond.
The reports functionality in ManageEngine Applications Manager is another one of the programs strong points. Reports show historical performance data on the Apache Web Server but you can also use machine learning to anticipate future performance trends. Machine learning helps you to plan for the future.
Who is it recommended for?
ManageEngine offers a Free edition of the Applications Manager to monitor five objects. The Standard package is sized and priced to be accessible to small businesses and larger companies can pay for extra capacity. The software for the Applications Manager runs on Windows Server, Linux, AWS, and Azure.
Pros:
- Demand correlation: See how variations in demand on Apache flow through to demand on physical server resources
- Alerts for performance problems: Can be forwarded by email, SMS, or Slack message
- Capacity planning: Examine demand over time, observing peaks and troughs
Cons:
- No SaaS package: This is a software package that can be installed on Windows Server, Linux, AWS, or Azure
There are three versions of ManageEngine Applications Manager available: Free, Professional, and Enterprise. The Free version supports up to five servers or applications. The Professional version starts at $945 (£751) for 25 monitors, and the Enterprise version starts at $9,595 (£7,632) for 250 monitors. There is also a 30-day free trial version.
2. Paessler PRTG Network Monitor (FREE TRIAL)

Paessler PRTG Network Monitor is an infrastructure monitoring tool that has its own sensor for Apache Web Server. The HTTP Apache ModStatus PerfStats Sensor shows you a range of metrics including CPU load, server uptime, requests per second, bytes per request, number of current busy worker threads, and number of idle worker threads. The sensor shows all of this data in the form of dials which can be viewed as live and historic data.
Key Features:
- Flexible package: The buyer decides which sensors to activate
- Free edition: Provides 100 sensors
- On-premises software or SaaS: Run the on-premises version on Windows Server
Why do we recommend it?
Paessler PRTG Network Monitor is able to monitor servers, cloud platforms, middleware, services, and applications as well as networks. Among the technologies that this system will track is the Apache Web server. See capacity, demand, performance, and server resource availability with this tool and get alerts when problems arise.
Once the sensor has been configured the alerts system will let you know if there is an issue that requires your immediate attention. Notifications are available via email, SMS and push notifications. There is also an API that you can use to create your own custom notification scripts.
Who is it recommended for?
Paessler PRTG is available for free if you only activate 100 sensors. You can simultaneously monitor network performance and traffic activity with this package while you also track issues with your Apache Web server. You can run this software on Windows Server or access the hosted version in the cloud.
Pros:
- Shows demand on the Web Server: Uptime, throughput, current busy worker threads, number of idle threads, and error rates
- Records server demand: CPU load and memory
- Multiple Web Servers: Apache, IIS, and NGINX
Cons:
- No automated management tools: Doesn’t have any application management features
PRTG Network Monitor is free for enterprises monitoring with less than 100 sensors. If you need more you will have to purchase one of the paid versions. PRTG Network Monitor starts at a price of $1600 (£1,272) for 500 sensors and one server installation up to $10,500 (£8,352) for 5000 sensors and one server installation or $60,000 (£47,727) for 5 server installations and unlimited sensors. There is also a 30-day free trial.
3. Site24x7 Server Performance Monitoring (FREE TRIAL)

Site24x7 Infrastructure is a cloud-based service that monitors networks, servers, services, applications, and websites. It is able to identify the interdependencies between applications and also the connections between applications and the server resources that support them. The Apache Web Server is one of the applications that Site24x7 Infrastructure is able to monitor.
Key Features:
- Full stack observability: Monitors networks, cloud platforms, servers, and software
- Cloud-based system: This is a SaaS package
- Implemented as a plug-in: Provides an extra screen in the Site24x7 console
Why do we recommend it?
The Site24x7 Server Performance Monitoring module is part of a SaaS platform of system monitors for every layer of the service stack. You can monitor the Apache Web server with this system alerts also other middleware and applications. The tool displays the demand and response of your Web server and alerts if capacity is exhausted.
Out of the box, Site24x7 has general application monitoring capabilities that track such things as server resource usage. This can be enhanced in the case of some products because the Site24x7 system has a number of “integrations” available for them. What Site24x7 refers to as an ‘integration’ is a plugin that expands the capabilities of the tool and there is a free integration available for Apache Web Server.
The Apache Web Server performance metrics that the Site24x7 Infrastructure system observes are collected by an agent that needs to be installed on the host of the Web Server. These are uploaded to the Site24x7 server over a secure connection for processing.
Metrics that Site24x7 infrastructure tracks include uptime, requests per second, busy workers, idle workers, bytes per request, bytes per second, CPU load, and total accesses. While displaying these factors in the system console, Site24x7 also tracks anomalies and places performance thresholds on the metrics that are observed. If a problem is detected, the system raises an alert. System alerts can be forwarded to key staff via SMS, email, instant messaging post, or voice call.
Who is it recommended for?
This package is great for small businesses because it provides all of the system monitoring tools that they need, including synthetic monitoring and real user monitoring for websites. It tracks issues on cloud platforms, servers, and networks and identifies all of the software packages that run on them.
Pros:
- Live activity tracking: Web Server availability, throughput, error rates, and response times
- Activity tracking for associated systems: Correlates performance for databases, network interfaces, and server resources with the Web Server throughput
- Alerts for performance issues: The user can create custom alert triggers
Cons:
- Plug-ins cost extra: You get one plug-in for free
Site24x7 Infrastructure is a subscription service with a price of $9 per month when paid annually. You can experience it on a 30-day free trial.
4. Datadog Apache Monitor

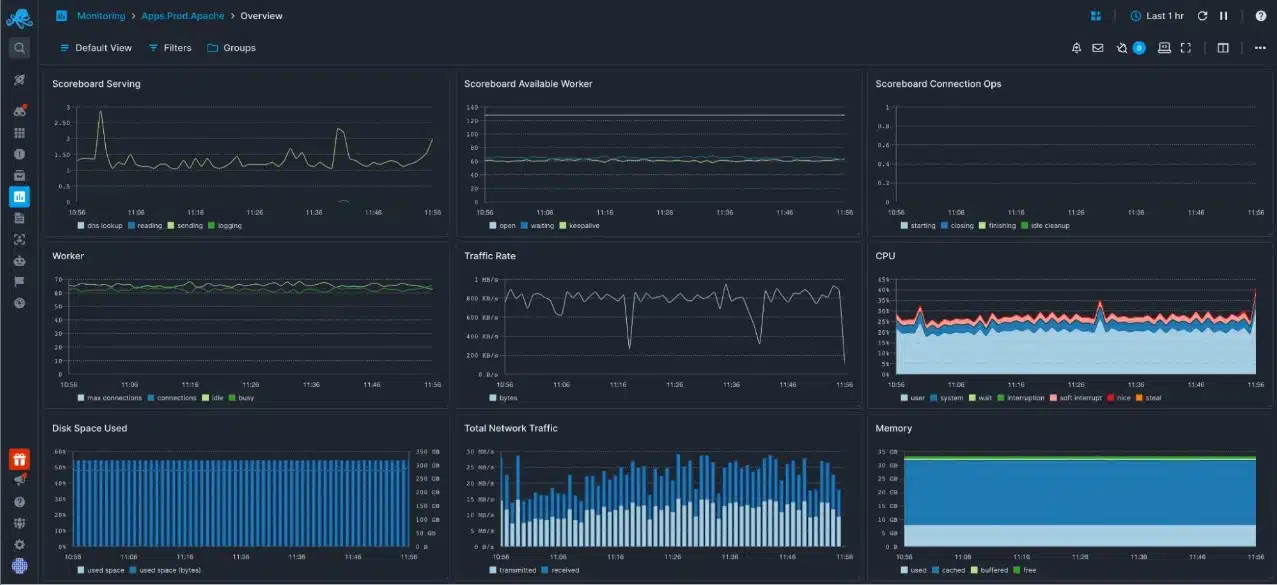
Datadog Apache Monitor tracks the performance of Apache web server implementations and is part of Datadog’s SaaS platform that includes a range of application monitoring tools. The base service of this monitoring system is a real-time display of Apache performance metrics that includes the data throughput of the server and its response times.
Key Features:
- Part of the Infrastructure Monitoring Module: This package will monitor many other technologies
- A Cloud-Based Service: This is a SaaS package
- Web Server Metrics: load, response times, and error rates
- Configuration Analysis: Looks at load balancing and traffic capacity
Why do we recommend it?
The Datadog Apache Monitor is part of the Infrastructure Monitoring services of the Datadog SaaS platform. This package monitors all of the services that lie between your user-facing system and the servers that host everything. The system is able to calculate resource demand and identify potential shortages.
Apache cannot work properly if the host is overloaded, so the Apache monitoring system of Datadog also gives you feedback on the performance statuses of the physical server as well. All of the information that the Datadog monitor collects is too much to fit on one screen, so you have the option to customize the dashboard, giving you all of the data that interests you most all in one place.
To get more information on summary displays, you just click on that element in the screen to access a more detailed data view. The Apache monitor of Datadog collects more than 180 different metrics. All of that information is more than any one person can cope with. However, the system sets performance thresholds, so you will be drawn to pertinent information when a particular status becomes a problem.
The APM gives a very deep insight into the performance of Apache. However, to get better information about the server and network performance of your operation, you will need to add on Datadog Infrastructure. A Network Performance module will show you traffic flows and help you improve performance with traffic shaping. A Synthetic Modelling module lets you have a constant check on uptime. It also gives you the capability to run your own tests on elements in your website from external agents that are located around the globe.
Who is it recommended for?
As it is a cloud-based system. The Datadog package will probably be your first choice if you don’t want to run monitoring software on your own servers – although there are other cloud options on this list. See how all of the services behind your websites contribute to a satisfactory user experience.
Pros:
- Combines with other units: Enhance observability by adding on Network Performance Monitoring
- Check on Web performance: Add on Synthetic Monitoring and Real User Monitoring
- Combine with server monitoring: Also part of the Infrastructure Monitoring package
- Alerts for performance issues: Forward alerts as notifications by Webhooks, Slack, PagerDuty, or email
Cons:
- Needs multiple modules: Subscribe to multiple units to get a full picture of Web Server performance
Datadog is charged for by subscription and each module has its own pricing structure. The APM is charged per host per month and has an App Analytics add-on available. All of the Datadog modules are available on a 14-day free trial.
5. SolarWinds Apache Monitor with Server & Application Monitor

The SolarWinds Apache Monitor for Server Performance with Server & Application Monitor is an application monitoring tool that can monitor Apache Web Server. The tool monitors Apache Web Server uptime, accesses, traffic, idle workers, availability, CPU load, total access, server request per second, memory, and more to identify performance issues. There is also the option to monitor other pieces of infrastructure that support the web server such as Linux, MySQL, and PHP.
Key Features:
- An on-premises software package: Runs on Windows Server
- Monitors the performance of many software packages: Doesn’t just monitor Apache Web Server
- Operational statistics: Records issues such as response time and request load
- Server resource usage: Identifies the physical resource usage of Apache Web Server
- Server resilience: Examines the total resource availability of the supporting server
Why do we recommend it?
The SolarWinds Server & Application Monitor implements Apaches Web server monitoring in conjunction with simultaneous tracking of all of your other applications and services. The monitor watches the resource availability of the servers that support all of these systems. This combined monitoring capability gives the tool the opportunity to calculate resource demand and predict shortages.
Outside of Apache, the tool offers automatic application and server discovery. Autodiscovery is useful for keeping your network environment updated to make sure that you have complete visibility over what is going on.

The alerts system also offers a high level of support for Apache Web Server monitoring. The alerts system works on a threshold basis and sends alerts if a device or application matches certain performance issues. For example, if the server goes down or the CPU load reaches a problematic level the program will alert you.
Who is it recommended for?
This service is aimed at large enterprises. Small businesses won’t need the capacity of the SolarWinds monitoring systems. For full-stack performance monitoring, you could combine this package with the SolarWinmds Network Performance Monitor. The alerting mechanism in both packages provides immediate root cause analysis when your Apache Web server faces problems.
Pros:
- Server and application discovery: Automatically identifies servers and logs all of the applications running on them
- Application dependency tracking: Correlates the activities of related systems, such as operating system and database services
- Projects server resource shortages: Calculates the needs of all concurrently running applications
- Alerts for performance problems: Also alerts for resource shortages
- Alerts forwarded as notifications: Alerts can be sent by SMS or email
Cons:
- No cloud option: Only available for Windows Server
SolarWinds Server & Application Monitor starts at a price of $2,995 (£2,382). You can download the 30-day free trial.
6. Sematext Apache Web Server Monitoring
The Apache Web Server Monitor is part of Sematext Infrastructure Monitoring. This monitoring package watches over servers, networks, and applications and it can be expanded to gain the capabilities of monitoring specific products by activating integrations. There is an integration package available to monitor Apache Web Server. This add-on implements data extraction from Apache so that it can show live metrics on the Web server system in the Sematext dashboard.
Key Features:
- Part of an Infrastructure Monitoring package: This is a cloud-based package
- Data gathering agent: On-premises program uploads logs and observations from Apache Web Server
- Collects activity data: Watch availability, throughput and response times
Why do we recommend it?
Sematext Infrastructure Monitoring provides performance tracking for systems that lie between user-facing systems and servers. The Apache Web server is part of that remit and it will show the demand of your Web server and its throughput. You can identify peaks and troughs in demand and see how the server copes with them.
You still get network and physical server monitoring when you activate the Apache Web Server integration in Sematext. This enables you to tie together issues such as demand on the Web server and availability of resources. You will be able to link together the performance of Apache with network activity and network device availability. This provides instant root cause analysis if Apache’s performance drops.
The Sematext system includes a rule base of triggers that will generate alerts if they are activated. These send notifications to you by email, Slack message, or Webhooks. This means that you don’t have to sit and watch the console for Sematext waiting for problems because you will be drawn back to the system if your attention is needed.
Who is it recommended for?
This system is a SaaS package and it has a free edition, called Basic, which will monitor five hosts. This could be enough for small businesses. However, to get more capacity, you need to pay. There are two paid plans and both are charged per host.
Pros:
- Synthetic Monitoring is also available: Check on the delivery of your Web assets
- Server resource observations: Coordinate Apache activity with physical server resource usage
- Free edition: Watches five hosts
Cons:
- Free edition no use for historical analysis: Data retention for only 30 minutes
You need to subscribe to the Sematext Infrastructure Monitoring service in order to get the Apache Web Server integration. Both systems are f free for use on five hosts as long as you select a short data retention period. This package is available as a SaaS package but you can also run it on your own server as a virtual appliance over Docker. Sematext offers the Infrastructure Monitoring package and the Apache Web Server integration for a 14-day free trial.
7. Dynatrace
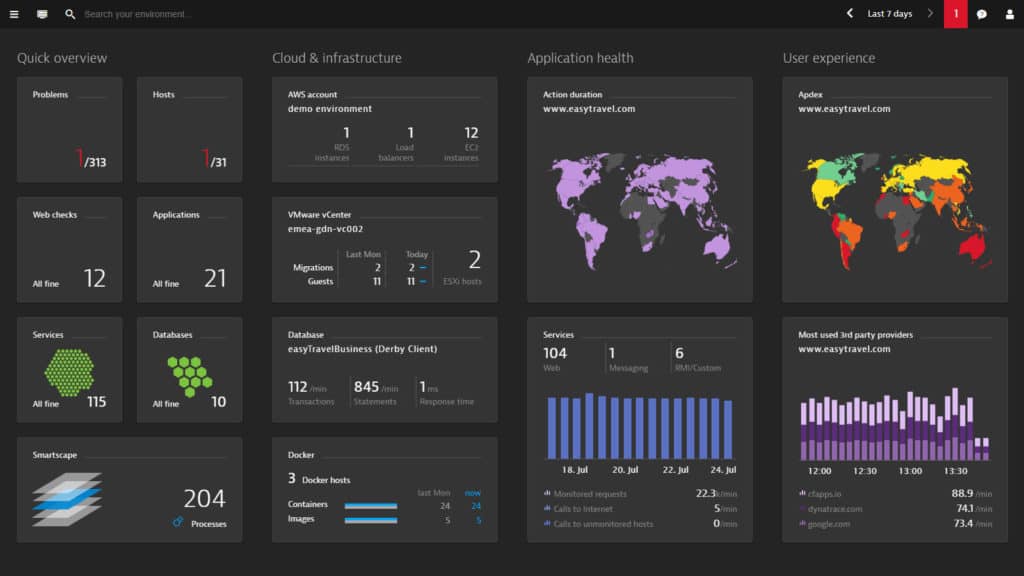
Dynatrace is an application performance monitoring platform with Apache monitoring capabilities. The tool provides you with a performance dashboard that displays availability, incoming requests, response sizes, busy workers, application version, configuration path, infrastructure changes, and restarts. For example, you can view an Apache Web Server availability graph that shows you when the service last went offline.
Key Features:
- Cloud-based service: This is a SaaS platform
- Logs Apache configuration: Application version, configuration path, and infrastructure changes
- Activity monitoring: Availability, number of requests, idle threads, error rates, and response times
Why do we recommend it?
Dynatrace applies AI-based demand predictions to application and infrastructure monitoring and it has a particular capability for cloud monitoring. Its Apache Web server monitoring capabilities identify the activities of all the other software running on the same server and predict potential conflict of resources shortages.
A feature called deep process monitoring allows you to take a microscope to the response time of Apache services running within various processes. For instance, you can view a graph that breaks down what services are taking the most time to execute. Services include Apache modules, Database activity, PHP compilation, and PHP execution.
One reason why Dynatrace is a top tool for monitoring Apache Web Server is its anomaly detection engine. The anomaly detection engine automatically detects performance anomalies to identify concerning activity. If an anomaly is detected you will be notified by an alert. The alert will not only highlight that there is a problem but pinpoint the root cause so that you can address it early on.
Who is it recommended for?
Dynatrace offers four plans on its cloud platform and to get Apache Web server monitoring, you would need to go for the Infrastructure plan or the Full-stack Monitoring package. The latter includes the services of the Infrastructure plan. Dynatrace offers a respectable service with live activity statistics and predictive alerts.
Pros:
- Resource usage monitoring: The usage of CPU and memory provided by the host
- Predictive alerts: Forecasts resource needs and alerts if shortages are expected
- Part of the core Dynatrace platform: This unit is included in the base package; it is not an extension
Cons:
- Too complex for small businesses: Small businesses without a technical support specialist would struggle with this package
For top-down visibility through Apache Web Server down to the process level, Dynatrace is an exceptional choice. However, if you want to know the pricing options available for Dynatrace you’ll have to contact the company directly. You can download the 15-day free trial.
8. AppDynamics
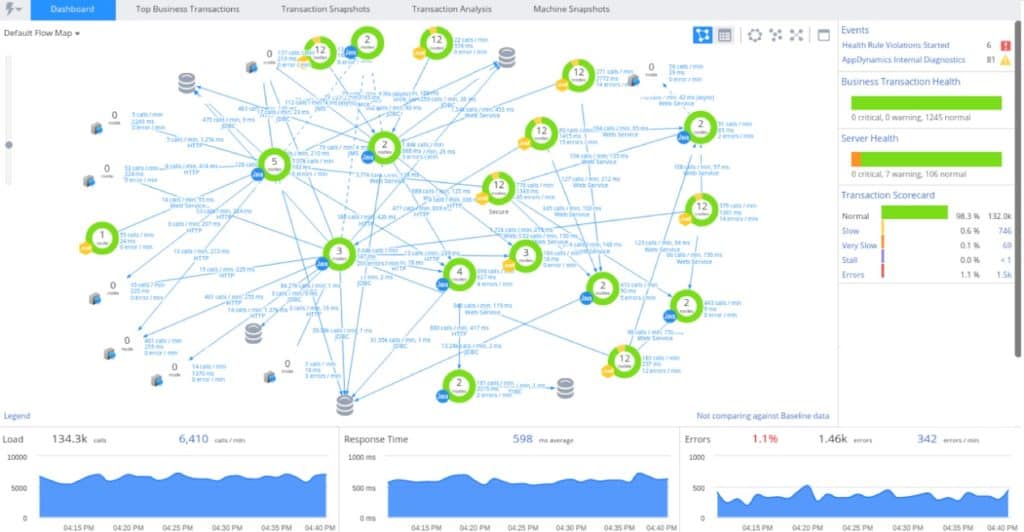
AppDynamics is an application performance monitoring which can automatically discover application topology including Apache Web Server. The tool can be used to provide visibility into business transactions. Data monitored by AppDynamics for Apache Web Server includes load, average response time, and errors.
Key Features:
- Cloud-based system: Monitors n-premises and cloud-hosted services
- Focused on application performance monitoring: Discovers applications and creates an application dependency map
- Apache performance: Records availability, demand, response times, and idle resources
Why do we recommend it?
AppDynamics is a similar system to Dynatrace. It applies AI to predict capacity shortages and it is available in three editions. Fortunately, the lowest of these includes the Apache Web server monitoring capabilities. Get the higher plans to add on application dependency mapping. This is a cloud-based service.
Alerts in AppDynamicsindependently calculate baseline values for KPIs to distinguish poor performance. The calculations are accurate enough to eliminate false positives so you don’t get sent irrelevant or incorrect alarms. From an administrative perspective, this makes sure that you only respond to important alerts.
Who is it recommended for?
AppDynamics takes a different view to performance predictions by watching data flows between applications. That unique approach isn’t really available to those who get the lower plan, which focuses on middleware and server resources. You also need to hop up one rung in the plan levels to get database monitoring.
- Too much for small businesses: Provides the greatest benefits for large and complex systems
Pros:
- AI-based demand predictions: Forecasts short-term capacity requirements
- Long-term capacity planning: Stores activity statistics over time for historical analysis and capacity planning
- Root cause analysis for performance impairment: Uses dependency mapping and AI inference to detect the reason for performance issues
Cons:
- Too much for small businesses: Provides the greatest benefits for large and complex systems
There are three versions of AppDynamics Application Performance Management available: APM Pro, APM Advanced, and APM Peak. APM Pro is the basic package that includes infrastructure monitoring abilities. APM Advanced also includes visibility into the application stack. Finally, APM Peak offers real-time business performance monitoring, business journeys, and transaction analytics. You can start the 15-day free trial.
Choosing an Apache Web Server Monitoring Tool
By using a tool like ManageEngine Applications Manager you’ll be able to make sure that the response time stays low and avoid any unforeseen performance problems. The better the server’s performance is, the more fulfilling a user experience your visitors will enjoy.
Apache Web Server Monitoring FAQs
What percentage of web servers run Apache?
According to W3Techs, as at March 2021, Apache is the leading Web server system in the world with a 34.2 percent market share. Nginx is in second place with 33.8 percent. The third place is held by Cloudflare Server with 18 percent.
Is Apache Web Server secure?
Apache Web server is reasonably secure but the full strength of its security greatly depends on the way in which it is configured and protected. It is possible for the administrator of an implementation to weaken or strengthen the security of Apache Web server.
