

In the world of networking, diagnosing connectivity issues can be a challenging task. One of the most commonly used tools for understanding the path that data takes across networks is the TraceRoute command. However, while TraceRoute is effective, it has its limitations, such as providing one-time snapshots without any ongoing monitoring. Enter Matt’s TraceRoute (MTR) – a more dynamic and informative tool that combines the functionality of TraceRoute with advanced real-time analysis.
MTR provides network administrators, engineers, and IT professionals with a continuous, real-time view of the network route and its performance, making it an invaluable resource for diagnosing routing problems, latency, and packet loss.
The service works continuously, combining Ping and TraceRoute functionality but providing a much better display than those original command line tools. Most network administrators are very familiar with both Ping and TraceRoute and probably use these two utilities regularly for a quick investigation of what is going on with connectivity or device availability.
Whether you’re troubleshooting issues on a local network or diagnosing problems with your Internet service provider, MTR offers a more comprehensive and user-friendly approach than traditional TraceRoute. This article will delve into how MTR works, its advantages over conventional tools, and how to use it effectively to optimize network performance and resolve connectivity issues.
What is Ping?
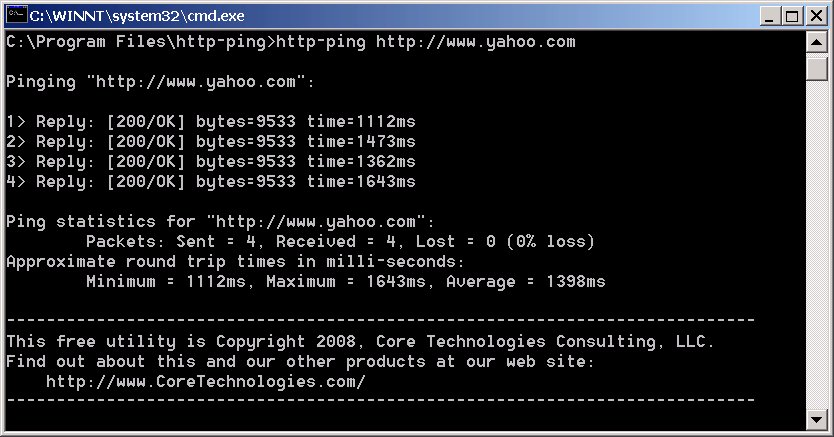
Ping is one of the most commonly-used network diagnostic tools in the world. With Ping, the user can send ICMP packets from one computer to another. The receiving computer then replies with ICMP echo reply packets once the packets have arrived. This ICMP echo reply packet tells you if a device is available or not. If a computer doesn’t send a reply back then you know that it isn’t available.
You can also ping hostnames to monitor DNS connectivity. Generally, network administrators use the Ping tool to measure the availability of hosts across a network. While this sounds good in theory, it is important to note that Ping isn’t always accurate. ICMP packets are often filtered by firewalls meaning that sometimes devices that are up and running don’t respond with ICMP packets.
See also: The Best Ping Monitoring Tools
What is Traceroute?
Traceroute is another widely-used networking tool that records the route between the sender and the receiver. It is different from Ping because it calculates the route and shows the user the amount of time taken for a packet to traverse each hop.
Traceroute is primarily used to pinpoint problem areas within a network. If one hop takes particularly long to travel through then that is a good indication that there is a problem somewhere in the network. To use Traceroute all the user needs to do is enter the traceroute command.
The command sends off an ICMP packet with a time to live value. Every packet that you send has a TTL field. The TTL is the maximum number of hops that a packet can travel before it is discarded. The sender sets the TTL value so that once it is exceeded, the router will drop the packet and notify the original sender with a time-exceeded message.
The TTL and the time exceeded together can be used to determine how long it takes for a packet to travel from one hop to another. Once the Traceroute is complete you can then see the number of milliseconds (ms) that the packet took to reach a router. As a result, Traceroute is a good tool for measuring the latency within a network.
The longer it takes for a packet to travel through a hop, the more latency there is. The presence of a high amount of latency tells a network administrator that the network isn’t performing as it should be. Traceroute is included by default on Windows and Unix operating systems. However, it can also be installed via an online download.
See also: Traceroute Tools Review
What is MTR?
The MTR network monitor combines Ping and Traceroute and combines the availability measuring capabilities of Ping with the hop-to-hop analysis of Traceroute. MTR uses ICMP packets to measure the availability of devices and the length of time taken to travel from hop to hop.
However, what really sets MTR apart from other limited tools is that it records packet loss and jitter as well. MTR thus measures the quality of a connection time it takes to complete a transfer and the percentage of packets lost in transit.
When using MTR you run reports to view performance data. Reports gather data from your network and then feed it back to you in the form of an onscreen table. The table shows you information on packet loss and latency.
See Also: Fix Packet Loss
Why is MTR Useful?
MTR is a useful tool for a number of reasons. First, it combines Ping and Traceroute together to be able to measure the availability of devices in the network as well as monitoring the route. However, it also has a significant advantage over Traceroute because the output is updated continuously. With Traceroute, you have to update scans manually to measure how a network’s performance changes over time.
In contrast, you can run MTR and your information will be connected until you say stop. Being able to monitor the change in network performance over time helps when it comes to troubleshooting.
How to Install MTR
MTR is available for users with Windows, Mac OS, and Linux. The installation process differs according to which platform you’re working on.
Install MTR on Windows
To download MTR on Windows you can download the Windows version WINMTR via this link here.
Install MTR on Mac OS
To install MTR on Mac OS you can use Homebrew or Macports. On Home-brew you need to enter the following command:
brew install mtr
Alternatively, to run MTR with MacPorts you need to enter:
port install mtr
Install MTR on Linux
To install MTR on Linux you need Debian, Ubuntu, CentOS, RHEL, or Fedora. For Debian and Ubuntu you can enter the following command:
apt update && apt upgrade

apt install mtr-tiny
On CentOS, RHEL and Fedora you can enter the following command:
yum update

yum install mtr
How to Use MTR
When using the MTR network scanner, you need to generate an MTR report in order to view your traffic data. MTR reports are directional so it is necessary to generate reports in both directions to get a complete picture of your network’s performance. In this section, we’re going to look at how you can do this. The process is different depending on what platform you’re working on.
In this section we’re going to look at:
- How to generate and read MTR reports
- How to measure packet loss
- How to measure latency
- How to measure jitter
Windows (with WinMTR)
To begin, go to the host field and enter your domain name. Now click Start. Once this is done packets will start to be transmitted. Packet transmission won’t stop until you press the Stop button. Packet data will be shown in the main canvas view which details the number of packets sent and received as well as the packet loss percentage.
Linux
If you’re using the command line interface version of MTR on Linux, then you can generate a report by typing mtr followed by the URL that you want to analyze. For example:
mtr google.com
How to Read MTR Reports
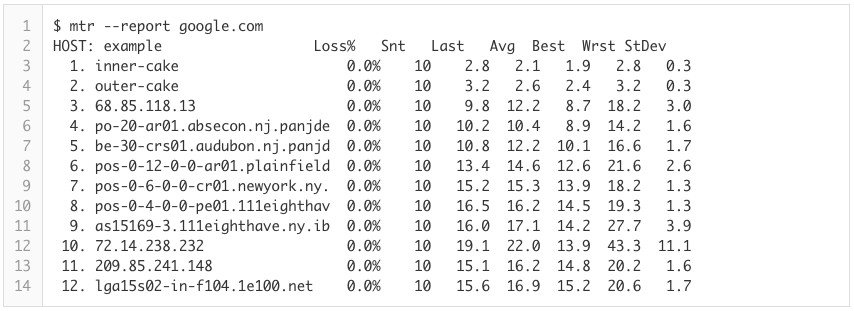
A key part of using the MTR network scanner is being able to read the results of a report. As you can see in the image above, the report command specifies where the packets are to be sent (in this instance google.com). The information shown on the report is as follows:
- The numbered lines on the left-hand side of the screen refer to hops.
- The names to the right of the numbers are the names of the hosts being contacted.
- The Loss % column shows you packet loss.
- The Snt column shows you the number of packets sent.
- The Last, Avg, Best and Worst all measure latency in ms. The Last is the latency of the last packet sent, Avg is the average latency and best and worst indicate the lowest and highest round-trip time for transmitted packets.
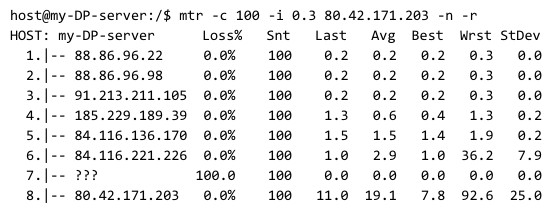
How to Measure Packet loss with MTR
To measure packet loss on the MTR network monitor, you can look at the numerical values under the Loss % column. However, when measuring packet loss with MTR there is one thing to remember: watch out for limiting. Limiting is when service providers place a cap on the amount of ICMP traffic sent by MTR.
ICMP rate limiting is used by service providers to prioritize other network traffic. As a consequence, reports can show packet loss that isn’t due to a configuration issue or fault but because a service provider is imposing a limit on ICMP traffic.
The biggest clue that traffic is being limited is to compare the packet loss between hops. If one hop has a high packet loss but the other surrounding hops are at 0% then it is almost certain that MTR is being limited. As a general rule, if you see lots of different rates of packet loss being reported it is advisable to trust the later hops.
If you are troubleshooting for a particular issue in your network you want to make sure that you measure packet loss both ways. In doing so you will be able to see if there is a problem with the outward route or the return route.
How to Measure Latency with MTR
One of the key pieces of information that you can get from MTR reports is that of latency. Now viewing the latency relies on manually measuring a number of factors.
The first thing you want to do when reading a report is to pay attention to the hop numbers, and the last, average, best, and worst latency at each stage (as shown in the report example above). For example, if the latency jumps up dramatically between one hop to another then this can indicate that there is a problem in that part of the network. However, the latency can be caused by the outward route or the return route.
You won’t be able to see the return route in your report. Instead, you will have to look at the difference between the final hop and the one before it to see if there is a problem there as well. As a result, you will have to run further network troubleshooting to diagnose the source of the problem.
How to Measure Jitter on MTR
You can also use MTR to measure jitter. However, you can’t see jitter on the standard report page. To view jitter you need to enter the option command:
or -order
With this command, you can determine what fields will be displayed and In which order. The list of fields available is as follows:
- L – Loss ratio
- D – Dropped packets
- R – Received packets
- S – Sent packets
- N – Newest RTT (ms)
- B – Min/Best RTT (ms)
- A – Average RTT (ms)
- W – Max/Worst RTT (ms)
- V – Standard Deviation
- G – Geometric Mean
- J – Current Jitter
- M – Jitter Mean/Avg.
- X – Worst Jitter
- I -Interarrival Jitter
Alternative Tools to MTR
Although MTR is a very reliable tool, there are a number of other alternative products that have emerged building off of the original Traceroute program. In this section, we’re going to look at some of the alternatives to MTR that you can use to monitor your network.
SolarWinds Traceroute NG (FREE TOOL)
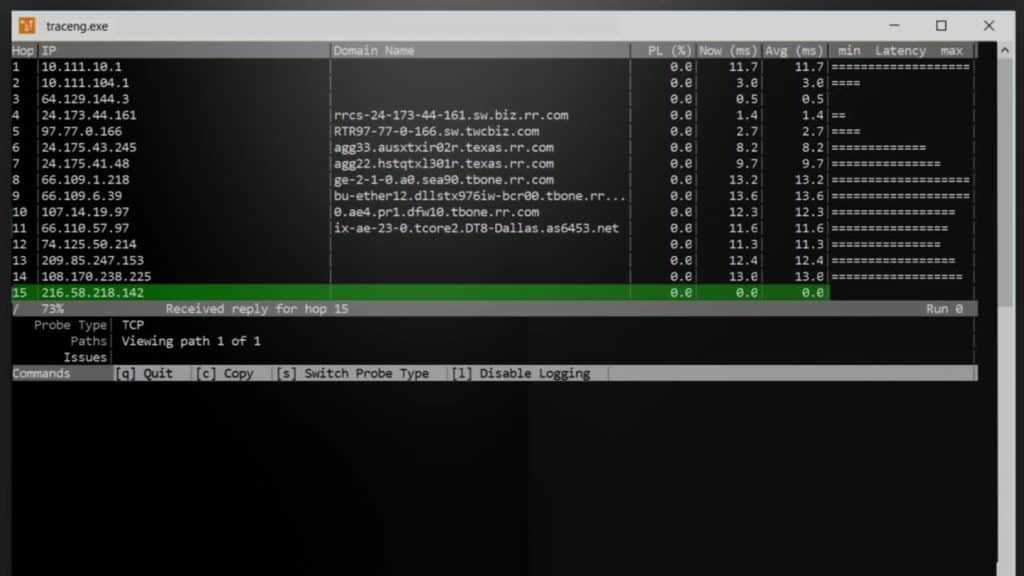
SolarWinds Traceroute NG is SolarWind’s alternative to the MTR network scanner and Traceroute. Traceroute NG can not only detect network path changes, but also offers continuous monitoring. With this program, network path analysis is offered for both TCP and ICMP to give the user-enhanced visibility.
Key Features:
- Easy to install
- Straightforward display
- Standard Traceroute function
- TCP and ICMP options
- Completely free to use
Why do we recommend it?
SolarWinds Traceroute NG is a free tool that provides a standard Traceroute function in a Windows interface, so you don’t need to go to the command line to run it. This small software package won’t tie up your computer’s processor. It can be used to see the path to an endpoint on your network or to a remote location.
The program runs through a command line interface (CLI). You can view important details like IP addresses, hostnames, number of hops, packet loss, and latency. Being able to measure for performance concerns like packet loss tells you if there is a problem that needs to be dealt with.
Who is it recommended for?
The Traceroute NG tool is permanently free, so you don’t need to be worried about it expiring or presenting you with a blocking message asking for money. It will run on Windows or Windows Server. It is worth installing this package just so you have an easy-to-use straightforward Windows Traceroute to hand.
Pros:
- Lightweight tool allows you to run it on virtually any network off of any machine
- Supports both IPv4 and IPv6, making it flexible or larger networks utilizing more modern protocols
- Acts as a troubleshooting tool to detect packet loss, jitter, and latency
- Offers simple visual representations of network traffic
- Is completely free
Cons:
- Advanced features such as enterprise reporting are supported but can be found in products like SolarWinds Network Performance Monitor
TraceRoute NG runs on Windows 8, 8.1, 10, Windows Server 2012 R2 and 2016. Even though Traceroute NG is a proprietary tool, it is available for free. If you’re not a fan of MTR, TraceRoute NG stands in as an excellent alternative.
PRTG Network Monitor
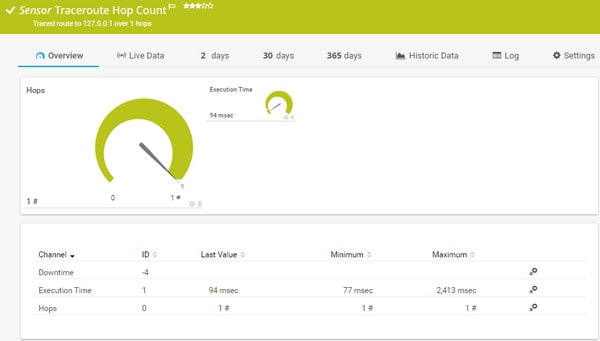
PRTG Network Monitor is a network monitoring platform that offers a number of servers for Traceroute. PRTG Network Monitor is GUI-based so it is easy to use if you aren’t familiar with CLI’s. With the Traceroute Hop Count Sensor you can monitor your network and measure the execution time and number of hops of the transfer. The number of hops is shown as a green dial so that you can clearly see how far a packet has traveled.
Key Features:
- Network discovery
- Network mapping
- Traceroute and Ping
- Live monitoring
Why do we recommend it?
Paessler PRTG Network Monitor provides a device discovery routine that compiles a network inventory. This service repeats and so it notices when you add or remove equipment. The system draws up a network topology map based on the information in the inventory. There are a number of system testing tools in this package, including a Traceroute utility.
There is also a way to monitor jitter and packet loss on PRTG Network Monitor. There is a QOS Round Trip Sensor that shows you the jitter, latency, packet loss, and the mean opinion score of your network connection.
Who is it recommended for?
This system is very accessible for any size of business. You buy an allowance of sensors and then decide which of them you are going to turn on. The minimum quantity you can buy is 500 sensors, which is suitable for a small business. You don’t have to pay anything for the package if you only activate 100 sensors.
Pros:
- Uses a combination of packet sniffing, WMI, and SNMP to report network performance as well as discover new devices
- Autodiscovery reflects the latest inventory changes almost instantaneously
- Drag and drop editor makes it easy to build custom views and reports
- Supports a wide range of alert mediums such as SMS, email, and third-party integration
- Supports a freeware version
Cons:
- Is a very comprehensive platform with many features and moving parts that require time to learn
Like MTR, PRTG Network Monitor is available for free. If you want to expand your network monitoring then you can also incorporate other sensors for packet sniffing and NetFlow analysis.
MTR Network Scanner: The Alternative to Ping and Traceroute
If you’re currently using Ping or Traceroute then making the change to MTR is well worth it. You’ll have the benefits of both tools in one platform. We’ve included a basic guide on how to use MTR here so that you can understand the basics of how to create and read reports. While the process is different depending on what platform you’re on, one thing all versions of MTR have in common is that they are easy to use.
However, if you don’t like MTR then other competitors like TraceRoute NG or PRTG Network Monitor are also suitable alternatives. TraceRoute NG functions in much the same way with the ability to view ICMP and TCP data. PRTG Network Monitor is more of a complete network monitoring platform but it offers a Traceroute sensor that helps visualise the text-based Traceroute experience offered by MTR and Traceroute.
Matt’s Traceroute (MTR) FAQs
What is an MTR test?
An MTR test is the execution of the MTR program to look at the connection from the local computer through to a specific destination, which is given as either an IP address or a domain name. MTR combines Ping and TraceRoute and is short for Matt’s TraceRoute but some people say it stands for My TraceRoute.
What port does MTR use?
The base process of MTR uses the Internet Control Message Protocol (ICMP), which is a Network Layer protocol (Layer 3) and doesn’t include the concept of ports. However, it is possible to force MTR to use UDP with the command MTR -u. In this case, the tests start with a transmission to port 33000 and increase the port number with each successive test. It is also possible to force MTR to use TCP, in which case you specify the port number to use with MTR -P <PortNumber> -T.
Can MTR help with intermittent packet loss?
MTR can’t fix packet loss problems; it can only issue tests to report on the statuses of the likely route that connections will take to a given destination. Intermittent packet loss is a tricky situation to observe. You would need to run MTR several times in order to spot the problem occurring. Still, being able to see the packet loss problem won’t automatically fix it.

