

The traditional approach to network monitoring—focusing on physical, tangible devices—is no longer sufficient. With the rise of virtualization and cloud computing, many business-critical services now operate in dynamic, virtual environments. This shift has made it increasingly challenging for organizations, especially small and medium-sized enterprises (SMEs), to keep track of the applications that drive their operations. Application mapping tools have emerged as a crucial solution, offering visibility into these complex, ever-changing ecosystems.
What is Application Mapping?
Application mapping refers to the process of identifying and visually representing the relationships between applications, their underlying infrastructure, and the network resources they depend on. Application mapping tools automate this discovery, scanning networks to detect and map applications and their interdependencies. The resulting intelligence provides IT administrators with a clear, real-time view of how applications interact with each other and with the network.
Why Use Application Mapping?
These maps are invaluable for monitoring application performance and health. By highlighting key dependencies, application mapping enables teams to quickly identify the root causes of performance issues, such as a failing server, misconfigured resource, or overloaded virtual machine. This proactive insight reduces downtime, improves troubleshooting, and ensures that critical applications function seamlessly.
In addition to performance monitoring, application mapping is essential for managing modern hybrid and multi-cloud environments. It allows businesses to track resources spread across on-premises systems, private clouds, and public cloud services, ensuring nothing is overlooked.
In today’s fast-evolving IT landscape, application mapping tools provide a much-needed layer of visibility and control. By leveraging these tools, organizations can maintain operational efficiency, improve system reliability, and better understand the complex relationships within their networks and applications.
Here is our list of the best Application Mapping tools:
- Faddom EDITOR’S CHOICE Agentless, real-time application dependency mapping solution based on a virtual appliance that passively analyzes network traffic protocols to dynamically map applications and their dependencies on both on-premises and cloud topologies. Start the free trial.
- ManageEngine Applications Manager (FREE TRIAL) A leading application and server manager that includes automated and on-demand discovery for hardware and software with a mapping feature. Trial it free for 30 days.
- Site24x7 Application Performance Monitor (FREE TRIAL) A cloud-based monitoring system that covers network, server, and website performance as well as applications. Access a 30-day free trial.
- Dynatrace An AI-driven performance monitoring system that includes automated equipment and software discovery and mapping.
- SolarWinds Server & Application Monitor A monitor for your servers and all firmware and software that runs on them.
- Datadog APM Service Map A cloud-based application performance monitor that provides a visualization of how infrastructure manages information through its service map feature.
- Device42 An Enterprise App Mapping package that shows real-time app locations and dependencies.
- ExtraHop A monitoring system that uses machine learning to show application behavior, including a dependencies map.
- ScienceLogic An application mapping system that excels at monitoring virtualizations, cloud services, and hybrid environments.
- Appmigrate A free tool that includes an autodiscovery and mapping feature that shows links between applications.
The best application mapping software tools
Our methodology for selecting application mapping tools
We reviewed the market for application mapping software and analyzed the options based on the following criteria:
- A package that can link applications to the server resources that support them
- Live application activity monitoring
- An application stack visualization
- Tools to track resource availability and usage
- Alerts for resource shortages
- A free trial or a demo for a cost-free assessment period
- Value for money from a tool that repays price with productivity gains
Using these selection criteria we looked for application mapping tools that are available as SaaS platforms and others that can be run on-premises.
1. Faddom (FREE TRIAL)
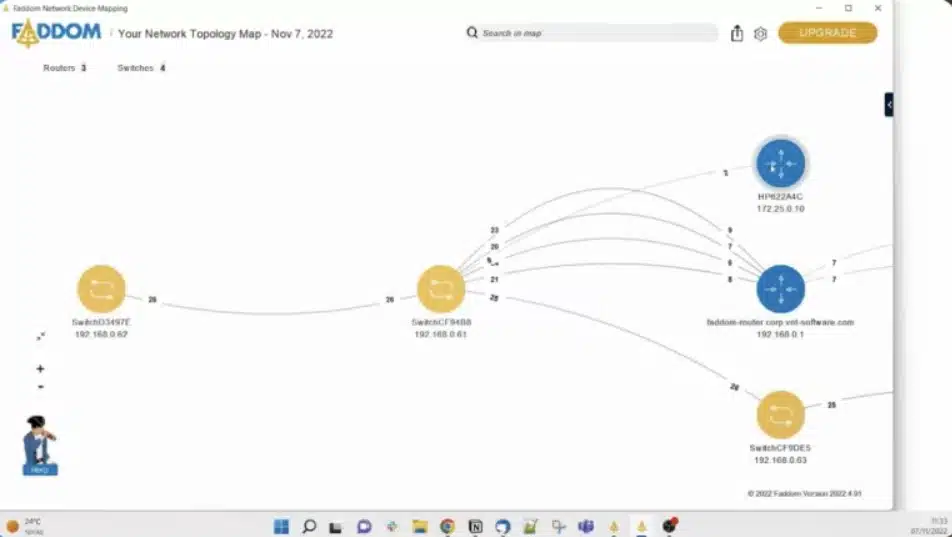
Faddom is a hybrid application dependency mapping software that discovers and maps both on-premises and cloud servers. It also includes a network mapping feature that maps physical network devices such as switches and routers. Faddom can work completely offline because it runs locally and doesn’t store or share client data.
Key Features:
- No Agents Required: Discovers network assets without needing agents on the systems being monitored.
- Comprehensive Environment Mapping: Effectively maps both cloud-based and on-premises environments.
- In-Depth Network Analysis: Provides extensive insights into the structure and performance of physical network devices.
- Offline Security: Guarantees security by functioning completely offline, away from potential online threats.
Why do we recommend it?
Faddom is a system mapping tool that can map networks as well as application dependencies. The tool runs on top of VMware as a virtual appliance. The Faddom system is meant for system documentation in order to identify and log all IT assets. It doesn’t provide ongoing monitoring.
Faddom collects information in a non-intrusive manner to avoid impact or overhead on IT environments. It gathers the information from integration with hypervisors, cloud and other APIs, analyzing network traffic protocols among others such as SSL and SNMP.
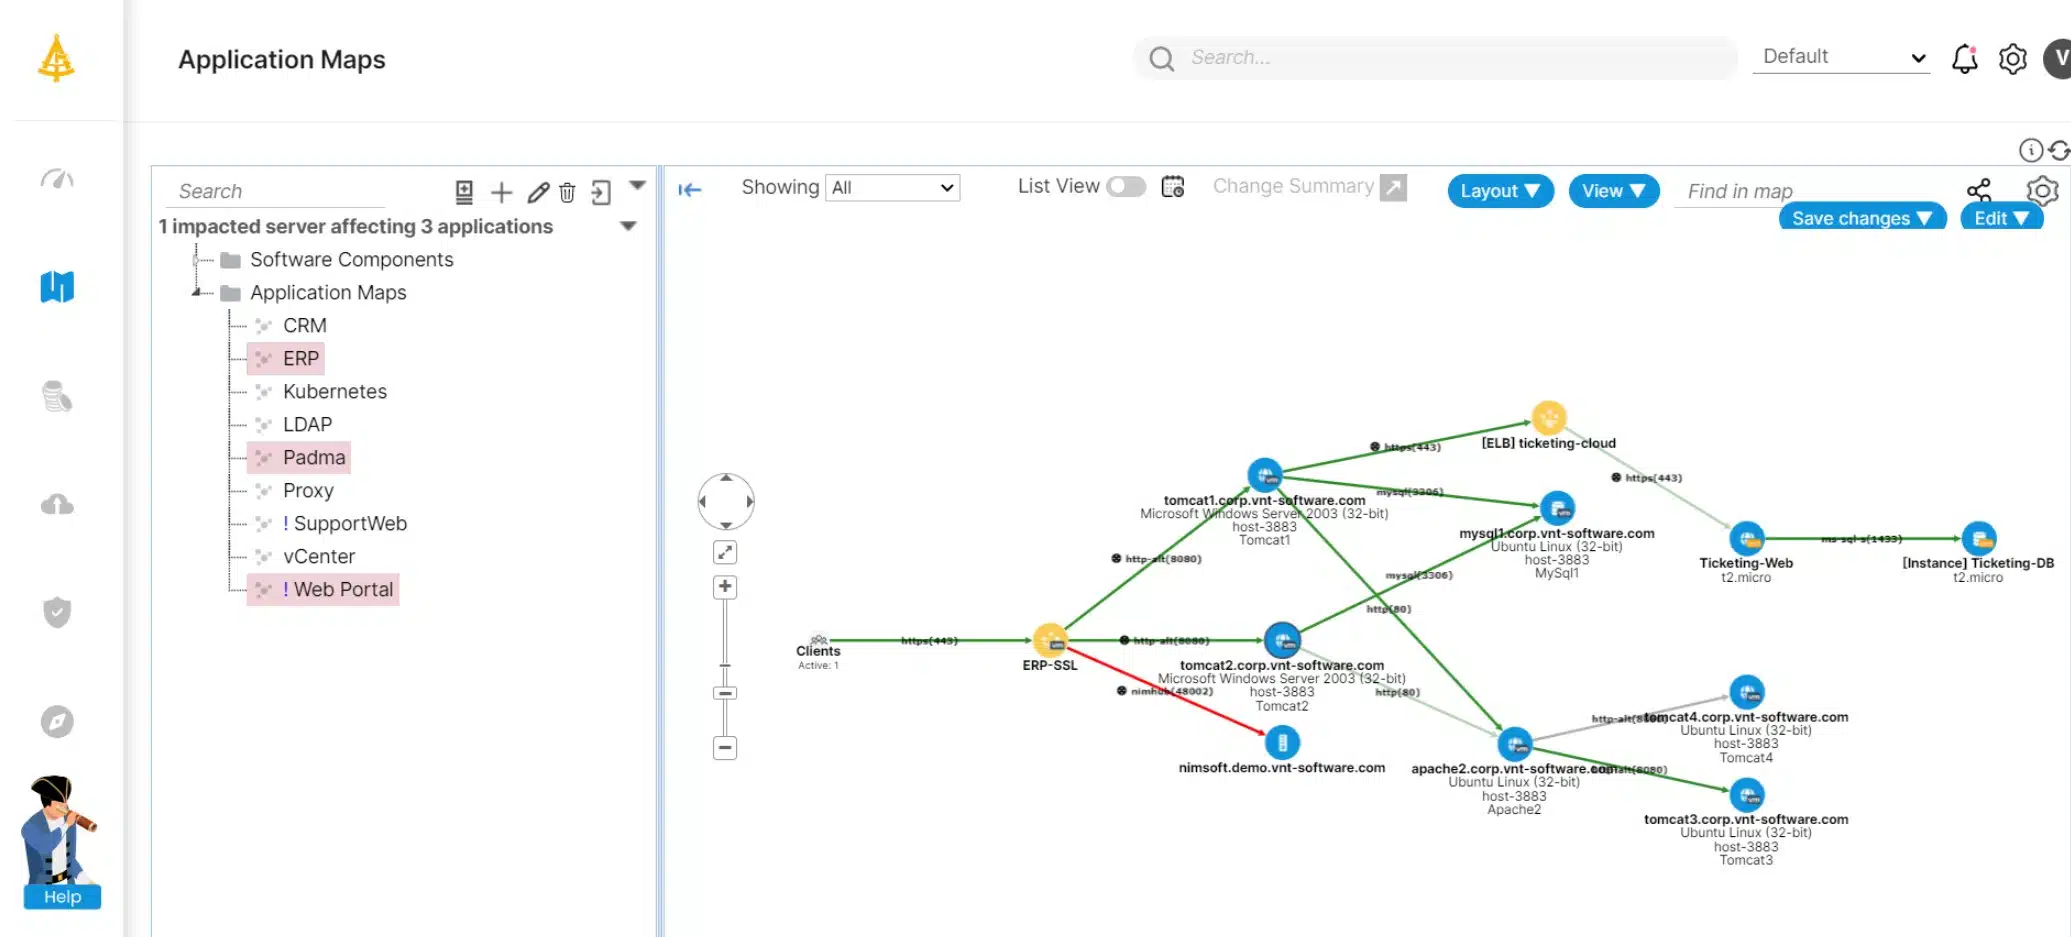
Faddom builds business applications maps from various entry points such as IPs, web servers, load balancers, URLs, and server names. From an entry point, it tracks the flow of the network traffic data to document the relationships and dependencies between the different nodes participating in that specific business service.
The Faddom chart of application dependencies includes the servers on which a business application is built and can detect installed software and versions for Linux servers using credentials. Another use for these maps is during the planning of changes such as cloud migrations, data center consolidation and transformations and developing of disaster recovery site.
Who is it recommended for?
Faddom offers a competitive pricing structure that caters to the needs of small- and medium-sized businesses (SMBs) as well as consultant partners working with clients. Compared to other application dependency mapping tools, Faddom stands out as a more affordable option. While many similar tools are bundled within enterprise software platforms that can reach high five or six-figure costs, Faddom intentionally focuses on serving SMBs. Faddom provides cost-effective solutions for organizations of varying sizes. The system can be hosted and is compatible with VMware or its own VM system, with the added capability to map cloud platforms from your server.
Pros:
- Rapid Deployment: Can be set up swiftly, allowing for immediate insights into network configurations.
- Clear Visuals: Offers intuitive visualizations that elucidate application relationships and dependencies.
- Privacy-Preserving Operation: Works offline, ensuring sensitive data is not exposed over the internet.
- Broad VM Support: Compatible with a wide range of virtual machines, enhancing its adaptability.
Cons:
- VM Requirement: Necessitates a virtual machine for its operation, missing the simplicity of SaaS solutions.
- Limited Scope: Does not include Application Performance Monitoring features, focusing instead on mapping and insights.
Faddom is a software package that can be deployed to a VMWare environment using a pre-built appliance (OVA) or can be installed on any Windows server. You can try Faddom with a free trial.
EDITOR'S CHOICE
Faddom is our top pick for an application mapping tool because this system discovers all hardware and software in a system and maps both. The service provides you with a network topology map as well as an application dependency map. The application map discovers all microservices that contribute to the creation of a user-facing system, so this tool is perfect for mapping Web applications and mobile apps. The tool is an on-premises package, which gives you maximum control.
Download: Get 14-day FREE Trial
Official Site: https://faddom.com/it-asset-management-software/
OS: VMware and Windows Server
2. ManageEngine Applications Manager (FREE TRIAL)
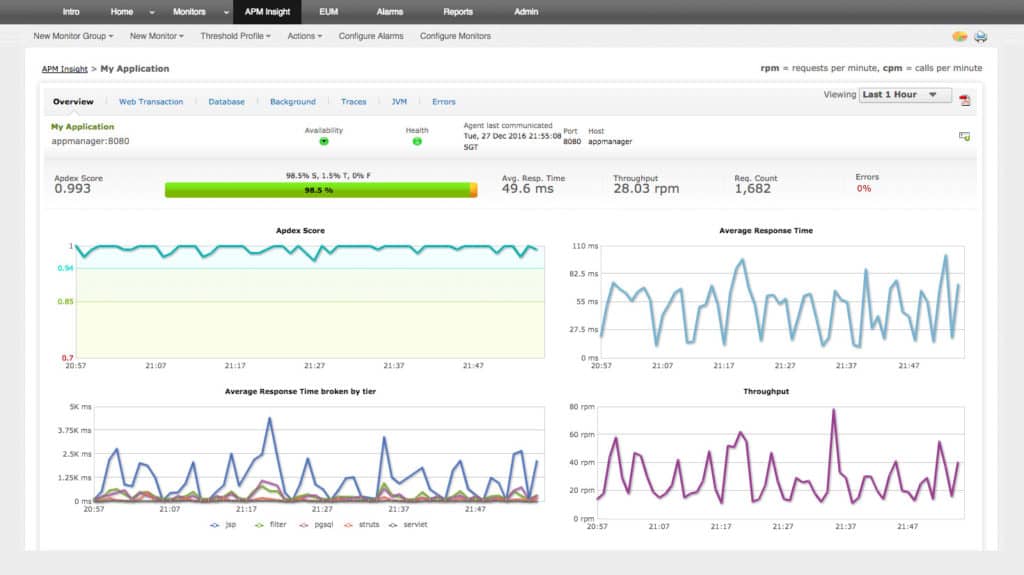
ManageEngine Applications Manager also has a detailed application discovery tool and dependency mapping feature. ManageEngine Applications Manager can discover applications, servers, databases, and storage within an IP range of your choice. You can also schedule future application scans to add new network devices to your monitoring environment.
Key Features:
- Interconnection Insights: Maps out how applications are connected, enhancing management and troubleshooting.
- Versatile Hosting: Can be deployed in both cloud environments and on-premises, adapting to various IT infrastructures.
- Log Analysis: Deep dives into application logs for detailed monitoring and insights.
Why do we recommend it?
ManageEngine Applications Manager is a very similar software package to the SolarWinds system. This tool can follow the calls within each of your user-facing systems and crawl through to identify supporting modules. It also identifies supporting resources and services and creates an application dependency map.
To develop a detailed geographical perspective, there is a business service dependency map. The business service dependency map shows a global view of your applications complete with the connections and dependencies between them.
The overview provided by this feature helps you to troubleshoot much more effectively. For example, if an application is experiencing difficulties you can view nearby infrastructure to find from where the problem originated.

Who is it recommended for?
This system is a good option for tracking application components across sites and cloud platforms. It will run on Windows Server, Linux, AWS, and Azure, which gives it a lot of deployment options. The package also provides code profiling, synthetic monitoring, and real user monitoring, making it a good choice for Web application monitoring.
Pros:
- Flexible Setup: Accommodates both cloud-based and on-premises deployment models, offering flexibility.
- Operational Clarity: Illuminates the relationships between application performances, aiding in efficient management.
- Extensive Monitoring: Covers a wide array of metrics across applications and databases for thorough oversight.
- Dynamic Discovery: Automatically keeps track of devices and applications, ensuring an up-to-date inventory.
Cons:
- Adaptation Time: Navigating through its extensive features to fully leverage its capabilities may require some time.
ManageEngine Applications Manager is available for Windows and Linux. If you’d like to know the price of ManageEngine Applications Manager you will have to request a quote from the sales team directly. You can trial the software free for 30 days.
3. Site24x7 Application Performance Monitor (FREE TRIAL)

Site24x7 Application Performance Monitor is a cloud-based system that focuses on monitoring applications but it also monitors websites, servers, and networks.
Key Features:
- Designed for the Cloud: Tailored specifically for monitoring applications in cloud environments.
- In-Depth Code Insights: Analyzes application code performance to identify bottlenecks and opportunities for optimization.
- Microservice Oversight: Keeps a close watch on the health and performance of microservices, crucial for modern applications.
Why do we recommend it?
Site24x7 Application Performance Monitor is a strong competitor to the Datadog APM and it is produced by the team behind ManageEngine Applications Manager. This tool maps microservices and servicer resources as they feed into each of your applications. It also provides a code profiler and Web application testing services.
The monitor looks into the code dependencies of applications built on SDKs such as .NET, Java, Ruby, Node.js, and PHP. It is also able to watch the performance of black-box APIs.
The service creates an application stack that identifies the interdependencies between applications. This mapping extends down to the service resources that underpin applications. The application stack supports a process tracing utility that can identify the root cause of problems that arise in websites or user-facing software.
The APM is able to monitor Cloud servers and applications that run on them. It is also able to follow the performance of serverless microservices.
The Site24x7 Application Performance Monitor has an alerting mechanism that is based on acceptable performance thresholds. The threshold levels are set by AI routines that eliminate false-positive reporting. Alerts can be forwarded on to technicians by SMS, voice call, instant messaging post, or email.

Who is it recommended for?
This is a great package for a DevOps team. This service is able to provide bug feedback for developers and when used on live systems, it can track performance offering alerts for problems. Site24x7 offers packages of all of its modules, so you get network, server, and Web monitoring tools in with the APM.
Pros:
- Unified Monitoring Solution: Offers a comprehensive platform that integrates infrastructure, network, and user experience monitoring.
- Immediate Mapping: Quickly generates accurate network maps and inventory, facilitating real-time insights.
- Coding Insights: Equips developers with valuable data for refining application performance.
- Broad Monitoring Scope: Serves DevOps teams effectively, regardless of the platform or environment they operate in.
Cons:
- Utilization Challenge: The depth and breadth of its capabilities mean a significant investment of time and effort is required to fully utilize the platform.
The Site24x7 Application Performance Monitor is a subscription service. The base package costs $35 per month when paid annually Site24x7 offers a 30-day free trial of the Application Performance Monitor.
4. Dynatrace
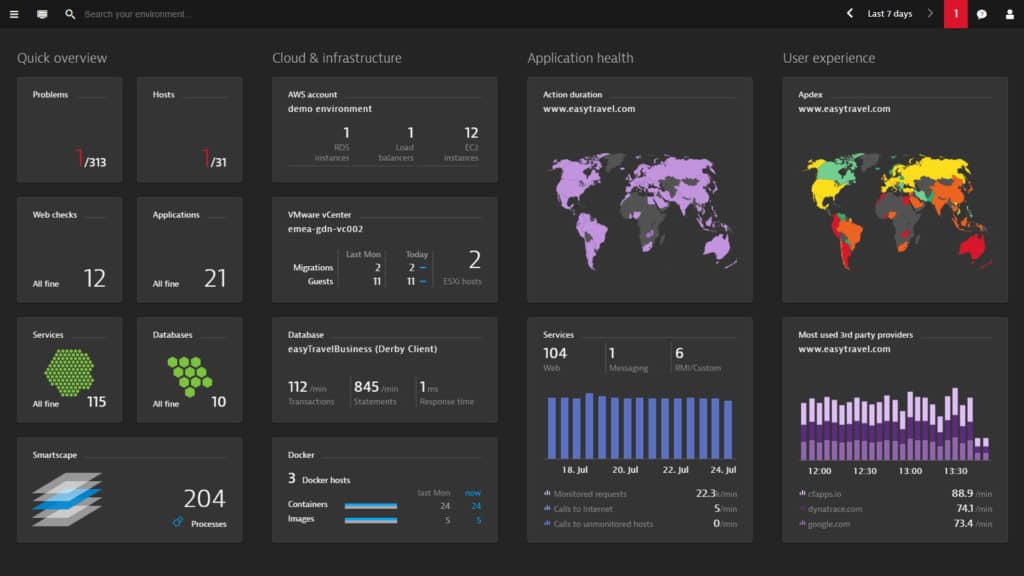
Dynatrace is an application performance monitor with network topology discovery and application mapping. Dynatrace discovers applications in real-time and plots them on a topology map. The map displays dependencies between applications, websites services, hosts, networks, cloud services, and more.
Key Features:
- AI-Powered Mapping: Employs artificial intelligence for sophisticated mapping of applications and services.
- Detailed Connection Visualization: Provides intricate details of how applications interact within the network.
- Extensive Monitoring Capability: Offers broad support for various technologies and platforms, ensuring thorough coverage.
Why do we recommend it?
Dynatrace traverses operating systems, including virtualizations and cloud platforms in its tracing of applications and their components to create a dependency map. This is a good tool for Web applications because it can implement real user monitoring and blend those findings in with its performance assessments.
The platform uses anomaly detection to identify performance anomalies. Dynatrace detects anomalies by using performance baselines and artificial intelligence. AI can automatically detect anomalies and prevent false flag alerts. Using AI has the advantage of providing complete visibility while reducing the need for manual oversight.

Dynatrace supports a range of providers meaning it can function in almost any environment. Dynatrace can monitor such technologies as:
- Amazon Web Services
- Azure
- Docker
- Hyper-V
- IBM WebSphere
- IBM z/OS
- Java
- Microsoft IIS
- Microsoft SharePoint
- MongoDB
- MySQL
- Oracle
- PostgreSQL
- SAP Hybris
- SQL Server
- VMWare
Who is it recommended for?
This is a sophisticated package that scours the full stack to identify the root cause of application performance issues. The system can examine activities on cloud platforms as well as on premises. It is suitable for businesses of all sizes and can be used for office networks and also Web applications.
Pros:
- User-Friendly Interface: Boasts a modern, customizable dashboard that simplifies monitoring tasks.
- Wide-Ranging Monitoring: Effectively oversees both local and wide area network environments, including virtual platforms.
- Instant Problem Identification: Utilizes real-time data to swiftly pinpoint and address network issues.
Cons:
- Geared Towards Large Scale: Primarily designed to cater to the needs of larger networks and enterprises.
- Investment Required: The pricing reflects the advanced features and comprehensive functionality it provides.
Overall Dynatrace is a tool designed for those looking for state-of-the-art application monitoring. The application mapping features are second to none. You can download the 15-day free trial.
5. SolarWinds Server & Application Monitor
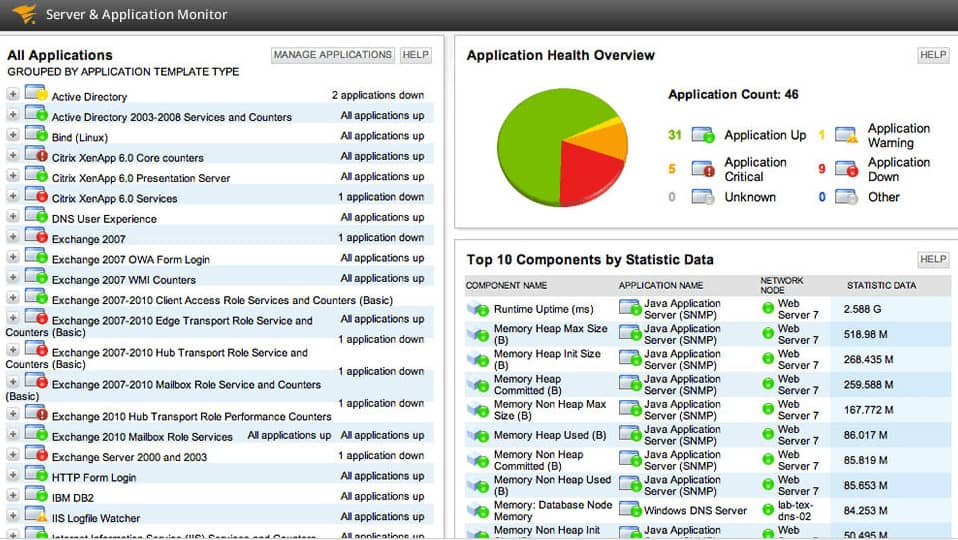
SolarWinds Server & Application Monitor is a server monitoring tool with application mapping capabilities. The software automatically discovers all applications and servers on a network upon installation. The platform identifies service components based on IP ranges and can be scheduled to scan for future devices.
Key Features:
- Instant Network Mapping: Automatically detects and lists servers and applications across your network.
- Connection Mapping: Visually represents how applications interact and depend on one another.
- Detailed Relationship Overview: Offers an in-depth look at how different applications are connected.
- Proactive Alerts: Sends early warnings about potential application and server performance issues.
Why do we recommend it?
SolarWinds Server & Application Monitor is a large and comprehensive package for on-premises installation. This tool is able to scan the running processes on your servers and then track through to discover which functions contribute to that application, which services support it, and which other applications interact with it.
Once applications have been added to the program you can view them in a geographical map graphic. They are searchable by floor, building, department, or geographic location. The map gives you an overview of your application locations across the globe. SolarWinds Server & Application Monitor with OpenStreetMaps add nodes to world maps in real-time.

Outside of the map view, there is a comprehensive dashboard that allows you to monitor the status of connected devices and applications. The dashboard shows the color-coded performance of applications with status categories such as Down, Critical, Warning, Unknown, Unreachable, Up, and External.
Who is it recommended for?
This package has a great deal of capacity and it will run on Windows Server. It isn’t suitable for small businesses or companies that don’t have any servers running Windows. The tool can track application modules and microservices through to cloud platforms, so it isn’t limited to just scanning applications running on your network.
Pros:
- Suitable for Large Networks: Designed to handle the monitoring demands of expansive network infrastructures.
- Live Network Adaptation: Updates network diagrams in real-time to reflect current device interactions.
- Worldwide Asset Monitoring: Integrates location data to manage assets across the globe efficiently.
- Tailored Dashboard: Provides the ability to customize the user interface for a more personal experience.
- In-Depth Compliance Reports: Comes equipped with a range of compliance reports for various needs.
Cons:
- Learning Curve: The wealth of features may require a significant investment of time to fully understand and utilize effectively.
The mixture of the autodiscovery, granular map view and clear dashboards make this program a top pick for visibility. The price of SolarWinds Server & Application Monitor starts at $2,995 (£2353.95). There is also a 30-day free trial.
SolarWinds Server & Application Monitor provides dependency mapping down to server resources and offers the option to link the tracking through to a network performance monitoring system. The system includes an alerting mechanism that warns of resource shortages and performance problems, giving you time to head off noticeable delivery impairment.
6. Datadog APM Service Map
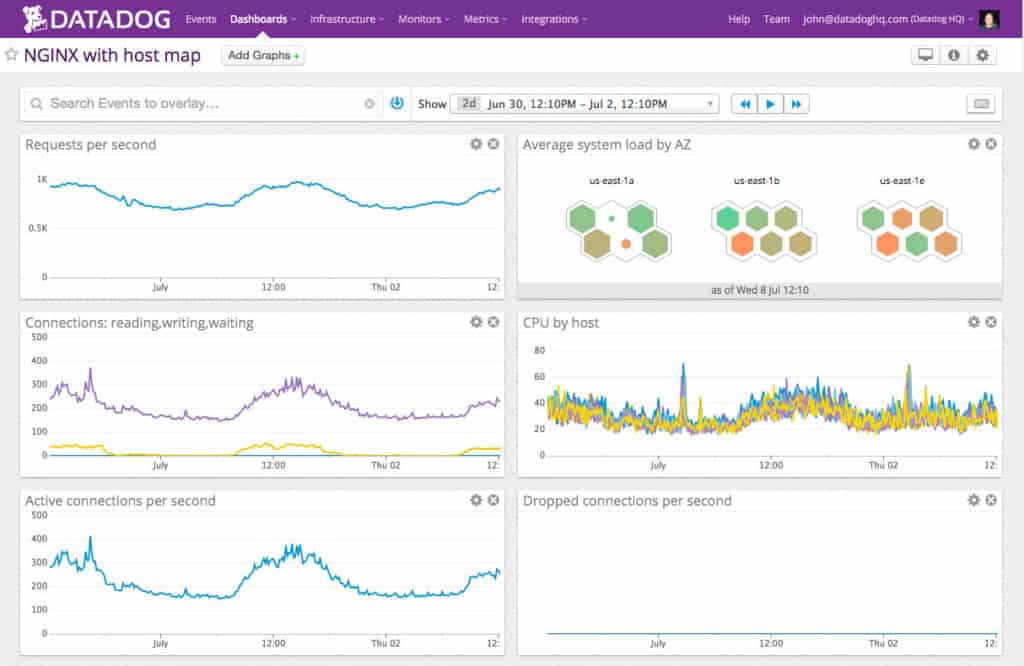
Datadog is an application monitoring tool that is popular in part because of its service map. The service map is used to visualize data flows and application dependencies in real time. The map automatically recognizes data flows from applications connected to your network and displays status data.
Key Features:
- Dependency Mapping: Effortlessly discovers and diagrams the connections between application components.
- Live Activity Tracking: Monitors application behavior in real-time, ensuring timely insights.
- Utilization Visuals: Depicts the use of resources with detailed, easy-to-understand graphs.
- Issue Alerts: Notifies stakeholders of potential problems, aiding in proactive management.
Why do we recommend it?
The Datadog APM Service Map is part of a cloud-based application performance monitor that offers a range of application tracking services in addition to the dependency map. This service is able to track applications that have been deployed on remote systems, which could have missing resources that prevent the package from working correctly.
If you hover the mouse over an application you can view data on Requests, Latency, and Errors. These are displayed as graphs on the Trace Search & Analytics dashboard. You can also use Trace Search to filter through by custom tags and error codes.
Once applications are monitored by Datadog, automated analysis flags performance issues immediately. The software uses machine learning to automatically detect anomalous activity out-of-the-box. Machine learning increases the responsiveness of your defenses so you can react quickly to problems within your underlying infrastructure.
The program supports several programming languages including Java, PHP, Node JS, Go, Ruby, and Python. There are four versions available to purchase for Datadog each with its own different pricing structures.
Datadog APM Service Map crosses environments and systems in its discovery of interlinked applications and services, creating a visualization of how your system fits together. This live application service map shows all the resources that your applications access as they run and display information flows as they happen. This tool’s records of activities are instantly available when things go wrong, providing a root-cause analysis service that will enable you to get straight to the faulty service or exhausted resource that is causing performance issues.

Who is it recommended for?
The features of the Datadog APM are specifically designed to monitor Web applications, so if you just want to monitor your on-premises software, this package is not for you. The tool is based in the clouds and priced per month per host and there is a higher plan that includes a code profiler.
Pros:
- User-Friendly Interface: Designed for ease of use, with plenty of customization options.
- Cloud-Native Flexibility: Operates entirely in the cloud, removing the need for local infrastructure.
- All-Around Monitoring: Provides a complete overview of application performance, both inside and out.
- Adaptive Topology: Automatically refreshes to reflect changes, keeping the network map current.
- Easily Scales: Accommodates growing businesses, offering monitoring solutions that expand with your needs.
Cons:
- Evaluation Period: The trial could be extended to allow users more time to assess its full capabilities.
However the per host, per month packages available for Datadog are priced as follows; Infrastructure $15 (£11.79), APM $31 (£24.37), Log Management $1.27 (£1), and Synthetics $5 (£3.93). There is also a 14-day free trial version.
7. Device42
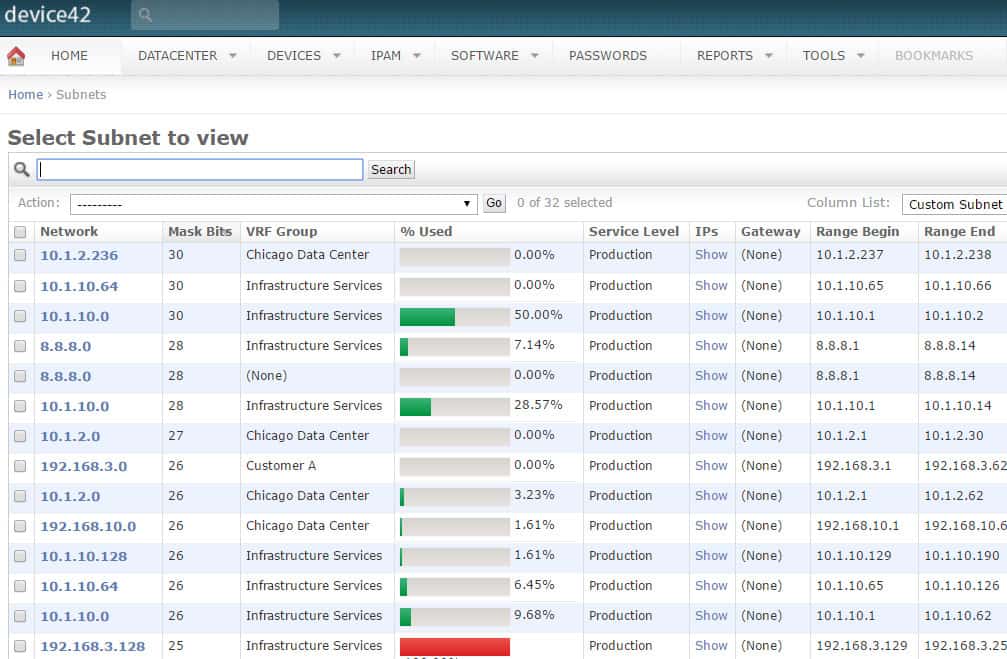
Device42 is a purpose-built application and device mapping tool. The platform produces application dependency maps that display the interdependencies between applications. The dependency maps are quite basic but they are clear enough to show you the relationship between your applications and devices. You can view maps on an application, device, room, building, or rack level.
Key Features:
- All-Inclusive Detection: Captures a complete inventory of both physical hardware and software assets.
- Adaptive Network Diagrams: Network maps refresh automatically to mirror changes in the infrastructure.
- Granular Detailing: Provides detailed visualizations down to the specific location of assets in racks.
Why do we recommend it?
Device42 is an IT asset management tool that can discover both hardware and software, creating asset inventories. The system will generate a network topology map and also scour applications as they run, identifying contributing modules, which might be microservices, running on third-party servers. This system scans cloud platforms as well as in-house servers.
Application maps also have autodiscovery to ensure your network stays updated when the topology is updated. Automatic updates help to make sure that you never get left behind when adding new devices. Automation also carries over into RESTful APIS which allow you to add additional different features.

Who is it recommended for?
Device42 has an unusual pricing structure with the Core option being very expensive for small businesses. Ythjis is probably suitable for use by mid-sized and large organizations. The tool is particularly useful for businesses that use hosted applications, such as SaaS services or packages built on microservices and APIs.
Pros:
- Scales with Your Business: Engineered to accommodate the growth of an enterprise seamlessly.
- Streamlined Updates: Automatically maintains up-to-date network topology, reducing manual workload.
- Precise Mapping: Offers detailed visual aids for site-specific technical operations, improving clarity.
Cons:
- Complex Implementation: Setting up the system initially can be complex and time-consuming.
- Limited Customization: Could benefit from more options for organizing and grouping network assets.
There are three pricing options for Device42: Core, Enterprise App Mapping, and Resource Utilization. The Core version starts at $1500 (£1,178) for devices 1-100 up to $25,000 (£19,649) plus for 2500 or more devices.
Enterprise App Mapping starts at a cost of $8 (£6.29) per node per month. Resource utilization starts at $14 (£11) per node per month and includes enterprise app mapping. There is also a free trial available here.
8. ExtraHop
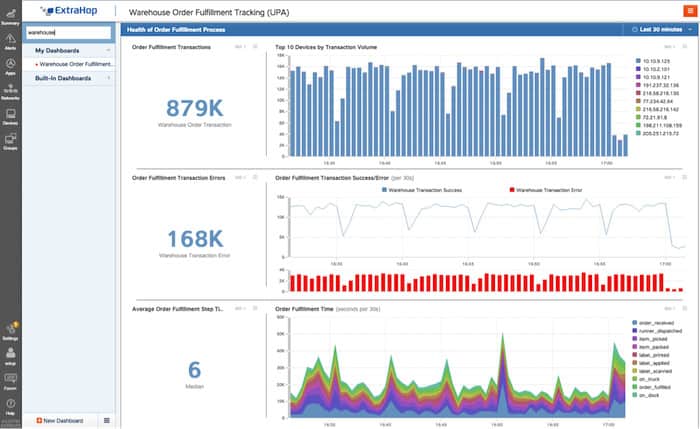
ExtraHop is one of the top application monitoring providers in this list. ExtraHop uses extensive application dependency mapping to highlight the interdependencies between connected applications. The map is automatic and will update when you connect new devices to your network.
Key Features:
- Application Dependency Insights: Delivers comprehensive analysis of how applications are interconnected.
- Early Warning System: Employs machine learning for the early detection of potential issues.
- Future-Proof Capacity Management: Anticipates and alerts on potential capacity issues to prevent performance impacts.
Why do we recommend it?
ExtraHop Reveal(x) is a flexible package that can be used for operations monitoring, for security monitoring, or for attack simulation. The system draws up application maps from its investigations into a system’s components. This app is probably stronger as a security investigation tool than as an application monitoring service.
One of the most compelling features included with ExtraHop is machine learning. Machine learning is supported by over 4,700 wire data metrics and can automate the investigation of source application performance issues to help you find the root cause much faster. Automated responses help to address application errors quickly.

Who is it recommended for?
This tool is an attractive and innovative package that performs impressive research on live systems. This system will really appeal to pen testers and it provides great system visualizations with its application dependency maps. The package is probably not the best option for ongoing performance monitoring.
Pros:
- Broad Application: Ideal for both security monitoring and gaining operational insights.
- AI-Driven Analysis: Utilizes advanced machine learning for quicker problem solving.
- Intuitive Design: Offers a user-friendly dashboard that is easy to understand and navigate.
Cons:
- Opaque Pricing: Details on costs are not readily available without inquiry.
- User Experience Learning Curve: New users may find some elements of the interface and functionalities challenging at first.
If you’re looking for an application monitor that offers an advanced UI and performance analysis capabilities then ExtraHop is a product you should definitely consider. To know the price of ExtraHop you will have to contact the company directly. However, there is a free trial.
9. ScienceLogic
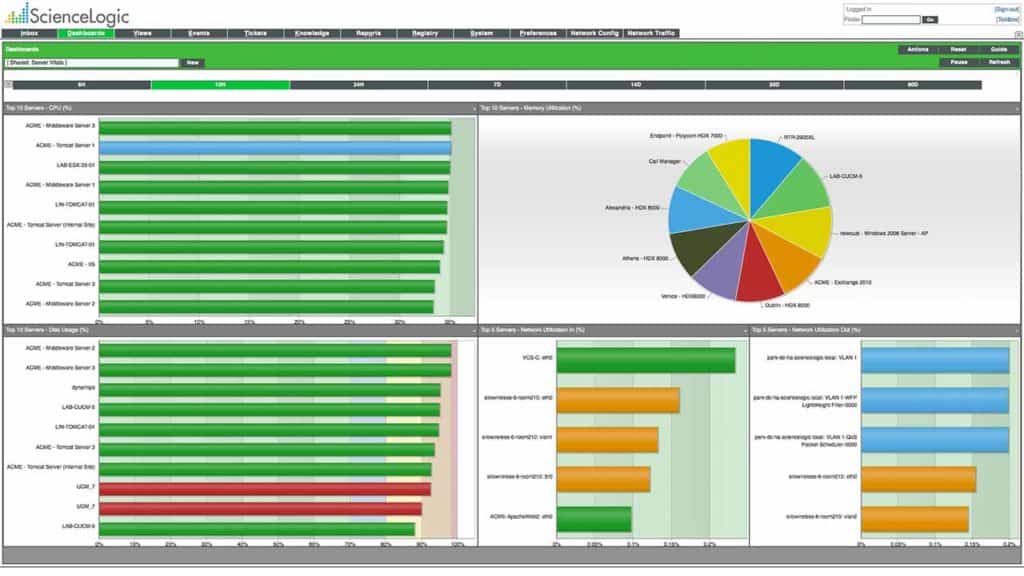
ScienceLogic is an application monitoring and dependency mapping tool.
Key Features:
- Cloud and Virtual Monitoring: Tailored for tracking and analyzing virtualized and cloud environments.
- In-Depth Cloud Integration: Provides thorough insights into dependencies across cloud services.
Why do we recommend it?
ScienceLogic excels at tracking activity between cloud platforms and also within virtualizations. It is able to map inside virtual systems and also identifies links to the servers and resources that support them. You also get a view on the application links on top of those virtual systems.
The product can automatically discover dependencies between critical applications, devices, and services. It has support for:
- VMware
- Citrix XenServer
- Microsoft Hyper-V
- Citrix
- Red Hat
- block
- FlexPod
- HyperFlex
- Nutanix
- AWS
- Azure
- Google Cloud
- IBM Cloud
- Cisco ACI
- VMware NSX
The focus of ScienceLogic’s application flow mapping is on boosting the visibility of cloud and hybrid environments. For example, the tool can discover dependencies between cloud-services to give you a comprehensive perspective of your virtualized infrastructure. Transparency will help you to better optimize your resources and stay on top of what is going on.

Who is it recommended for?
You would get the most out of ScienceLogic if you use virtualizations, virtual servers, and virtual networks because this tool is good at mapping virtual systems to physical resources. Apart from those functions, this tool can be used to track and map networks providing immediate root cause analysis.
Pros:
- Cloud Optimization: Excellently designed for cloud and hybrid environment monitoring, with detailed dependency mapping.
- Varied Dashboard Customization: Features extensive dashboard configurations for a clear, digestible data overview.
Cons:
- Pricing Clarity Needed: Cost details are not transparent and require outreach to sales.
- Potential Interface Complexity: The dashboard may become overwhelming in scenarios involving extensive network monitoring.
The experience provided by ScienceLogic gives you everything you need to catch performance issues whether on-premises or in the cloud. To view the price of ScienceLogic you will have to contact the company directly. However, you can still schedule a free demo.
10. Appmigrate
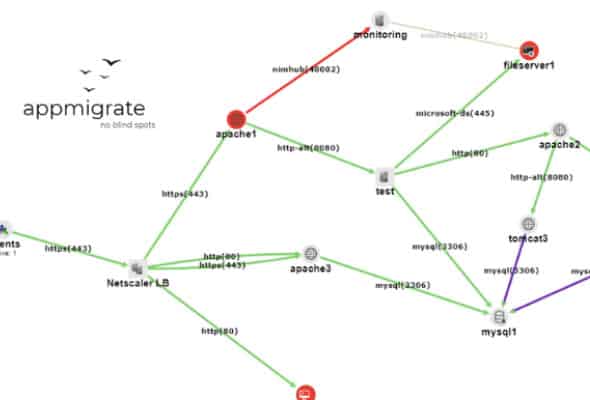
appmigrate is a free agentless application mapping tool. The program scans for applications and servers in real-time. The software displays dependencies that update automatically once you expand your network.
Key Features:
- Free Application Mapping: Provides agentless mapping of applications at no cost.
- Dynamic Updates: Ensures that maps are always current with network changes through automatic updates.
- Efficient Performance: Designed to operate without significantly impacting system resources.
Why do we recommend it?
Appmigrate is part of the Faddom group of services. It is designed to identify all applications and services specifically so that the environment can be moved over to another platform. A good use case for this package would be to see how you could move on-premises systems to the cloud.
The topology map is shown on a white canvas so that you can easily identify which applications are up or experiencing difficulties. The production value is on par with any of the paid tools on this list but it doesn’t have the application monitoring capabilities of many other competitive products. However, you can even visualize URLs on the topology map.
Who is it recommended for?
Appmigrate isn’t intended for use long-term because it is a mapping system to discover all services that need to be ported when moving to a different environment. Consultancies that migrate systems would benefit from using this package. The system installs on-site over its own VM.
Pros:
- Cost-Effective Solution: Perfect for those needing mapping capabilities without financial investment.
- User-Friendly Interface: Prioritizes ease of use with its simple and intuitive design.
Cons:
- Basic Capabilities: While effective for its intended use, it doesn’t offer the breadth of features found in more comprehensive tools.
- Specialized Use: Best suited for migration initiatives rather than ongoing network or application monitoring.
appmigrate is ideal for those who want an application mapping tool that is fast to deploy and is cost-effective. The only drawback is that the tool is relatively basic compared to other products on this list. However, if you only require application mapping then this tool is a good choice. You can download appmigrate for free.
Choosing an Application Mapping Tool
If your enterprise is making use of applications to be productive, then application mapping as a process is a must-have. Keeping visibility over virtual resources is just as important as monitoring physical devices.
From this list we recommend Faddom, ManageEngine Applications Manager, and Site24x7 Application Performance Monitor. All of these tools offer premium visibility while maintaining a competitive price.
All three products have an excellent autodiscovery feature so that your topology map grows at the same speed as your live network. However, if you are on a tight budget, appmigrate can be a lightweight application mapping alternative.
Before making a purchase we recommend trying out a couple of free trials to see which tool works best in your environment. No two companies are the same, and what works well in one might not be a good fit in another.
Application Mapping Software FAQs
What is Application Dependency Mapping?
Application dependency mapping identifies links between processes that rely on each other. The maps should look like a family tree with user-facing software calling on many applications, each of which in turn calls on many other applications.
How are Application Maps used in DevOps?
Application maps are important source material for developers, showing which other systems the application under development is expected to interact with. They are important for testing because they enable the tester to know what interfaces to check and what inputs and outputs are possible and how the actions of one application knock-on to the performance of others. During operations, application maps assist in root cause tracing when performance issues arise.
How are application dependencies determined?
A straightforward comb through the code of an app shows which other applications that program calls. A recursive search through each of those applications identifies that other applications that those call, and so on. There are tools available that perform this search automatically.
Related: Guide to Network Topologies

