
Information is a critical asset for both individuals and organisations, and its loss can lead to significant disruption, whether from cyberattacks, accidental deletion, system failure, or natural disasters. Because of these risks, protecting digital data has become an essential part of modern computing and business continuity planning.
Here is our list of the best application performance management tools:
- Progress WhatsUp Gold EDITOR’S CHOICE In its higher editions, this package expands into a full-stack observability platform that includes an application performance monitoring component. Runs on Windows Server. Get a 30-day free trial.
- AdRem NetCrunch (FREE TRIAL) Wide-ranging application and service monitoring platform for web services, cloud infrastructure, SSL certificates, SQL databases, web applications, APIs, and Windows environments. Download a 30-day free trial.
- ManageEngine Applications Manager (FREE TRIAL) Monitors physical, virtual, and cloud servers running Windows and Linux operating systems. Start a 30-day free trial.
- Site24x7 Application Performance Monitoring (FREE TRIAL) Online suite of infrastructure management tools that monitor networks, and servers as well as applications. Access a 30-day free trial.
- AppDynamics This monitor includes an application stack map so you can instantly see which underlying resource is causing application performance problems.
- Datadog Real-Time APM This cloud-based monitoring service is designed for tracking the activities and performance of Web applications, which includes discovering all supporting services and modules. Observability is achieved through distributed tracing.
- New Relic APM This cloud platform provides distributed tracing, real-user monitoring, and synthetic monitoring tools to watch over Web applications and also includes log management.
- Dynatrace Application Performance Management An online service that specializes in monitoring apps for Cloud-based businesses.
- Splunk IT Service Intelligence This tool includes an AI module that produces predictive reports that show you where capacity problems may be likely to occur.
- SolarWinds Server & Application Monitor This tool that runs on Windows Server combines both application and server monitoring. Recognizes over 1,200 applications out-of-the-box and you can be up and running in a couple of hours.
- Broadcom DX Application Performance Management This bundle of tools includes Application Performance Monitoring, App Experience Analytics, and Synthetic Monitoring.
- AppEnsure This tool is aimed at providers of online servers; it monitors both user experience on a website and application delivery statistics.
Online backup solutions, also known as cloud backup, provide a secure way to store copies of important files on remote servers that can be accessed over the internet. These services typically include automated backups, remote retrieval of data, and built-in security features, allowing users to restore information whenever it is needed.
Compared to traditional physical backup methods, online solutions are generally more flexible and scalable, as they remove the need for dedicated hardware and manual storage management. Many providers also include encryption and additional safeguards designed to protect data from unauthorised access.
This guide explores the best online backup solutions available today, comparing key features such as security, pricing, performance, and ease of use. It aims to help individuals and businesses identify the most suitable option for protecting their data and ensuring continuity in the event of data loss.
What is application performance management?
Application Performance Management, or APM, is an umbrella term that covers the monitoring and management of the performance of software applications.
This can include everything from code-level diagnostics and detecting slow application transactions to measuring end-user satisfaction levels.
Business application performance monitoring options
There are too many factors that could impair software performance for you to keep on top of all of them unassisted. Application performance management tools will allow you to keep the system running and head off disasters. With proper application insights & management, you can prevent problems that cause users to make Help Desk calls. So, this software pays for itself because it will save your IT department time and money on customer support functions.
The options open to you include on-premises software, cloud-based application performance monitoring software, services that you pay for by subscription, and software packages that you buy outright.
The best APM tools
Your choice of application performance management tool will depend on your IT support strategy – whether you run all your services in-house or prefer off-site solutions. The size of your organization and your IT budget will also be major factors. So, when you read through this list, you will need to keep your own circumstances in mind to identify the application performance management software that is right for you.
Our methodology for selecting an application performance monitor
We reviewed the market for APM monitoring software and analyzed the options based on the following criteria:
- A service that can discover all applications on a system
- A tracing package that identifies linked modules
- An application dependency mapper
- Services that can monitor server resources that support applications
- Full activity monitoring
- A free trial or a demo package that gives a no-cost assessment opportunity
- Value for money from an APM that is offered at a fair price
1. Progress WhatsUp Gold (FREE TRIAL)

Progress WhatsUp Gold is a modular network monitoring platform that can be expanded with additional monitoring capabilities. The software is offered in four editions, and every tier above the lowest includes the Application Performance Monitor. The package range also extends to monitoring for servers, storage systems, virtual environments, and cloud resources.
Key Features:
- Addition to the Core Network Monitor: Provides full-stack observability
- Autodiscovery: Documents all systems
- Application Dependency Mapping: The Component Summary Dashboard
- Monitoring Profiles: Offers prebuilt profiles for popular apps.
- Log Management: integrates collection and archiving.
Why do we recommend it?
WhatsUp Gold is a network performance monitor that uses SNMP to track the statuses of network devices. The Application Performance Monitor add-on extends this system so you can see performance metrics for both applications and networks simultaneously. The tool uses SNMP as part of its application monitoring tasks.
The entire WhatsUp Gold package starts its service with a discovery phase. The core module discovers all network devices and servers and then the APM scans each endpoint for applications. These two phases populate the dashboard with data on all of the assets on your IT system. Once that initial setup has been completed, the tool continuously re-scans and updates its data accordingly.
Once the monitor is in place, it will keep track of application performance in real-time, displaying metrics in the dashboard and generating alerts when critical performance issues arise. Both alert conditions and the dashboard display are customizable. The Component Summary Dashboard in the tool shows you a view of a selected application and all of its supporting services. This facility lets you see instantly where application performance problems are really caused by issues in other areas of the system.
The applications manager recognizes well-known applications, such as Apache, Hyper-V, and SQL Server, and adapts its monitoring activities according to the application type. You can also set up the monitor to track lesser-known applications and your own custom-built software. There are more conditions that the tool can monitor than could fit on one screen and so you can browse through the options in the tool to select which statuses you want to monitor.
A straight-forward script system enables you to combine sensors to create your own alert conditions, which can include factors from any level of your system, combining application delivery speeds with network device performance, for example.
Who is it recommended for?
The ability to extend the base package of WhatsUp Gold makes this a useful tool for any mid-sized or large organization. There are actually many other extensions that will provide you with a central console for all of the system monitoring services that you need. The software runs on Windows Server.
Pros:
- Root Cause Analysis: Identifies the system element that has failed
- Discover Bottlenecks Quickly: Spots capacity shortages
- Performance Alerts: Alerts can be tied to SLA targets.
- Full IT Stack: Consolidates multiple tools in a single platform.
- Real-time Alerts: Sends real-time alerts for quick troubleshooting.
Cons:
- Not a Standalone Product: Only offered as part of the broader WhatsUp Gold platform.
WhatsUp Gold is a software package for Windows Server, although I was able to get it running on Windows. The product comes in four editions: Business, Enterprise, Enterprise Plus, and Enterprise Scale. The APM module is included in every edition except Business. You can try the WhatsUp Gold system with a 30-day free trial.
EDITOR'S CHOICE
Our editors recommend WhatsUp Gold as the best APM tool because of its proactive monitoring features. It comes with monitoring profiles for many popular applications, and you can use them straight out of the box with little customization. Similarly, you can establish the thresholds for different applications and get the required alerts in real time. Its dashboard and reports are also top-notch, as they provide a snapshot of applications’ health and performance. Additionally, it also analyzes problems to help you address their root cause. With such capabilities, WhatsUp Gold helps you stay on top of your application’s performance at all times.
Download: Get a 30-day free trial
Official Site: https://www.whatsupgold.com/
OS: Windows Server 2012 or later
You can read more about Progress WhatsUp Gold in our review.
2. AdRem NetCrunch (FREE TRIAL)

AdRem NetCrunch is a comprehensive platform for monitoring your digital operations. It offers a suite of sensors that can monitor specific aspects of your online presence, and based on this data and analysis, you can take the necessary steps to ensure their optimal performance.
Key Features:
- Cloud Monitoring: Continuously checks the performance of your AWS and Azure environments.
- Web Sensors: Uses a wide range of sensors to monitor your HTTP requests and web pages.
- SSL Certificates: Protects your website’s security with SSL certificate monitoring.
- SQL Database Support: Monitors the health and performance of your databases.
- Windows Applications: Supports a wide range of Windows applications, including web servers, backups, and databases.
Why do we recommend it?
We recommend NetCrunch for its versatility and customization, as you can use it to monitor any aspect of your application. Its many sensors are useful for monitoring your web services, cloud infrastructure, databases, and more. They provide specific information, like header analysis and response time monitoring in web services, using which you can address issues before they disrupt your operations.
Similarly, for cloud services, it tracks the performance of your cloud resources and their usage, so you can optimize costs without compromising on performance. It can also send alerts about issues in your SSL certificates for uninterrupted operations.
Who is it recommended for?
NetCrunch is recommended for teams that need visibility into their digital and web-based operations. It is best suited for medium to large enterprises that have an extensive web presence or use cloud resources like AWS and Azure.
Pros:
- Scalability: Scales well to meet your growing needs.
- Broad Coverage: Monitors almost any application or cloud resource.
- Visualization: Displays data in real-time dashboards.
- Integrations: Integrates well with leading apps, like Slack and JIRA.
Cons:
- Documentation and Community Support: May be limited.
NetCrunch comes in two editions (all prices are per year):
- Professional – $3,600
- Enterprise – $5,950
Download a 30-day free trial.
3. ManageEngine Applications Manager (FREE TRIAL)
The ManageEngine Applications Manager covers applications running directly on your production servers, over virtualizations, and on cloud servers. The utility covers all of those essential services that your enterprise relies on, including Web applications, ERP suites, and databases. In total, the manager covers more than 50,000 widely used applications.
Key Features:
- Broad Application Monitoring Reach: Tracks more than 50,000 applications
- Links to Server Resources: Correlates between application demand and server resource availability
- Application Dependency Mapping: Links related systems together for monitoring
Why do we recommend it?
ManageEngine Applications Manager is a close competitor to the SolarWinds Server & Application Monitor. This tool discovers and maps all of your applications, identifying their dependencies. This system can complement the OpManager network monitoring package because both systems meet at server monitoring, giving you a full stack view.
Performance monitoring features in this tool include the analysis of SQL execution to detect inefficiently structured database queries. The delivery of transactions performed on the server, across the network and over to end-users wherever they may be is another key performance measure included in this utility. Constant monitoring will alert you of performance metric deterioration and indicate which supporting services are the cause of delivery problems.
The dashboard for the tool is feature-rich with plenty of graphical data visualizations to speed performance comprehension. That dashboard is customizable, so you can delegate tasks and allow access to the utility by role without having to give all controls to every member of your administration team. The dashboard is also accessible from mobile devices to let field technicians get access to service information while out on a call.
While your team works on its system admin tasks, the Applications Manager keeps monitoring in the background, building up a record of regular performance patterns so that it can spot anomalies in service delivery quicker and more accurately. Fault detection utilities include a root cause analysis tool and a browser simulator that lets you experience the delivery speeds that your system’s users encounter. A reporting module lets you track performance metrics through both scheduled and on-demand execution, helping you to build up an SLA proof library and communicate the activities of your support department to stakeholders.
Who is it recommended for?
This system is suitable for businesses of all sizes. However, very small businesses with few applications to track could probably make do with the limited Free edition, which provides five monitors. The software for this package will run on Windows Server, Linux, AWS, or Azure.
Pros:
- Offers On-Premise and Cloud Deployment Options: Runs on Windows Server, Linux, AWS, and Azure
- Distributed Tracking for Web Applications: Also code profiling
- Monitoring for Middleware: Can automatically detect databases, server hardware, and devices in real-time
Cons:
- Not a SaaS Service: The AWS and Azure installation options are treated as a software package for which you are responsible
The Applications Manager runs on Windows, Windows Server, and Debian, Ubuntu, CentOS, Fedora, RHEL, SuSE, Mandriva, and Oracle Enterprise Linux. ManageEngine offers this tool on a 30-day free trial. If you choose not to buy the Professional or extended Enterprise edition at the end of the trial period, you can continue to use the software for free with capability restrictions.
4. Site24x7 Application Performance Monitoring (FREE TRIAL)

The Site24x7 Application Performance Monitoring platform is a cloud-based monitoring tool that lets you analyze the performance of applications running on various platforms like Java, Node.js, Ruby, PHP, and .NET. The tool is administered remotely, so it is capable of analyzing applications running anywhere, including those running on cloud servers and mobile devices.
Key Features:
- Cloud-Based System: A SaaS platform
- Packaged into a Full-Stack Monitoring Package: Mixed with server and network monitoring
- Code Analysis: Code profiling for Web applications
Why do we recommend it?
Site24x7 Application Performance Monitoring is a SaaS package. However, it has more in common with the SolarWinds and ManageEngine tools on this list than the Datagod system. This service discovers all of your software and tracks the modules that support them. It then creates an application dependency map.
The online access model of Site24x7 is very liberating because you aren’t limited to monitoring systems in the same building. The tool is available over the internet, through a browser, so you can access it from home just as easily as you could in the office.
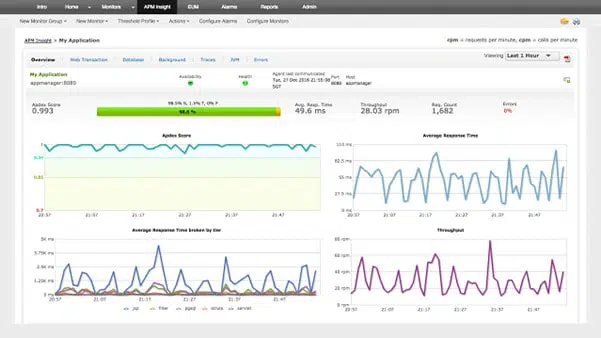
With Site24x7 APM Insight, you can drill down to the exact line of code and find the needle in the haystack. This low-level analysis enables you to determine why a specific program method or a function call is slow and helps you identify potential bottlenecks.
Performance analysis also extends to databases. The tool helps you identify slow queries and work out which supporting service is causing the slowdown. You can also view live metrics on transaction data and also view reports for varied time periods.
You can set performance alerts, or let Site24x7 work out suitable levels for thresholds itself through machine learning and AI. You can also analyze how users perceive your online services from several different endpoints. This is known as “real user monitoring” (RUM). It demonstrates the end-user experience of your system from different geographical locations and in through different devices. The tracking capabilities of Site24x7 enables you to the dependencies between applications and the stack of supporting infrastructure for each of them.
Application performance monitoring is available with the Site24x7 Pro package. This deal includes the capacity to monitor three applications. It includes 50,000 RUM page views and will cover up to five sites.
Who is it recommended for?
Site24x7 provides packages of monitoring modules that include network and server performance and activity tracking as well as the APM. You can also choose a plan that includes Real-user Monitoring (RUM) that provides performance tracking for Websites and links into the APM for root cause analysis.
Pros:
- Enables Application Performance Monitoring to be Linked to Other Services: Tracks networks, infrastructure, and websites
- System Discovery: Automatically identifies and documents hardware and software
- Alerts for Performance Problems: Send them as notifications by email, SMS, or voice call
Cons:
- No On-Premises Version: Only available as a SaaS package
Site24x7 is charged for on a subscription basis, charged monthly. You get a lower rate if you pay a year’s subscription up front. The Pro package can be enhanced by add-on deals that get you the capacity to monitor more applications, or more servers or websites. You can get a 30-day free trial of Site24x7’s Pro plan.
5. AppDynamics

AppDynamics started as an independent company, but it is now owned by Cisco Systems. The involvement of this networking giant should see this monitoring system evolve into an industry leader, so this is one to watch.
Key Features:
- Deployment Options: On-premises or cloud-based
- Tracks Data Movements: A unique method to thread together application dependencies
- Application Stack Monitoring: Correlates the activity between stack levels
Why do we recommend it?
AppDynamics is a system monitor that you can install on your own server or access as a SaaS package on the cloud. The Application Monitoring unit is centered on the concept of “application flows.” These denote how data passes between applications in the execution of a business process.
The dashboard for the service is very busy and it focuses on your applications and the services that support them. Another view of performance data follows user cases to show the speed of delivery and the demand for different services and applications from your enterprise. As there are almost no infrastructure metrics in this tool, you would probably choose AppDynamics for online businesses that are entirely provided by Cloud services.
The application stack map, shown in the illustration above explains the performance trends of all of the apps that are active on your system in a real-time monitoring display. The services that support those applications are also included and problems highlighted in those supporting systems may highlight status issues. These issues, with the underlying infrastructure, would need to be investigated with a separate monitoring package.
The software monitors your application software in real-time and builds up historical data, enabling it to create a baseline of standard performance. This alone might prompt you to make changes in your capacity provision if it displays poor performance. If everything looks good at the baseline, you can progress to the diagnostic tool to see whether the applications perform well around the clock. You will be able to identify which applications are likely to run into trouble in times of high demand. The user experience module of the tool lets you see where all the demand for your services comes from and which products and services are the most popular. This is a great tool for business analysis as well as application performance monitoring.
Who is it recommended for?
The tool offers a series of plans and you need to go up to the Premium and Enterprise editions to get Application Monitoring. The prices for the on-premises package are easier to understand because each of the plans is charged per CPU core. The cloud version is charged through a rate of credits per monitoring action.
Pros:
- Central Packages are Priced per CPU Core: Add-on units available
- Fast Root Cause Analysis: Based on application dependency maps
- Includes Data Flow Tracking: Records how data gets processed
Cons:
- Good for Application Monitoring: Not so hot at network monitoring
The AppDynamics package can be installed on Windows Server or Linux. This version is available in four editions – the first of these, called Infrastructure Monitoring, doesn’t include application monitoring. All plans are priced per CPU core. There is also a SaaS version, called AppDynamic Cloud. This is priced by a system called MELTS, which stands for Metrics, Events, Logs, and Span (nothing for “T”). You pay for a MELTS allowance.
6. Datadog Real-Time APM

Datadog offers Cloud-based monitoring for infrastructure, applications, and event logs. You can sign up just for the application performance monitor or use all three systems in combination to improve service visibility. All of these services are charged for by subscription and the price depends on the number of hosts that you operate. The system can monitor on-premises, cloud-based, and hybrid systems.
Key Features:
- SaaS Package: Hosted in the cloud
- Code Profiling: Traces through Web application code
- Distributed Tracing: Telemetry to monitor third-party microservices
- Application Dependency Mapping: Identifies connections between systems
Why do we recommend it?
The Datadog Real-time APM is a SaaS package that provides distributed tracing and code profiling. The tool is able to trace all of the functions that feed into the applications that you know about. Sometimes, the functions, provided as microservices, rely on other microservices. The Datadog system traces them all.
Datadog monitors every request for an application and tracks its delivery, which involves examining events down the application stacks. Any anomalies that appear during the delivery of the application causes an alert trigger. Those alerts will accumulate, so you will instantly be able to see in the dashboard what application is in trouble and which service seems to be the cause of the problem.
The dashboard is very attractive and integrates graphical data representation to ease status recognition. You will be able to switch views to focus on the end users that are experiencing the worst performance and zoom in on individual users to examine the problems that application delivery encounters in that session.
You can customize the dashboard and even create different views to assign to individual team members. The system includes APIs, so you can even integrate elements of Datadog’s dashboard into your own corporate system monitoring pages. Interfacing between Help Desk software and Datadog reduces the need for support staff to switch between applications to tie in human error notification with automated alerts.
You will get more assistance from the Datadog Real-Time APM if you integrate it with the company’s infrastructure package. The two packages are designed to share data, so the trace-through application performance down to infrastructure statuses is seamless.
Who is it recommended for?
This application performance monitor is dedicated to tracking the activities of Web applications. The distributed tracing feature is useful for following the activities of functions that you don’t actually own or host. You can choose a plan that also gives you a code profiler, which shows each line of code as it executes.
Pros:
- Fast Problem Identification: Aided by the application dependency maps
- Specializes in Web Applications: Get the Infrastructure Monitoring module for middleware monitoring
- Automatically Identifies Coding Errors: Analyzes Web application code
- Interfaces with Team and Project Management Tools: Jira, Spinnaker, and PagerDuty
Cons:
- Short Trial Period: Only 14 days
Datadog APM is hosted in the cloud, which means that you don’t need to install and maintain the software. Furthermore, the cloud location of this package enables it to view other systems that are hosted remotely anywhere in the world because it is not bound by one host or network. The tool tracks all underlying modules and services so it can identify when contributing support systems are the real cause of performance problems. An optional extra, the continuous profiler, offers scanning and is ideal for DevOps teams for use in a CI/CD pipeline.
There is a free version of the infrastructure monitor that will manage data from up to five hosts. You can’t get the APM for free perpetually, but you can get a 14-day free trial.
7. New Relic APM
New Relic is a SaaS platform that provides 16 modules for system monitoring and the APM is one of them. The other modules include Infrastructure to monitor underlying services and server resources, Browser for real user monitoring, OpenTelemetry for distributed tracing, and Synthetics for web application testing.
Key Features:
- A SaaS Platform of Many Monitoring Modules: Cloud-based
- Hybrid System Monitoring: Monitor on-premises and cloud systems
- Code Profiling: For Web applications
Why do we recommend it?
New Relic APM is a SaaS service that is delivered from the cloud. The application monitoring functions that you find in some other APM packages, such as Datadog, are spread across different modules on the New Relic platform. These include distributed tracing, serverless and microservices monitoring, and code profiling.
The New Relic system is an online service and if your infrastructure is also provided by Cloud services, the monitoring software will integrate directly with them. The monitor can be integrated into AWS, Google, Microsoft Azure, and Rackspace hosted servers. It can also integrate with your own on-premises servers.
The service analyzes events by inspecting the performance of code written in the seven most frequently-used languages for online services: Java, Node.js, PHP, .NET, Python, Ruby, and Go. This means that it will also be able to trace the activities of your custom software, not just the well-known pre-written applications.
The APM monitors all of your internet traffic including that originating from mobile apps. This service is tailored to online businesses, such as information websites, and web stores. The tool can support the migration of applications from on-premises servers to cloud services and it is also helpful when managing the release of new products or revamping existing web services. Both data transfers to the Cloud server of New Relic and data storage are covered by encryption and user authentication.
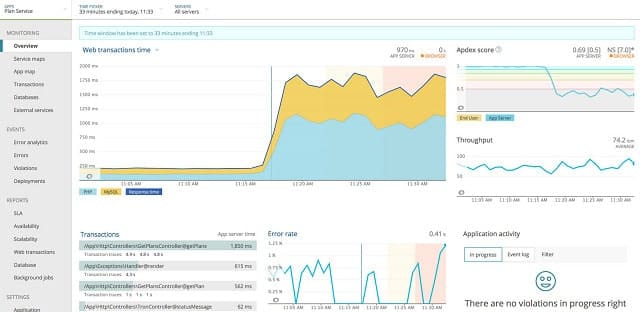
The dashboard for the service includes a lot of graphics to help you identify problems and performance successes rapidly. The main information that you need is all there in the application monitoring display. You will see response times, throughput metrics, and error rates both as figures and as time-sampled graphs. You can also track individual visitors’ journeys through your website as well as getting overviews of application performance. The interface includes database monitoring and you can search through collected data to analyze performance issues.
The dashboard includes team collaboration features, such as information sharing and note-making. You can customize the dashboard and create user groups, giving different team members access to different data views and controls. The New Relic APM can be integrated with help desk management systems.
Who is it recommended for?
Subscribers to New Relic get all of the modules, not just the APM. The system is offered in three plans, which relate to the number of users and the amount of data that your collect about performance rather than the modules that you get. This package is particularly geared toward monitoring web applications.
Pros:
- Distributed Tracing: Monitors third-party APIs and microservices
- Can Integrate into Hosted Server Solutions: Such as Rackspace
- Free Tier: Also available to paying customers who need more capacity
Cons:
- Get the Entire Platform: You can sign up for just one module
There are three plans for the New Relic platform: Standard, Pro, and Enterprise. All plans get access to all of the 16 modules on the platform. The price structure is complicated and offers three user types with different access levels. The data throughput capacity and data retention periods are two other factors in the pricing. You can get one full user on the Standard plan for free.
See also: Improve Java Application Performance
8. Dynatrace Application Performance Management
Dynatrace specializes in support software for Cloud-based systems and web enterprises. The software can be installed in-house, or you can access it on the Cloud. The pricing structure also gives you options; you can buy an annual license or buy the software outright.
Key Features:
- A SaaS Package: Hosted in the cloud
- Website Monitoring: Synthetic and real user monitoring
- Log Management: With tools for manual data analysis
Why do we recommend it?
Dynatrace Application Performance Monitor is the Operations side of this DevOps platform. The system additionally provides development testing services for new applications on their way to release. Operations monitoring is based on AI methods that link through to the Infrastructure module to identify when resources are going to run short.
Even if you choose to use the system online, you still need to install an element. This is called OneAgent. This is the data-collecting monitor that reports back to the analytical engine which may be on your server or operated remotely by Dynatrace. The OneAgent monitor installs on Windows Server, Windows, Linux, and Unix. If you choose to install the entire system in-house, you will need Linux to host it.
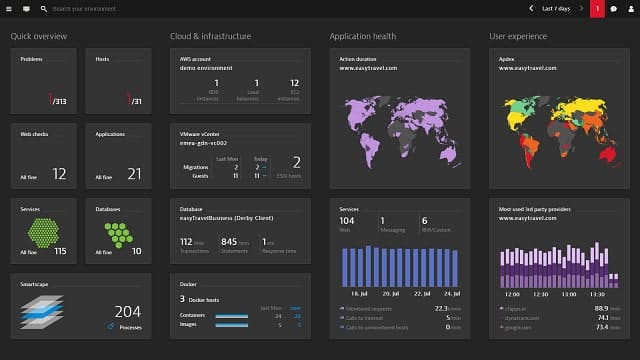
The Dynatrace structure covers Cloud infrastructure with one package or applications, hosts, and services for in-house systems with a different package. Apart from that division of service, the software isn’t sold as specialized modules, so you get infrastructure monitoring and user experience tracking with the application performance management system.
The Dynatrace methodology observes your application performance from two angles. One aspect focuses on the mechanics of delivery and that reaches down into infrastructure performance and produces metrics on the throughput of application execution. The other viewpoint is user experience. The software logs each visitor and measures application usage and response times per session.
Who is it recommended for?
Dynatrace is suitable for monitoring Web applications and other internet-based systems. It can be used for security testing in a CI/CD pipeline and for live modules. This package is a good choice for companies that develop applications and then support them. For example, SaaS providers could use this system.
Pros:
- AIOps: AI for service discovery and resource requirements forecast
- Full-Stack Observability: Has an infrastructure-only option
- An Unusual Charging Structure: A rate per hour
Cons:
- Not So Hot at Network Monitoring: Designed more for application monitoring
The Dynatrace package also includes “synthetic monitoring.” This is a planning tool that emulates the actions of users and can generate expected visitor volumes. This is useful when you plan to add new pages and services to your website. The information you glean from these application tests can warn you of any need to increase infrastructure capacity and also help you optimize the location of the new pages on your website.
9. SolarWinds Server & Application Monitor
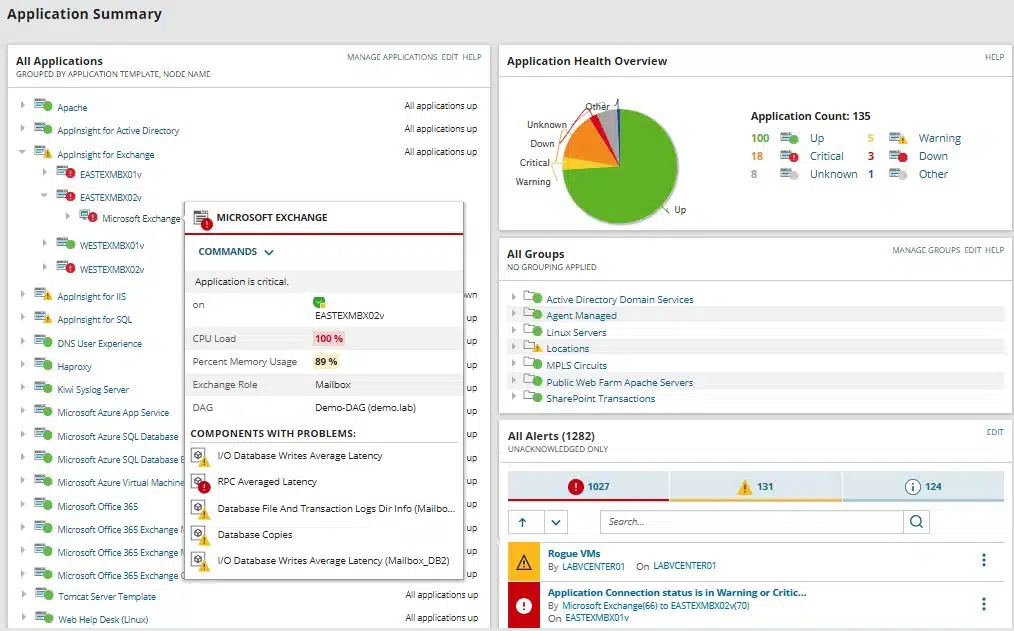
If your IT department supports a large organization, you will need an application manager that integrates with other infrastructure monitoring modules. SolarWinds provides a suite of infrastructure support tools that are all written on the same platform. These tools all share data, so the more of them you implement, the better the insight you will get into the performance of your applications and all of the services that support them.
Key Features:
- Automatic Discovery: Scans server processes to discover applications
- Application Dependency Mapping: Links applications by observing interactions and records their supporting services
- Cloud Service Monitoring: AWS and Azure
- Uses Multiple Reporting Services: REST API, WMI, SNMP, and PowerShell scripts
- Server Monitoring: Tracks the availability and total capacity of CPU, memory, and disk space
Why do we recommend it?
The SolarWinds Server & Application Monitor discovers all applications and identifies how they interact with each other and with the services of servers. The tool keeps track of the availability of server resources as well as providing an application dependency map. With these two services, the package identifies the root cause of application problems.
The performance of applications is very closely tied to the performance of the hosts that the software runs on, so it is a very good idea to get a management tool that combines both application and server monitoring and that is what this software provides. The servers that you include in your management environment can be spread across several sites, and the tool will also monitor Cloud servers operated by Azure or AWS.
The monitors and displays of the dashboard don’t rely on a “one size fits” all strategy. The software adapts to show critical information related to each application, so you will see different metrics for a database management application from what you would for a web server. This adaptability is driven by a series of templates. The Server and Application Monitor includes more than 1,200 templates that cover all of the major applications that are available on the market today.
The server monitoring element of this software extends to the statuses of the storage server, which may be on-premises or in the cloud. You can extend the depth of information gathered by this module by adding on the SolarWinds Storage Resource Monitor.
A great feature of this tool is the AppStack module. This gives you a visual representation of the applications that are running on your system, with all of the support layers of services and hardware shown in a stack below each. So, you can see the status of the application, the metrics for the application server that it runs on, and, if you are operating a virtual environment, all of the servers and networks that underlie that virtual machine. This is particularly useful if you operate applications in a Cloud environment or remote servers because it helps you see within an instant where underlying services are dragging your application performance down.
SolarWinds sells a perpetual license to this software, so once you pay for it, it is yours forever. However, the price only includes the first year of support and updates for the tool, so you will have to pay for support in subsequent years. This software is only available to load on the Windows Server environment.
The monitor installs in minutes and it will discover all of your applications and server statuses itself automatically. If you also buy the SolarWinds Network Performance Monitor and the SolarWinds NetFlow Traffic Analyzer, you will be immediately in control of all of the factors that could cause your business’s applications to fail or perform badly.
Who is it recommended for?
This system is suitable for mid-sized and large businesses. It is an on-premises software package that runs on Windows Server. It is able to monitor cloud platforms as well as on-premises servers. Thus, the businesses that would benefit most from this package are those that employ cloud-based and on-premises systems.
Pros:
- 1,200 Integrations: SolarWinds calls them templates
- Monitors SaaS Usage: For systems such as Microsoft 365
- IaaS and PaaS Monitoring: Infrastructure-as-a-Service and Platform-as-a-Service
- SLA Tracking: Set alert rules to coordinate with your service level agreements
- Alert Forwarding: Send alerts as SMS or email messages
Cons:
- Not a SaaS Tool: This is an on-premises package for Windows Server
The Server and Application Monitor can be bought individually, or in the Systems Management Bundle. This pack also includes the company’s Virtualization Manager, the Storage Resource Monitor, and the Web Performance Monitor. Another bundle offered by SolarWinds combines the Server and Application Monitor with the Database Performance Analyzer. This grouping is called the Applications Performance Optimization Pack and is a particularly good buy if your business is heavily dependent on an ERP system. Whether you choose the Server and Application Monitor on its own, with a combination of other SolarWinds tools, or as part of a bundle, you can get the software on a 30-day free trial.
10. Splunk IT Service Intelligence
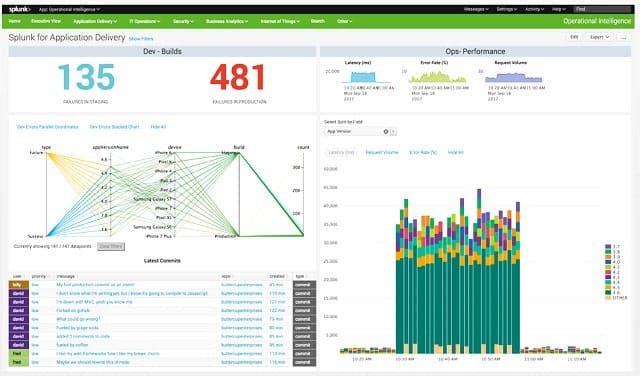
Splunk applies artificial intelligence (AI) to its monitoring software. The company produces a range of monitoring tools including infrastructure management. However, the product you need to monitor your applications is called Splunk IT Service Intelligence. Although this is a separate product to the infrastructure monitoring package, it does include features that monitor events and hardware statuses so that you can get an insight into the causes of poor application performance.
Key Features:
- A Data Processing Tool: Observability tools built on top of a long established data management system
- Capacity Demand Predictions: Projects upcoming resource needs
- Consolidates Data from Multiple Sources: Provides root cause analysis data
Why do we recommend it?
Splunk IT Service Intelligence is an add-on package to the Splunk data analysis system. The package provides service flow tracking. This is a difficult service to conceptualize because it can be adapted to a list of business activities. For example, it can be used to track sales processing for deliveries.
The AI element of the tool creates predictive reports that show you where capacity problems may be liable to occur. The application management tool also indicates peaks and troughs in demand and predict when the next surge in demand will occur. This will enable you to schedule batch jobs in quiet times and relieve the pressure on your infrastructure or buy extra capacity. If you already have an application monitoring tool, you can just opt for the add-on ITSI module for application performance. This will analyze the log files of your existing APM to focus on predictive capabilities. The tool also gathers information from your event logs to spot service delivery problems.
Splunk offers a 14-day free trial of the Slunk Observability Cloud, which includes IT Service Intelligence. The package is an add-on to one of the main IT monitoring packages of Splunk, which will manage your infrastructure. The main package that the company offers is called Splunk Enterprise. If your business doesn’t have any on-premises infrastructure but is entirely supported by Cloud services, you should opt for Splunk Cloud.
Splunk Enterprise is available on a 60-day free trial and you can get a 14-day free trial of Splunk Cloud.
Who is it recommended for?
This package can be applied to any workflow that has deadlines. For example, if you have a service level agreement as part of your business contracts, you can track these as a customer or as a provider. The tool is part of the Splunk Observability Cloud package.
Pros:
- Predictive Alerting: Leverages AI to spot upcoming problems
- Integrations Library: Extract data directly from applications
- Hybrid System Monitoring: Can monitor both on-premise apps as well as cloud/hybrid products
Cons:
- Not Cheap: Expensive when compared to similar tools
Splunk Enterprise, is on-premises software and Splunk Cloud is accessed online through a browser. Splunk software can be installed on Windows, Linux, and Mac OS.
Related post: AppDynamics vs Splunk
11. Broadcom DX Application Performance Management
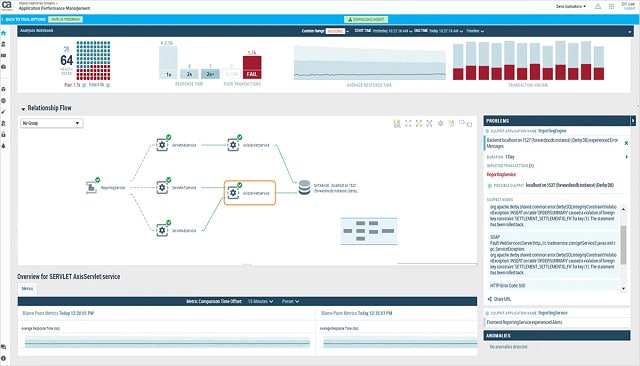
CA Technologies produces three separate packages for application performance monitoring. These are: Application Performance Monitoring, App Experience Analytics, and Synthetic Monitoring. Each of these modules is delivered on a SaaS model and charged by subscription. The company doesn’t offer a package of all three. The App Experience Analytics system covers user experience and would be a useful addition if you want to monitor a website. The Synthetic Monitoring module also focuses on user engagement and it models visitor transactions so you can analyze the performance of a website. The main APM product of CA, though, is its Application Performance Management tool.
Key Features:
- SaaS Package: Delivered from the cloud
- Three Application Monitors: Applications, synthetic monitoring, and real user monitoring
- Application Dependency Mapping: Useful for root cause analysis
Why do we recommend it?
Broadcom DX Application Performance Management is a SaaS package that deploys AI and user activity monitoring to spot performance shortfalls in an application set. Machine Learning file tunes alert thresholds, so you don’t get pestered by out-of-the-box alerts that aren’t appropriate for your user’s normal activity.
This APM is aimed at large organizations and its main feature is the ability to promote teamwork. Its key perspective is the transaction tracer that builds up a map of application components and service dependencies. The visibility of app dependencies extends to database performance. You will be able to see graphs of application delivery performance over time, which should help you spot abnormal behavior as well as peak demand and times with spare capacity.
The baseline built by the monitor gets updated constantly, so it will be able to provide you with a better insight into the normal behavior of your apps as time progresses. If you employ containers for secure app delivery under BYOD policies, the APM can see into the delivery of those apps as well. The data collected by the system extends to host performance and application code analysis. The services of Cloud-based and remote hosts are also included in the APM’s line of sight.
Who is it recommended for?
This package includes application discovery, distributed tracing, and code profiling. So, it will be of interest to businesses that use Web applications that rely on APIs, frameworks, and microservices. The system is highly developed and would be a good fit for Web producers to support their products.
Pros:
- Multiple Data Sources: Combines metrics extracted from applications with application log data
- Assisted Triage: Speeds up problem recognition
- Analysis Assistance: Waterfall charts, heatmaps, session replay
Cons:
- Short Retention Period: The Essentials plan only stores data for seven days
A higher Enterprise plan offers unlimited usage of the system. This service can be accessed on the Cloud or installed on-premises. The Enterprise plan includes the retention of data for 90 days to aid analysis. The Essentials package only gives you 7 days of data. You can get the system on a 30-day free trial, during which time all of your monitoring data is retained.
12. AppEnsure
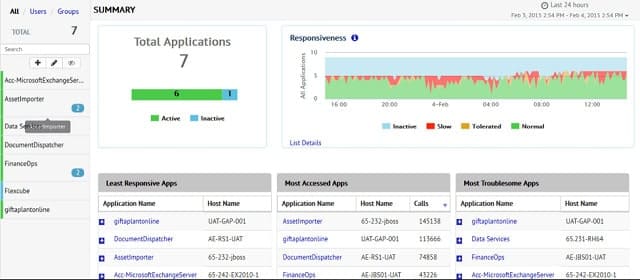
AppEnsure monitors both user experience on a website and application delivery statistics to help you provide online services effectively. The alert conditions arise from poor performance as experienced by the user. You don’t need to wait for a complaint to come in from any of the visitors to your site because the AppEnsure monitor will detect the problem. In fact, you should be able to head off delivery impairment because the monitor will identify deterioration in service before it gets to the point where users of a site notice problems. Infrastructure monitoring will lead you to the cause of mounting problems and enable you to make adjustments to resources.
Key Features:
- Web Application Monitoring: Has a special focus on monitoring Citrix Xen
- Autodiscovery: Including tracking custom packages
- AI-Based Anomaly Detection: Uses machine learning for baselines
Why do we recommend it?
Appensure starts with user-facing systems and then tracks back through their operations to discover all of the modules that contribute to them. The tool also looks at how applications interact with each other and which services they use. IT then generates an application dependency map, which can be used for root cause analysis.
The AppEnsure service is delivered online. When you begin with the service, AppEnsure software will search through your system for all end-user apps and then trace back to identify supporting apps and services. This application discovery process results in a map, which amounts to an application stack.
Once operational, AppEnsure records the performance of app delivery to every user. Initially, this data gathering allows the system to establish a baseline pattern of normal behavior. Once an acceptable level of delivery performance has been established, subsequent performance can be monitored for any anomalies or deterioration in response times that would indicate a problem in the system.
As AppStack also monitors the application stack, it can draw your attention to the service performance that is the probable cause of application delivery problems; rather than just telling you that a user-facing application is possibly encountering trouble.
The complete visibility of AppEnsure includes onsite and remote resources, plus Cloud-based services. The application stack monitoring extends to virtualized environments. It can trace the servers that support your virtual machines and identify status issues there. AppEnsure is particularly well integrated with the Citrix XenApp environment. The detection methods of AppEnsure will detect and track pre-written applications, such as Microsoft Exchange, Sharepoint, and ERP systems. It is also able to monitor your own custom-built applications.
Who is it recommended for?
This is a cloud-based system and its tracking of supporting modules is ideal for complicated application cloisters, such as ERPs. It is also a good tool to use if you need to watch over Citrix systems – there is a special edition for that.
Pros:
- Predictive Alerts: Will trigger before performance is impacted
- Website Monitoring: Examines connectivity and delivery metrics
- User-Centric Monitoring: Measures performance in the user interface
Cons:
- Short Trial Period: The free trial lasts 14 days
The AppEnsure service is charged for on a subscription basis. You can get a 14-day free trial of the system.
Application Performance Management
No matter what type of business you have, application performance management is an important task of the IT department. In online businesses, the applications offered to visitors are the only contact that customers get with the organization, so guaranteed application performance is essential. For all other types of businesses, application performance is still a very important element of the IT system, and heading off problems will keep the business running and reduce the number of Help Desk calls.
You don’t want to rely on the system’s users to tell when the applications in your business are experiencing problems. If the service gets so bad that users notice, you have already failed in your job as an IT manager. Keep on top of your application performance with one of the tools on our list.
Do you use an application performance monitor? Do you use one of the systems recommended in our list, or have you installed a different APM? Leave a message in the Comments section below and share your experience.
Application Performance Monitoring FAQs
What software is best for full-stack application monitoring?
Full-stack monitoring examines all supporting services, operating systems, and hardware that serve the delivery of an application. An APM just focuses on examining statistics drawn from application operations. To get full-stack monitoring, you need a tool that also monitors servers and networks.
What are the best mobile application performance monitoring tools?
Mobile applications are usually frontends for cloud services. The lack of processing power on a mobile device means that even well-known applications perform most processing on a cloud server, using the app to deliver results. Therefore, the best mobile application performance monitoring tools are those that don’t just check on the processes occurring on the device but also monitor connection quality.
What is the difference between network monitoring and application performance monitoring?
Network issues will be reflected in application performance. Therefore, if there is a problem with the network, the performance data on applications will show that something has gone wrong. However, the APM won’t be able to explain the cause of the problem if the issue lies with the network. In order to drill down to spot the cause of application performance problems, you might need to go as low as the network. An APM can’t see that far, so you will also need to run a network performance monitor.
