

The Central Processing Unit (CPU), often referred to as the “brain” of a computer, is a critical component responsible for executing instructions and performing calculations. It processes data and coordinates tasks for software applications, making it essential for virtually all computing operations. A CPU’s performance is determined by factors such as clock speed, core count, architecture, and efficiency, all of which influence how quickly and effectively it can complete tasks.
Why Is CPU Benchmarking Important?
CPU benchmarking is the process of measuring a CPU’s performance under specific conditions, using standardized tests and workloads. The results allow users to compare performance across different CPUs, making benchmarking an essential tool for assessing computational power.
Benchmarking is important for several reasons:
- Performance Assessment: Identifies how well a CPU can handle tasks such as gaming, video editing, machine learning, or multitasking. This ensures users choose a CPU that meets their specific needs.
- Hardware Comparison: Enables informed decisions when selecting a CPU by providing objective performance data. This is particularly crucial in competitive markets where multiple processors boast similar specifications.
- Optimization: Helps developers optimize software by understanding CPU performance characteristics. They can tailor applications to perform efficiently on specific architectures.
- Upgrading Decisions: Assists individuals or businesses in determining whether upgrading a CPU will significantly enhance performance. Benchmarking results can quantify potential gains before making costly upgrades.
- Troubleshooting: Benchmarking also plays a role in diagnosing performance issues. If a CPU underperforms compared to its benchmark, it could indicate hardware problems or misconfigurations.
- Cost Efficiency: Organizations can ensure they’re getting the best value for their investment by selecting CPUs that meet performance demands without overspending.
CPU benchmarking provides a clear, data-driven understanding of performance, helping diverse groups make informed decisions and maximize efficiency.
What is a CPU benchmark test?
The central processing unit (CPU), also known as the “heart” of electronic devices, is responsible for executing instructions given to it by programs. These instructions include logics, basic arithmetic calculations, input/output (I/O) operations, and control sequences.
Fun fact: Contrary to popular belief CPUs are not just found in desktop computers, laptops, and servers – you can also find them in switches and routers. Even devices like smartphones and flat-screen TVs have one.
Tech companies Intel and AMD (Advanced Micro Devices) are the leading manufacturers of CPUs. Intel’s products are branded with names like Celeron, Pentium, and Core while AMD makes Sempron, Athlon, and Phenom.
A CPU benchmark test is defined as…
A CPU benchmark test is a capacity assessment done using a standard, across-the-board, test to gauge a CPU’s performance.
The tests are usually performed using local in-built command tools or benchmark software packages that are available on the market. There are also websites that offer CPU benchmark testing services.
Why do you need a CPU benchmark test?
There are many reasons why anyone would want to perform a CPU benchmark test. Among these reasons we find:
- Gamers who need increasingly faster computers – as every new generation of games eats up more and more resources during gameplay – need to know exactly how much processing power they have available to them; this is especially true in the professional competitors’ realm.
- Businesses need to know they have enough processing power available to perform their tasks – in some industries, a company’s survival can actually depend on the effective speed of their processes (which is facilitated with the help of good processing power).
- Deciding which processor to choose – between Intel and AMD, for example – anyone would realize it can be tricky because, while the clock speed is an important indicator of processing power, two processors with the same clock speeds can perform differently; hence, a benchmark test to find the best among the two.
- System and network administrators need to be on top of issues that could hamper a smooth processing environment. One such issue is the bottlenecking of processes in a CPU. A CPU benchmark test can identify processes that are hogging the CPU’s time and making other processes wait in a queue for too long
It is only after analyzing the results of CPU benchmark tests that corrective actions can be taken to resolve processor performance-related issues. After all, no amount of added system memory, disk space or bandwidth will resolve processor issues.
How accurate are these tests?
A central processing unit (CPU) benchmark uses standardized testing methods to gauge a CPU’s performance.
As a matter of fact, chipmakers use these same benchmarks to market and promote their new CPUs – or outshine their competitors. Of course, some of their performance claims might not reflect real-world usage because every CPU’s performance varies according to how it was set up, what applications are running on it, and the number or type of processes that it has to handle.
For example, the most widely-known KPI for a CPU is its clock speed. But, that can be reduced or increased (a.k.a. under and overclocking, respectively) depending on users’ preferences. This will correspondingly impact the benchmark software test results.
Fun fact: CPU clock speed measures the number of instructions it can process in a second. Thus, a 4.0 GHz can process 4 billion instructions per second.
But, clock speed alone won’t paint the whole picture when it comes to CPU performance as they usually have multiple cores – independent processors that individually process data and instructions. This means that even though the clock speed of a single modern multi-processors is not that much faster than the older single-core CPUs, they can perform more instructions – and, thus, work faster – simply because the multiprocessor- chips can do much more in one clock cycle than single-core CPUs can.
Therefore, other factors need to be included in the benchmark tests. These features include:
- Number of instructions executed – usually measured in GHz
- Registry calls per cycle – the number of times a registry key is opened, read, and closed
- General hardware proficiency factors – including its architecture and hardware build
- Fan availability and/or temperature status – overheating harms a processor and is something that would be caused by the failure of a fan
- Energy efficiency – how much electricity is being used versus how much data is being processed and how much it affects the temperature
- Raw processing power – how quickly data is being processed
- Processing efficiency – how much data is being processed at the same time in each core, for example
- Stress test – how long a CPU can process data efficiently and at full capacity
Once these aspects have been checked and their performance levels have been gauged, they will be compared against the benchmark values that are set by manufacturers of CPU units using the same tests. This will determine how good a processor’s relative performance is when compared to the standard.
How do you perform a CPU benchmark test?
Well, there are many ways you can test your processors’ performance using CPU benchmark test tools. Let’s have a look at a few:
PERFMON – Windows local command
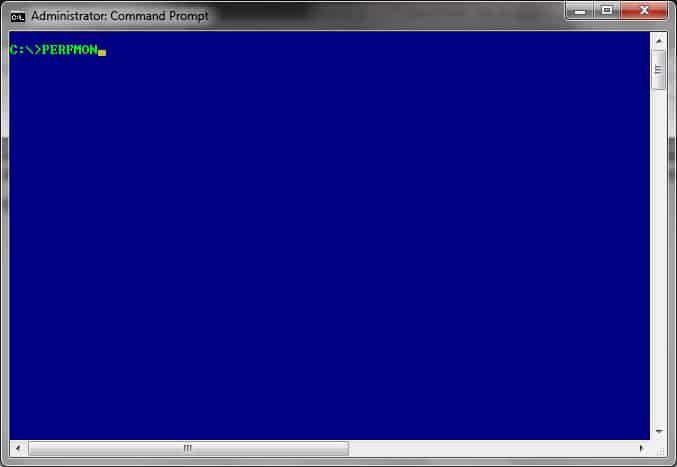
PERFMON – a Windows CLI command – runs the Performance Monitor which can be used to monitor and analyze CPU performances and tasks like identifying network bottlenecks. But, the information on CPU and system memory usage it offers can also be used for benchmarking.
All it takes to run this Windows command is to type PERFMON in the command-line interface (CLI):
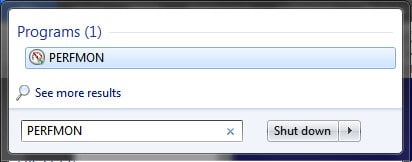
Or in the RUN dialog box:
Once the tool’s interface is running, the monitor can be found by navigating to:
Data Collector Sets -> System
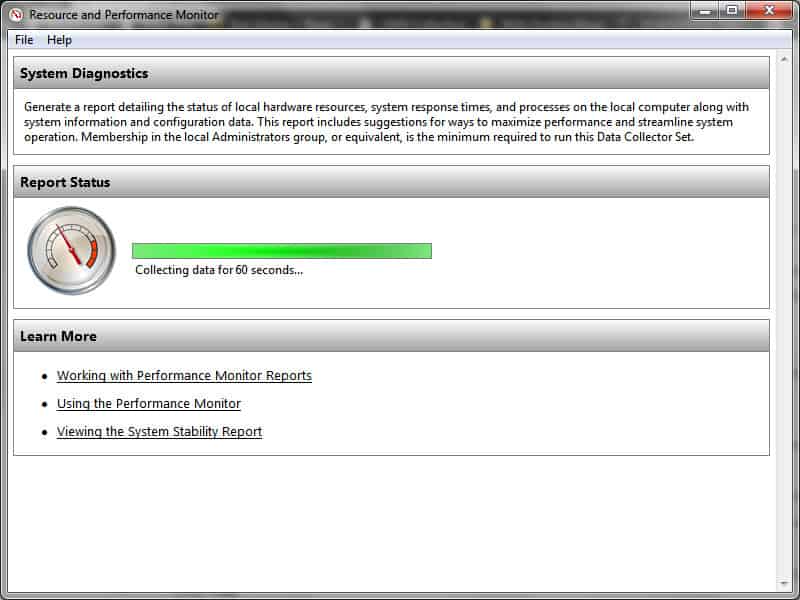
Next, right-clicking System Performance then clicking Start gets the monitor running:
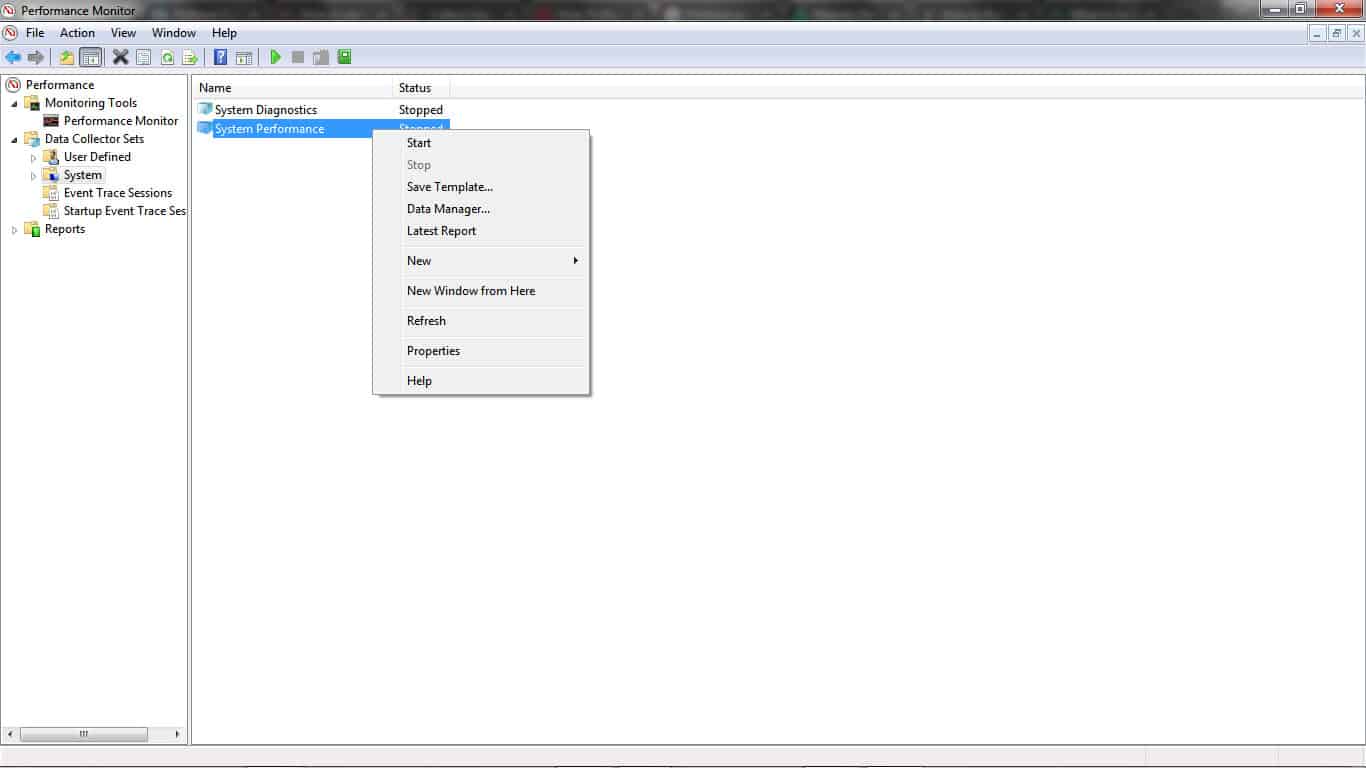
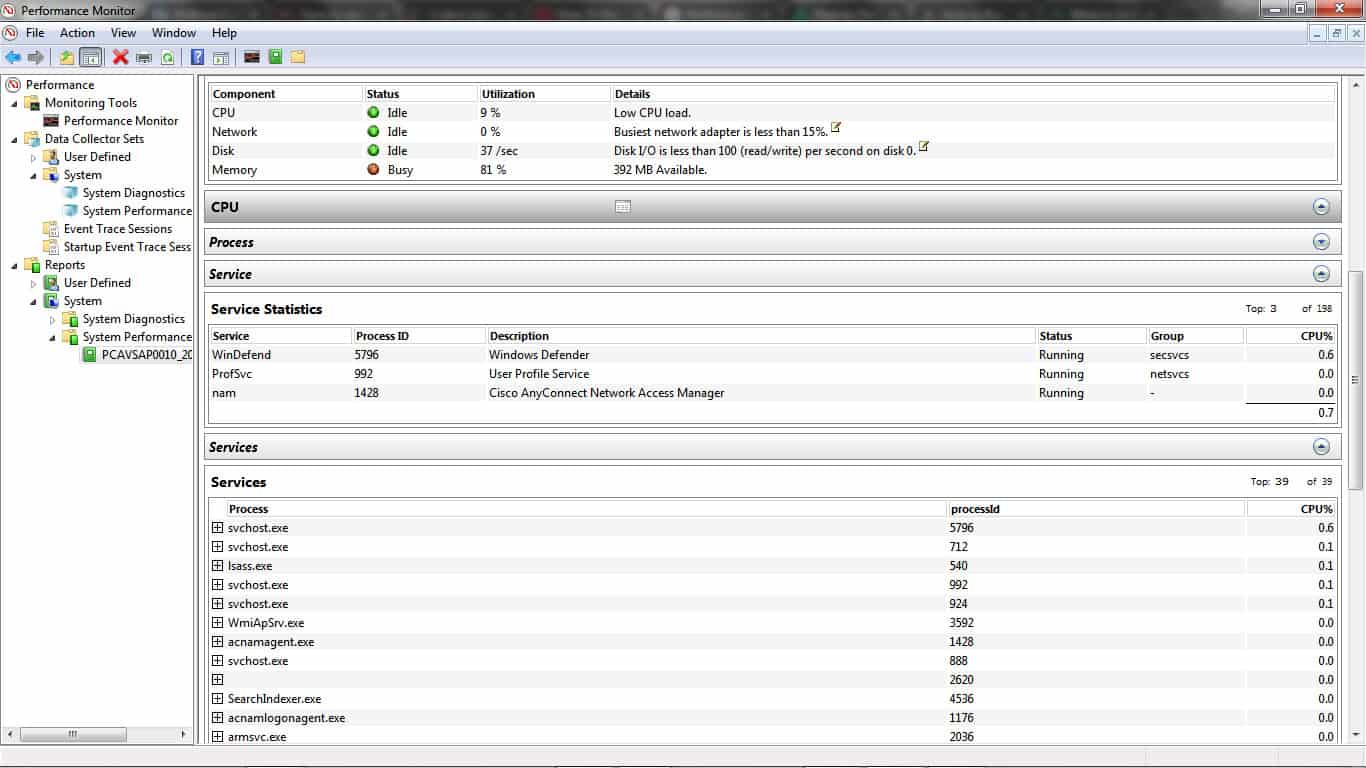
The report can be accessed by going to System – > System Performance and clicking on the computer’s name.
As can be seen from the report above, PERFMON paints a complete picture of the CPU (and many more devices).
Paessler CPU Monitoring with PRTG
CPU Monitoring with PRTG can help gauge CPU performance (as well as that of other hardware components) in servers, routers, and switches.
This benchmark software tool can run on Windows, Linux, or macOS operating systems. It also comes with over 200 pre-configured sensors that can be customized as optimal points of reference. Thus, any divergence from these custom benchmarks can then be monitored while alerts can be sent out via SMS or email.
Key Features:
- Monitors hardware and software
- Tracks resource usage
- Alerts for performance problems
- On-premises or SaaS
Why do we recommend it?
Paessler PRTG is a package that tracks the performance of networks, servers, and applications. The tool’s utilities are all optional and you decide which of them to activate. The bundle includes a CPU monitor that is offered in versions for Windows, Linux, and macOS. The SNMP monitor tracks network device CPU usage.
A few other great features this tool has to offer include:
- Windows Process Sensor: which is used to monitor processes and applications to get an insight into the ones that are causing lags or jams in a CPU
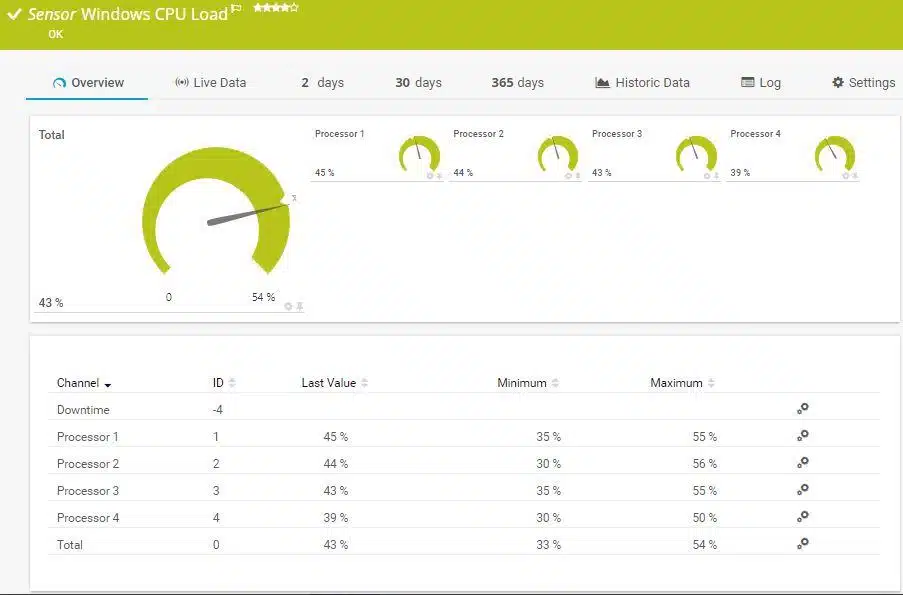
- Windows CPU Load Sensor: a feature used to gauge and show the CPU’s usage of all its processors as well as total load in percent
- SNMP Linux Load Average Sensor: this is the Linux and Unix systems version of the system load gauge which uses the SNMP (Simple Network Management Protocol)
Who is it recommended for?
This package is more affordable than the SolarWinds tool because it can be limited to just operating part of its sensor list. The more sensors that you turn on, the more you pay. If you only activate 100 sensors, you don’t have to pay anything, which is ideal for small businesses.
Pros:
- Discovery of all devices connected to a network
- Constant scanning of endpoints and network devices
- Monitors networks, servers, and applications
- Free version available
Cons:
- Doesn’t offer device management tools
The CPU Monitor is easy to install and use and is mobile-compatible. There is a 30-day free trial available from Paessler on their website.
SolarWinds Network Performance Monitor
SolarWinds is a well-known technology company that is famous for its network performance and administration software solutions. It doesn’t come as a surprise then that it also has a flagship Network Performance Monitor (NPM) solution that can be used to monitor CPU performance and other connected or peripheral devices.
NPM monitors, alerts, and reports on key CPU metrics like utilization load, temperature, and fan speed. It is a highly configurable tool allowing administrators to easily keep track of events and stay on top of issues.
Key Features:
- Network device monitoring
- Server data extraction option
- Devices queried with SNMP
- Graphs and charts
- Alerts for performance issues
Why do we recommend it?
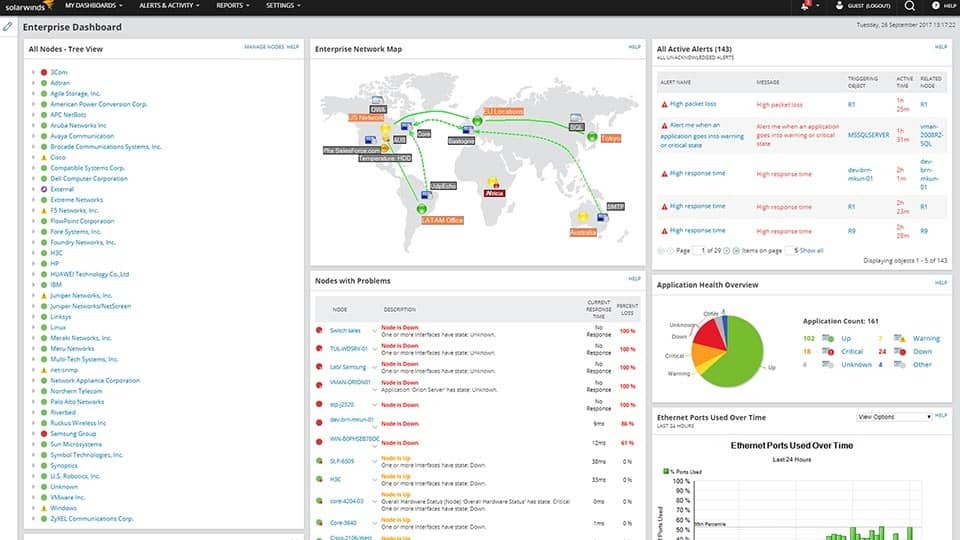
The SolarWinds Network Performance Monitor is primarily an SNMP-based tracker for network device statuses. However, it can also track endpoints running Windows that have the SNMP-gent activated. The system extracts CPU activity data as well as traffic information and hardware statuses. Autodiscovery compiles an inventory and a network topology map.
Once all the information is captured and stored – in real-time, no less – the tool can convert it into graphs for easy consumption and a quick grasp of the situation at hand. The graphs and reports are interactive which makes understanding the information very easy and not just pleasant to look at.
Who is it recommended for?
This package is aimed at mid-sized and large businesses. It is focused on network device status monitoring and it raises alerts when hardware problems are detected. It can also be expanded to monitor multiple sites. The tool is delivered as a software package for Windows Server.
Pros:
- Automatic discovery of devices connected to a network
- Creation of a constantly updated inventory
- Device status tracking
- Notification via email and SMS
- Can monitor remote sites
Cons:
- No SaaS version
SolarWinds have a free 30-day trial available for download.
Related post: CPU Monitoring Guide & Tools
CPU benchmark websites
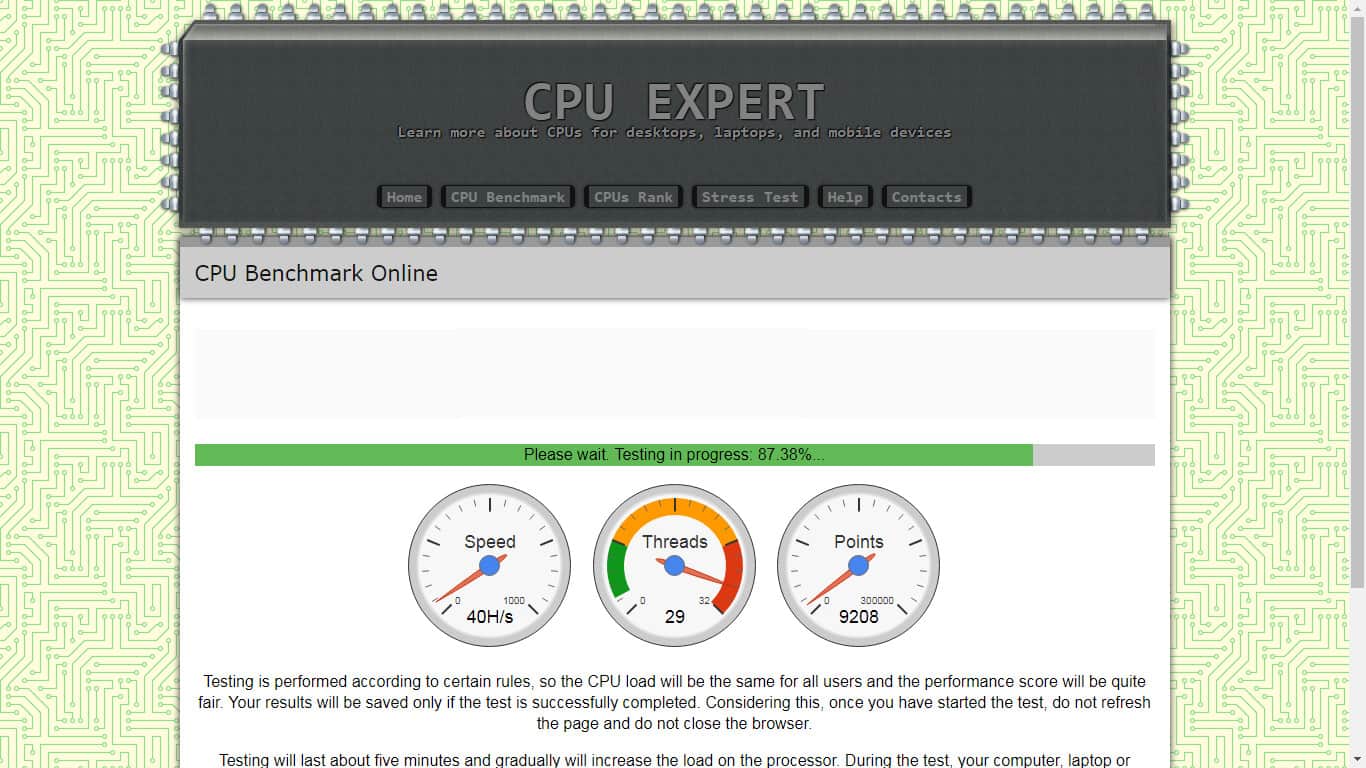
Although there aren’t many of them, there are a few CPU benchmark websites on the Internet that perform online tests. One such site is CPU Expert.
Users can run the tool directly from the test page and get a result displayed at the end.
Of course, it is highly recommended to take these benchmark results with a grain of salt and use the other tools to make sure they are accurate.
More CPU benchmark tools
Finally, and before we move on, we need to mention that other websites offer CPU benchmarking tools but require users to download the tools before they can be used.
Needless to say, this is a risky thing to do – especially when the benchmark software hasn’t been vouched for – and we wouldn’t recommend that.
But, if you think you still want to go ahead and give it a try anyway, here are three popular websites you can go to find CPU benchmark tools:
- Cinebench This is a free benchmark tool which is an ideal choice for people looking for an in-depth view of their hardware. With this tool – which is available for Windows and macOS systems – real-life scenarios are tested for more realistic performance analysis.
- Novabench This is another popular and free CPU benchmark tool that also tests the performances of several other hardware components. Once the test has run, the results are compared online with other similar systems. Included in the free version are GPU, memory, and disk read/write performance analysis.
- Download SiSoftware This benchmark tool, also free, has just recently gotten an upgrade and, thus, added more to its already solid reputation. Apart from its regular CPU testing capabilities, it now features “remote analysis, benchmarking and diagnostic features for PCs, servers, mobile devices, and networks.” Unfortunately, this tool is currently only available for Windows systems.
All the free benchmark software tools we have just seen have premium versions that come with even more features that can be used to perform other in-depth tests.
Related: Best CPU Temperature Monitors
Once your choice for CPU benchmark tools is made…
Once the decision has been made as to which tools are to be used, all it takes to perform a CPU benchmark test is to run one – or more – of them and then find out if the processor is indeed performing as well as it should be.
If all is well and good, then great; if not, read on to find possible solutions before re-testing…
What do you do AFTER the results?
The final step in the CPU benchmark testing process is the issue resolution part: if there is a slow, clogged-up CPU, the only way forward is to unclog it.
The most plausible reasons for a slow or under-performing CPU – and the ways to resolve them – are:
- Hung or looping processes: kill processes that are taking too long to finish. This is especially true if they have exceeded their normal running times.
- Too many records to process: there is no point in submitting a huge number of records to be processed if it chokes the CPU and jams the whole process. Perhaps, the processing could be done in batches using scheduled real-world tasks and after hours.
- Misconfiguration of installed applications: sometimes applications may end up choking a CPU simply because they haven’t been configured correctly. Administrators should always make sure they follow setup instructions for an optimal configuration. Regular monitoring of CPU usage spikes and then tweaking the applications that cause them should eventually eliminate the problem.
- Unneeded or bulky applications: any application or features that are not used often, if at all, need to be disabled or, better yet, uninstalled. This is particularly true for production servers that need as many resources as they can garner.
- Getting a new CPU: if all fails, then perhaps the CPU has run its course and needs to be replaced; sometimes, there’s nothing to be done with a faulty processor except replacing it.
Finally, we shouldn’t forget that tracking CPU issues and fixing them is a non-stop process that needs to be done regularly on a schedule.
CPU Benchmark Testing FAQs
Is a higher CPU mark better?
The CPU mark in benchmark testing reflects the number of transactions per second. So, a Higher CPU mark indicates a faster CPU.
Why is my CPU usage so high?
A high CPU usage indicates that there are many programs running or that a very intensive program is using up a lot of processing power. If you have very few applications launched that you can see, the source of all that CPU activity is a background process. This could be an update being applied to the operating system, a service, or a piece of software. It could also be caused by a virus or by an antimalware program cleaning out a virus.
How do I free CPU usage?
Try the following actions to free up CPU:
- Reboot – this will clear out temporary file space and stop rogue processes
- Kill a CPU-greedy process – Open Task Manager and look for processes that are using up more CPU than others. Close them if they relate to programs that you don’t need running.
- Bounce your browser – Over time, web browsers consume more and more CPU just to keep open pages present in memory. Restarting the browser clears out background processes and reduces CPU usage even if you open up the same number of sites.
- Update drivers – Inefficient drivers usually contain a poor piece of code. It is possible that the producers of those drivers realize the problem and have created a more efficient revision.
- Let automatic updates complete – If your computer is secretly installing an automatic update to an application that is currently running, the two processes could be jamming each other and holding on to resources that each would release if the update could progress.
- Change your power utilization settings – Power saving options reduce energy consumption by throttling CPU speed.
- Use a performance monitor – A computer performance monitor can spot many well-known performance issues that you might not realize are slowing down or over-using your CPU.

