A CPU monitor can tell you lots of information about how well a device is performing and can shine light on those devices that are struggling to keep up with the demands of the network.
Maintaining your devices adequately is dependent upon your ability to monitor your systems and make sure that excessive CPU usage isn’t slowing your productivity down to a crawl.
Here is our list of the best CPU monitoring tools:
- Auvik EDITOR’S CHOICE This network monitoring system is delivered as a SaaS package and uses SNMP to gather status reports on network devices that include CPU capacity and utilization. Start a 14-day free trial.
- Site24x7 Server Monitoring EDITOR’S CHOICE This cloud-based system monitors servers and workstations, tracking the capacity and utilization of CPU, memory, and disk space on each of them. Start a 30-day free trial.
- Paessler PRTG Network Monitor (FREE TRIAL) An all-in-one network, server, and application monitoring system. Network device and server checks include CPU monitors. Start a 30-day free trial.
- ManageEngine OpManager (FREE TRIAL) A network and server monitoring solution that can track 25 metrics related to CPU monitoring and performance. Runs on Windows Server and Linux. Get a 30-day free trial.
- TeamViewer Remote Management This package of remote monitoring and management systems (RMM) includes CPU monitoring for endpoints and network devices.
- Atera A remote monitoring platform designed for MSPs that includes server monitoring functions.
- SolarWinds Engineer’s Toolset) A collection of more than 60 tools for infrastructure monitoring that includes CPU monitoring for all connected equipment.
- SysGauge A monitoring toolset that includes server and device CPU monitoring. Available in free and paid versions.
- AppDynamics An applications monitor that keeps track of server statuses, including CPU performance.
- Nagios XI A network monitor that includes server monitoring functions, such as live CPU utilization and capacity checks.
- Connectwise Automate A highly customizable infrastructure monitoring package that includes scripts for task automation. The tool includes CPU checks for network devices and servers.
See also: Best CPU Temperature Monitors
The best CPU monitoring tools
CPU or central processing units need to be managed in the same way as any physical device in order to stay in operation. In this article, we’re going to look at some of the best CPU monitoring software tools to see which is best for monitoring CPUs.
Our methodology for selecting CPU monitoring tools for this list
We reviewed the market for CPU monitoring systems and assessed the options based on the following criteria:
- A package of endpoint performance monitors
- Resource capacity and utilization trackers
- Options for watching CPU utilization on network devices
- Facilities for historical analysis and requirements planning
- Time series CPU utilization graphs
- A free trial or a demo that allows a no-cost assessment period
- A system that offers value for money by combining CPU tracking with other monitoring functions
Taking this list of requirements into consideration, we identified CPU monitoring tools that we are happy to recommend.
1. Auvik (FREE TRIAL)
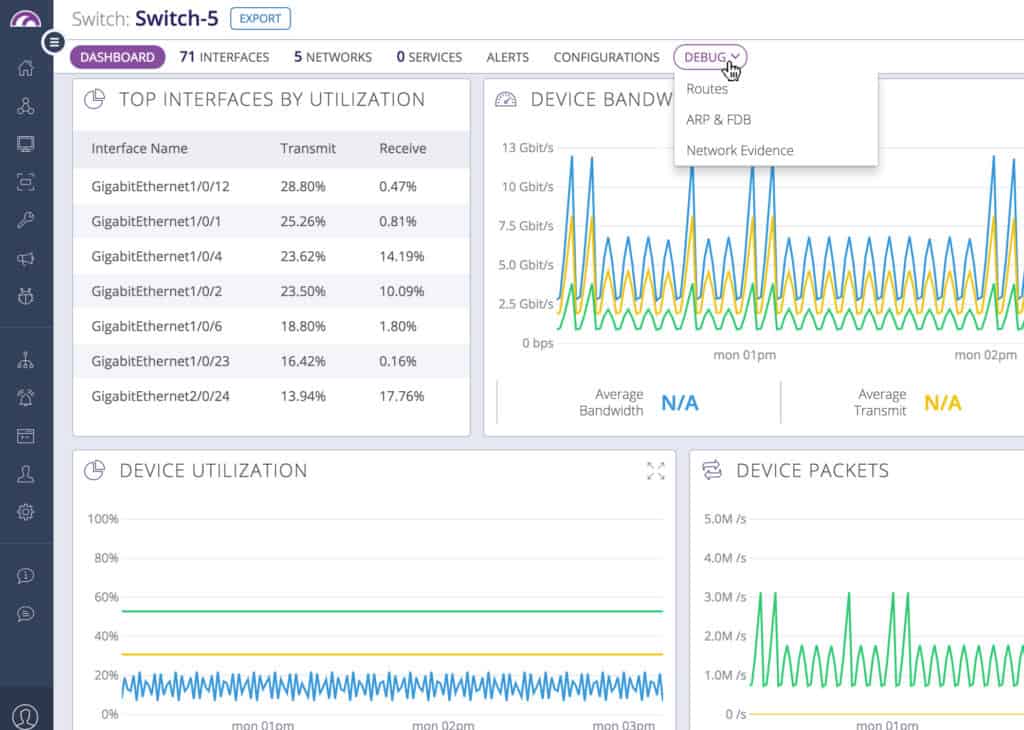
Auvik is a network monitoring product that is used by companies of all sizes to monitor the health of connected infrastructure. Auvik uses an automated inventory feature to find connected devices and add them to the software environment. This allows you to monitor the CPU utilization of your network infrastructure.
Key Features:
- Automated Device Discovery: Automatically identifies and adds connected devices to the monitoring environment.
- IT Asset Inventory: Maintains an up-to-date inventory of IT assets for efficient management.
- CPU Activity Monitor: Monitors CPU utilization on network devices and endpoints.
Why do we recommend it?
Auvik is an asset management system that provides performance monitoring. This monitoring remit extends to the tracking of CPU activity on endpoints and network devices. The service includes alerts for performance issues, such as impending CPU capacity exhaustion. The service includes an automated asset inventory creation service.

When a device’s CPU utilization gets too high, you can configure Auvik to send you an alert. Auvik’s Alerts are customizable so you can choose what thresholds trigger alerts to be sent. By default, Auvik is configured with over 50 alerts. Types of alerts for CPU include Hypervisor CPU module failed and Hypervisor CPU module degraded.
Who is it recommended for?
Auvik is a SaaS package with a data processor and console that is resident in th cloud. You need to install a collector on your local network. The company doesn’t publish a price list, which makes it difficult for cash-strapped small businesses to decide whether to shortlist this system.
Pros:
- User-Friendly Interface: Simple and intuitive interface that becomes easier to navigate over time.
- Accurate Autodiscovery: Utilizes autodiscovery to maintain accurate and live device inventories.
- Customizable CPU Alerts: Easily monitors CPU usage and sets customizable threshold-based alerts for proactive management.
Cons:
- Limited Support for Open-Source Version: The open-source version lacks the quality support found in the paid version.
- Complex Installation: Installation process can be technical and complex, potentially requiring additional expertise.
Auvik offers a scalable pricing plan that changes based on the number of devices you wish to manage. However, you’ll need to contact Auvik directly to request a quote. That being said there is a $500 (£383) fee for onboarding Auvik and training members of staff. You can download Auvik on a 14-day free trial.
EDITOR'S CHOICE
Auvik is our top pick for a CPU monitoring tool because it collects processor data from network device agents under the procedures of the Simple Network Management Protocol. The SNMP system is already installed on all network devices, it is available in Windows and it can be easily installed on Linux, so most of the components for collecting CPU data are present even before you sign up for Auvik. When you access your account in the cloud-based Auvik dashboard, the system guides you through the process of installing an agent on one of your servers, and then the system sets itself up.
Download: Get a 14-day FREE Trial
Official Site: https://www.auvik.com/#trial
OS: Cloud-based
2. Site24x7 Server Monitoring (FREE TRIAL)
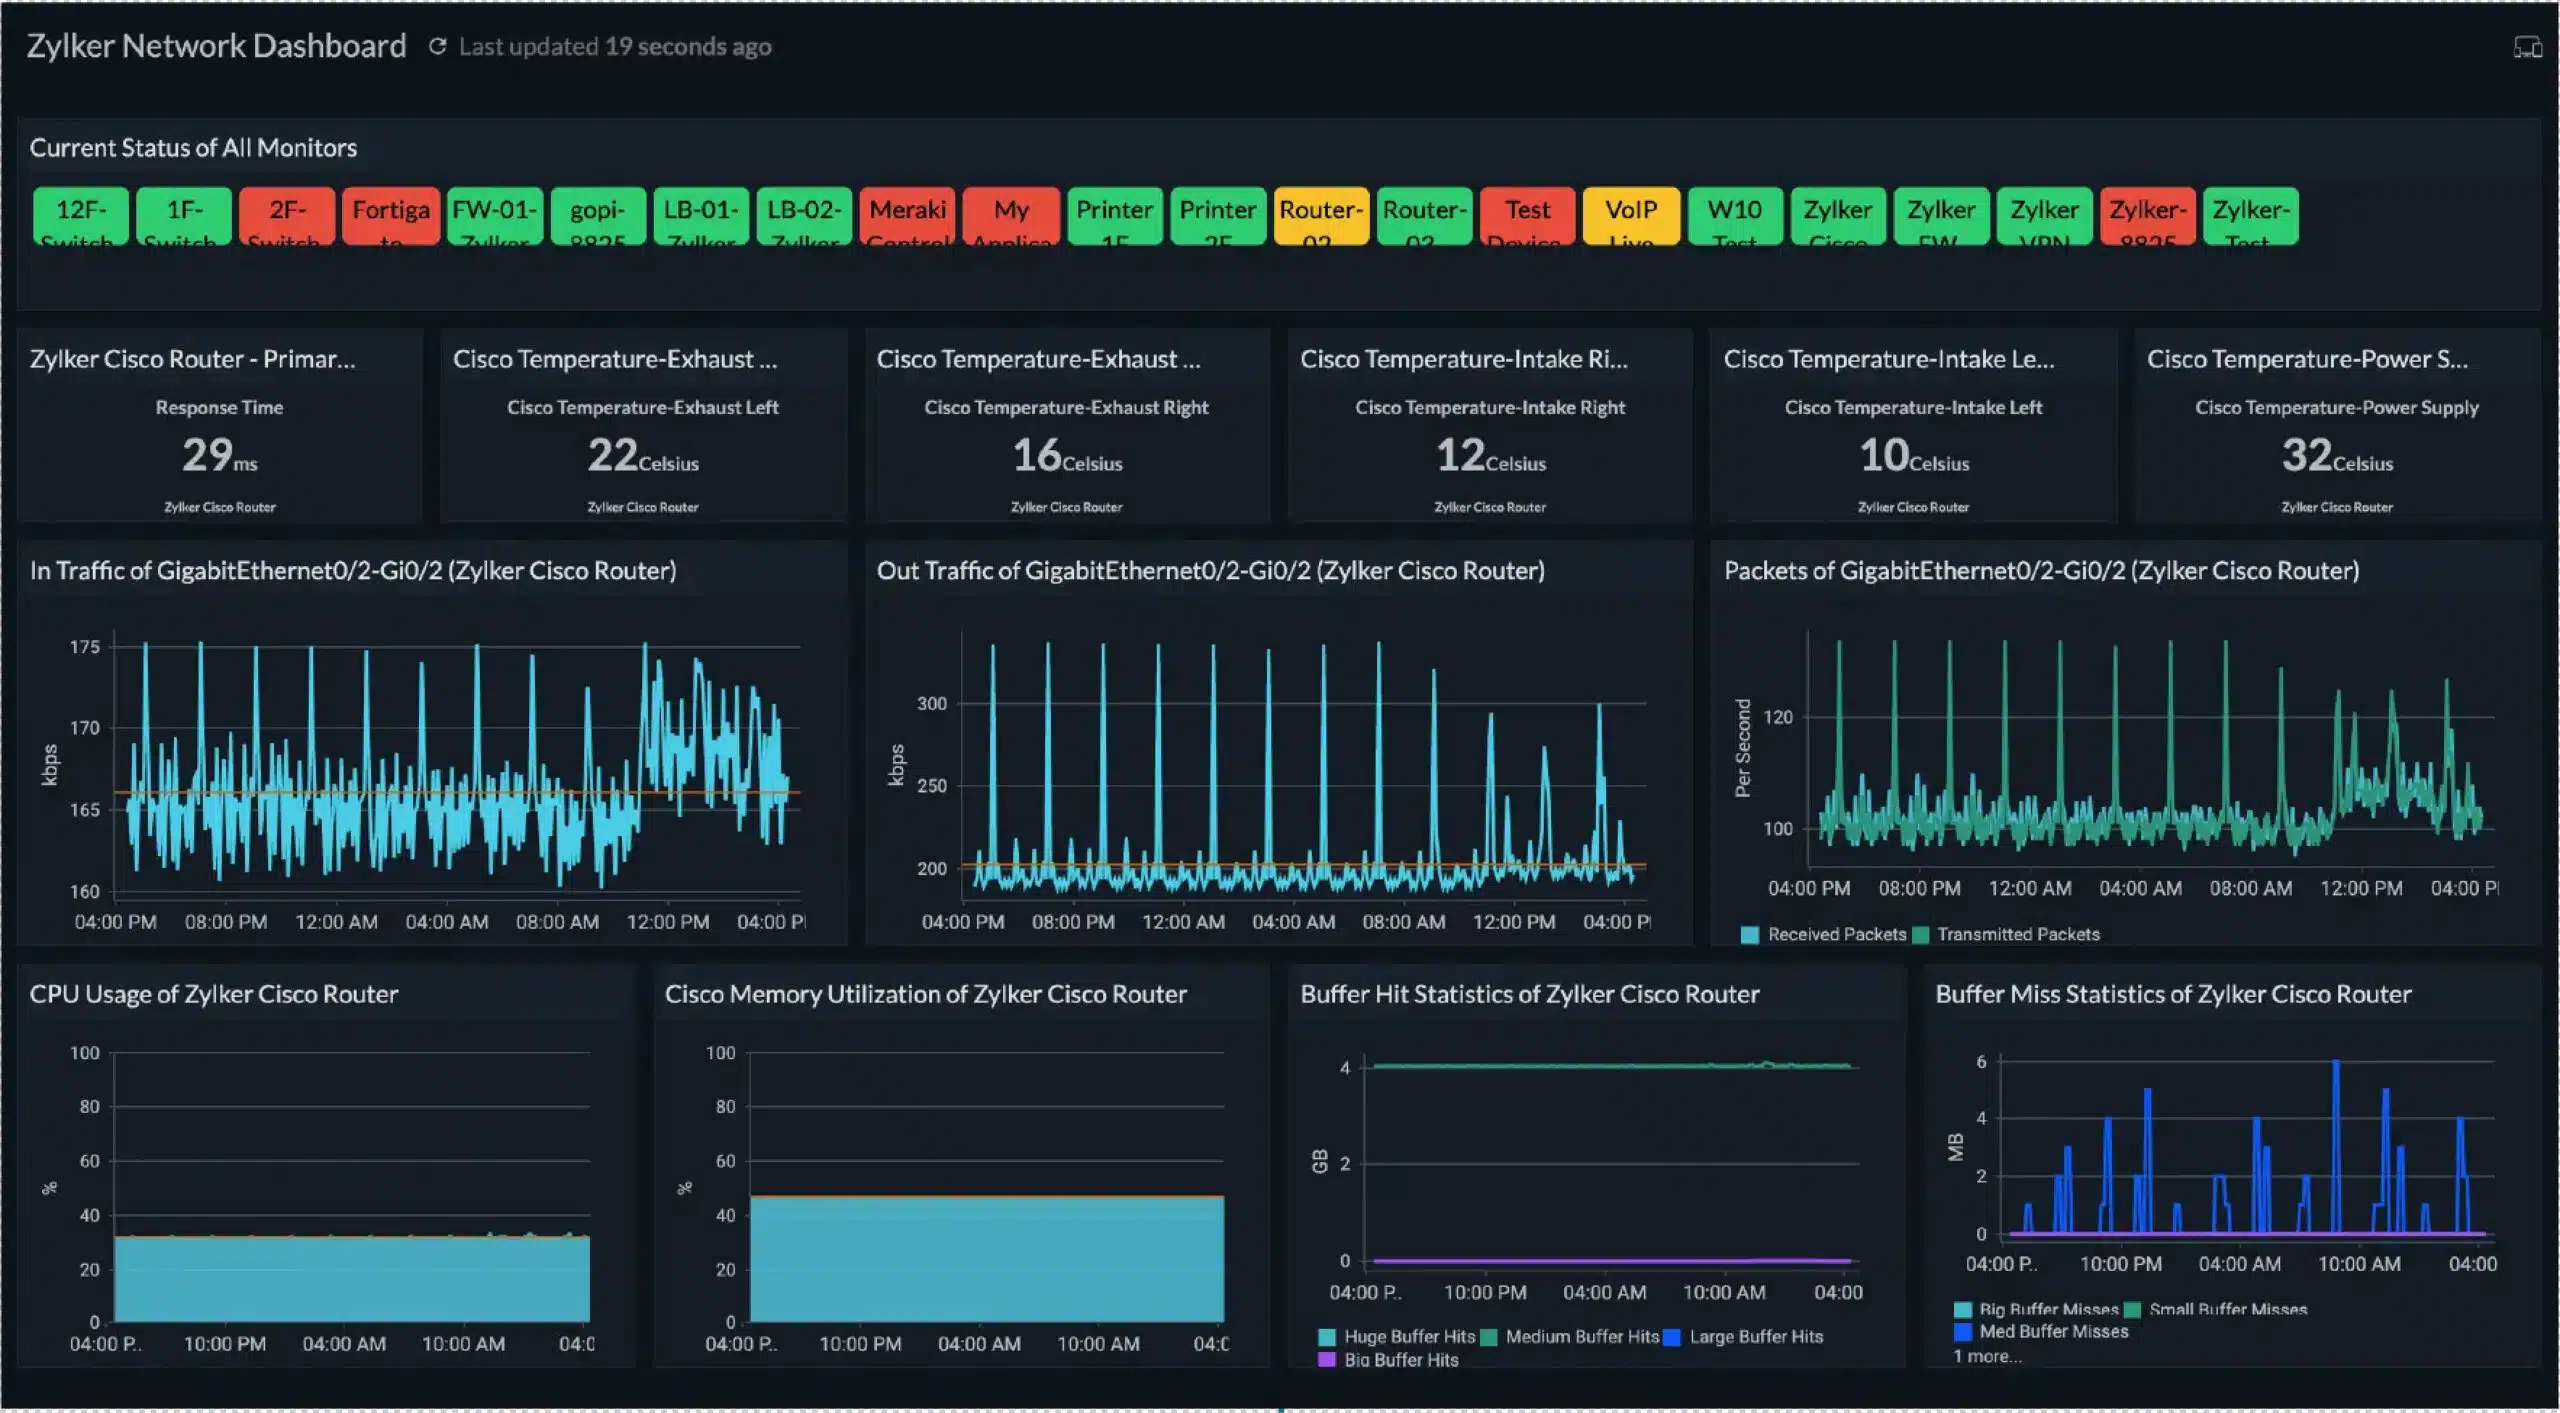
Site24x7 Server Monitoring is a cloud-based system that records the capacity of endpoint resources and then tracks the usage of those components. The monitoring system watches the utilization of CPU, memory, and disks. The unit is partnered by a network device monitoring service that scans a network and discovers and logs any connected equipment, which includes endpoints.
Key Features:
- Automatic Discovery and Documentation: Automatically finds and documents all connected devices.
- System-Wide Performance Overview: Provides a comprehensive view of system performance.
- Detailed Endpoint Activity Tracking: Monitors the usage and performance of individual endpoints.
Why do we recommend it?
The Site24x7 Server Monitoring system is able to monitor CPU capacity and utilization on endpoints and its companion service of network monitoring can track CPU usage on network devices. The full package also gives you application and infrastructure monitoring and can also monitor virtualizations, cloud platforms, and Web applications.
The overview screen of the Server Monitoring tool shows all of your endpoints and their statuses. This screen shows a list of endpoints with summaries. Click on an entry to get a detailed view of a server with its current resource usage metrics, shown in both numbers and charts.

The Site24x7 system includes a series of performance expectation thresholds. You can adjust these thresholds or create your own. They will generate alerts if they are crossed and you can also set up automated actions to execute if an alert condition is met. Alerts are shown in the Site24x7 console and they can be forwarded to a technician by email, SMS, voice mail, or Slack message.
Who is it recommended for?
This package is suitable for use by businesses of all sizes. The Server Monitoring tool is bundled together with other modules in a package, so you get network and application monitoring as well. The plans cover websites, virtualizations, and websites as well and there is a library of integrations that expand the system to cover specific technologies.
Pros:
- Comprehensive Resource Monitoring: Monitors CPU, memory, and disk capacity and utilization for a complete overview of system health.
- Full-Stack Observability: Offers end-to-end visibility across your entire infrastructure, including networks and applications.
- Network Device Monitoring: Includes CPU monitoring for network devices through the network monitoring module.
Cons:
- Cloud-Only Availability: Not available for on-site installation, which may be a limitation for some organizations.
- Complex Plan Options: Multiple plans can be confusing, requiring careful selection to ensure all needed features are included.
Site24x7 offers a number of plans and all of them include the Server Monitoring module. There is also an MSP edition for managed service providers. You can try any Site24x7 plan with a 30-day free trial.
3. Paessler PRTG Network Monitor (FREE TRIAL)
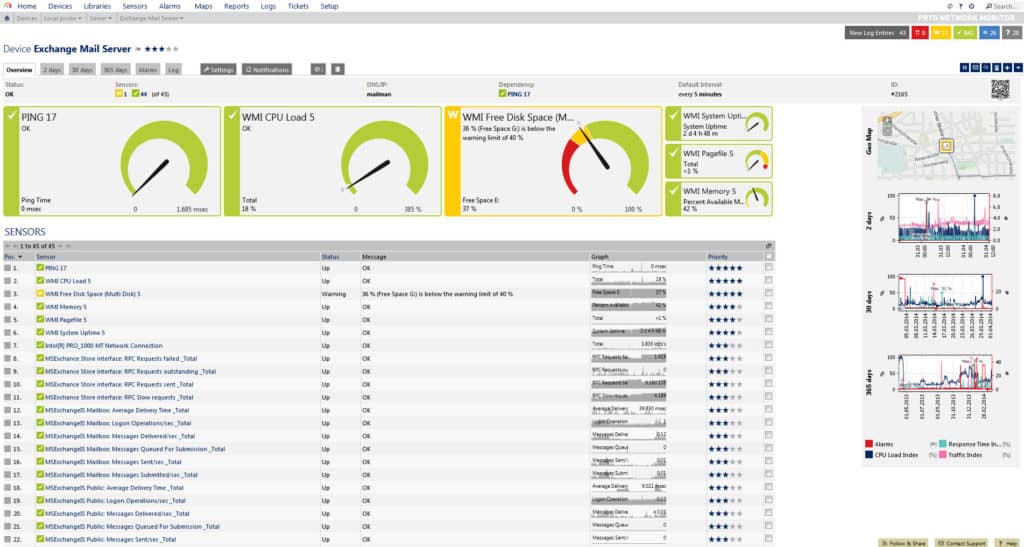
Anyone familiar with Paessler PRTG Network Monitor will know that this tool offers one of the most complete CPU monitoring experiences on the market. With PRTG Network Monitor you can monitor Windows, Mac, and Linux devices for CPU performance issues. You can use this tool to measure key metrics like CPU utilization as a percentage and CPU utilization over time.
Key Features:
- Comprehensive Monitoring: Monitors servers, networks, and applications for complete system oversight.
- Hardware Status Tracking: Tracks the status of network device hardware.
- Cross-Platform Support: Monitors Windows, Mac, and Linux desktops for CPU performance.
- Custom Alerts: Sends alerts via SMS and email when thresholds are exceeded.
Why do we recommend it?
Paessler PRTG Network Monitor uses SNMP to gather device information. It uses this information to create an asset inventory and a network topology map. Ongoing SNMP requests provide data for live system monitoring and that includes CPU activity and capacity reports. You can also examine device memory and storage space availability.

PRTG Network Monitor’s monitoring capabilities are driven by its sensors. There are many different sensors for CPU included within PRTG Network Monitor. These include the SNMP CPU Load Sensor, Windows CPU Load Sensor, Windows Process Sensor, SNMP Linux Load Average Sensor, and the SSH Load Average Sensor. The SNMP CPU load sensor shows the load of multiple CPUs as percentages over a time period of your choice (live, two days, 30 days, and 365 days).
You aren’t limited to tracking everything manually either. PRTG Network Monitor makes use of alerts to notify you by email and SMS once a threshold has been exceeded. So if CPU utilization exceeds the defined thresholds then you’ll be sent an alert to take action.
Who is it recommended for?
PRTG is free if you only activate 100 sensors. A sensor is an individual monitor and there are thousands in the package. The minimum purchase quantity is 500 sensors and you can turn on whichever you like up to that number. The software installs on Windows Server and there is a hosted SaaS version available.
Pros:
- Extensive Monitoring Capabilities: Offers hardware, network, and application monitoring, providing a holistic view of IT infrastructure.
- Highly Configurable Sensors: Allows for the monitoring of custom-built devices and specific metrics.
- Free Version Available: The freeware version supports up to 100 sensors, ideal for small businesses.
- Scalable Pricing: Pricing is based on the number of sensors in use, making it suitable for both small and large networks.
- Efficient Autodiscovery: Quickly maps large networks with many devices, saving time on setup.
Cons:
- Steep Learning Curve: Designed for network professionals, which may require time to learn and fully utilize all features.
The price of PRTG Network Monitor depends on how many sensors you need to use. This starts with a freeware version that provides you with up to 100 sensors free of charge. The paid versions of PRTG Network Monitor start from $1,600 (£1,227) for 500 sensors. You can download a 30-day free trial.
4. ManageEngine OpManager (FREE TRIAL)
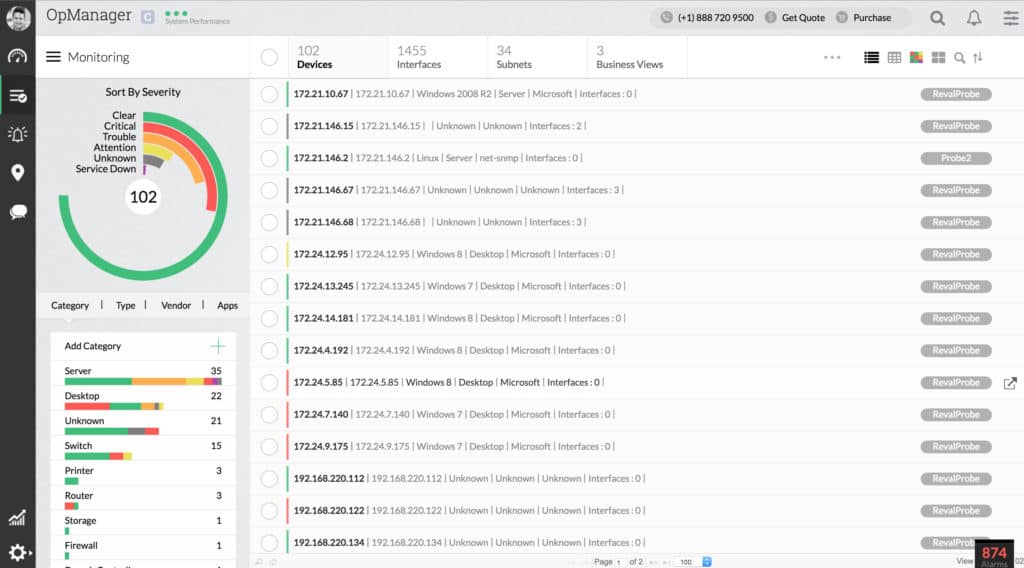
A “best of” CPU monitoring tool list wouldn’t be complete without ManageEngine OpManager. ManageEngine OpManager is a network monitoring platform that lends well to CPU monitoring devices. You can use this program to monitor key metrics like CPU, memory, and disk utilization. If a PC or server has disk utilization that is too high you’ll be able to know about it very quickly.
Key Features:
- Network and Server Monitor: Provides comprehensive monitoring for both network devices and servers.
- SNMP-Based Device Tracking: Utilizes SNMP to collect data from all on-site equipment.
- CPU Statistics: Monitors detailed CPU metrics including utilization, clock speed, and idle time.
Why do we recommend it?
ManageEngine OpManager monitors network devices and endpoints. The system uses SNMP to collect data from all equipment on site. CPU activity, capacity, and utilization are included in the standard SNMP reporting format, which is called a Management Information Base (MIB). The tool issues alerts if it detects CPU problems or capacity exhaustion.

There is a range of CPU metrics that can be accessed with ManageEngine OpManager. These include CPU utilization, CPU socket, CPU clock speed, idle time, PSU redundancy, user time, processor queue, and privileged time. This provides you with an in-depth CPU monitoring experience that goes beyond the basic CPU monitoring experience offered by most other competitors.
To make sure that you stay up-to-speed with all CPU performance concerns there is a notifications feature. You can configure thresholds for metrics CPU utilization so that you’re notified once a metric exceeds the configured parameter. If you want to cut back on unnecessary notifications then you can specify the number of times the metric must be violated before an alert is triggered.
Who is it recommended for?
ManageEngine produces a Free edition of OpManager but it is limited to availability monitoring for three devices. However, the lowest edition of the tool is sized and priced to be accessible for small businesses with a 10-device monitoring capacity. Larger businesses pay for extra capacity and there is also a multi-site version.
Pros:
- Freeware Version Available: Offers a free version for testing and small network use, supporting up to three devices.
- Comprehensive Monitoring: Utilizes both SNMP and NetFlow for extensive coverage options.
- Scalable Solution: Easily scales to support up to 10,000 endpoints with the Enterprise package.
- Automatic Network Discovery: Creates live inventories and network maps for efficient asset tracking.
- Flexible for Various Network Sizes: Suitable for both small and large networks with both freeware and paid versions.
Cons:
- Steep Learning Curve: Dense with features, integrations, and settings, which may require time to fully learn and utilize effectively.
ManageEngine OpManager can be purchased as the Essential version or the Enterprise version on Windows and Linux. The Essential version costs $715 (£548) and can be used on up to 25 devices. The Enterprise version is available for $19,975 (£15,317) and can be used on up to 500 devices. There is also a 30-day free trial.
5. TeamViewer Remote Management

TeamViewer Remote Management is a package of remote monitoring and management systems for IT assets. This package monitors CPU utilization to assess the health of individual devices within your network. You can also monitor other elements like memory, drive, load, and disk I/O for further details.
Key Features:
- Automatic Inventory Creation: Automatically discovers and inventories all devices on the network.
- Server Resource Monitoring: Monitors key server resources such as CPU, memory, drive load, and disk I/O.
- Customizable Alert Thresholds: Allows users to set specific thresholds for alerts.
Why do we recommend it?
TeamViewer Remote Management is a suitable package for watching over IT assets on remote sites. The system discovers all devices on a site and registers them in an inventory. That information store includes the attributes of each device, such as CPU type and capacity. The system then provides continuous monitoring of those components.
The TeamViewer console is based in the cloud. The process of onboarding requires an agent to be installed on at least one host on the remote network. This tool then discovers all devices on the new system and generates an asset inventory. The system can monitor the CPU on each network device and endpoint from that point.

As this is a management tool as well as a monitoring system, the TeamViewer package is able to deploy and patch software on Windows, macOS, and Linux – it patches operating systems as well. In order for this management capability to be implemented, you need to let the cloud-based system install an agent on each endpoint on the remote network.
Who is it recommended for?
This package is useful for IT support departments and it will particularly appeal to groups that already use the core TeamViewer remote access tool. The system is priced per monitored endpoint, which means that it is very affordable for businesses of all sizes. TeamViewer Remote Management is particularly suitable for mid-sized enterprises.
Pros:
- Versatile Device Monitoring: Can monitor a wide variety of devices with a focus on server monitoring.
- Cross-Platform Agents: Supports agents for Linux, Windows, and macOS, making it suitable for diverse networks.
- Comprehensive Network Monitoring: Measures bandwidth and network activity on a per-device basis.
- Detailed Reporting: Offers robust reporting features for in-depth analysis and insights.
Cons:
- Complex Interface: May be more complicated than other tools, requiring sysadmin expertise to fully utilize.
- Short Trial Period: Could benefit from a longer trial period for thorough evaluation.
TeamViewer levies its subscription rate per endpoint. The tool can be used by managed service providers, which can make setting up a new account a little tricky – many MSP clients don’t know how many endpoints that have and the work of the MSP includes auditing and documenting the system. However, this is a flexible package and you can add on endpoint licenses as you go. Larger numbers of endpoint licenses get a progressively bigger discount on the standard rate. You can examine the TeamViewer Remote Management system with a 14-day free trial.
6. Atera

Atera is a software package that supports managed service providers (MSPs). The platform is a cloud service so the MSP doesn’t have to install the monitoring software on its site. However, the remote systems that are being monitored do need to have agent software installed on them.
Key Features:
- IT Asset Management: Comprehensive management of IT assets for MSPs.
- Remote Monitoring: Monitors remote systems and networks via agent software.
- Network and Server Monitoring: Tracks the health and performance of networks and servers.
- Alerts: Customizable alerts for various performance metrics.
- Automated Maintenance: Includes automated processes for routine maintenance tasks.
Why do we recommend it?
Atera is a remote monitoring and management (RMM) package. It includes endpoint and network device monitoring. In all cases, the Atera monitoring console receives live CPU activity data and will raise an alert if the CPU of a device is behaving strangely or is at full capacity.
The Atera system is an RMM. That stands for “remote monitoring and management.” The monitoring part of that suite of tools includes the supervision of activities and statuses for networks, servers, and applications. The server monitoring functions of Atera include comprehensive CPU monitoring. The service can watch the utilization of CPU and also keeps a record of the maximum CPU processing power that a server has.
The management functions of Atera include the ability to kill off abandoned processes that are chewing up CPU time. Other server maintenance utilities in Atera include the ability to clean disks, removing temporary files. It is also able to defrag disks. The service can create system restore points, back up servers, and restore saved files.
As Software-as-a-Service, Atera includes all of the software, processing, and storage facilities needed to run the platform. The service is charged for by subscription per technician per month. It is also possible to opt for a yearly subscription, which offers a lower rate.

Who is it recommended for?
Atera is produced in a version for IT departments and another for managed service providers. Each version has four plans and the features of each plan are adapted to the type of business that it is for. All plans include CPU monitoring. All plans are priced per technician.
Pros:
- Cloud-Based Monitoring: Reduces costs and simplifies onboarding with a cloud-based platform.
- Accessible Dashboard: Browser-based dashboard is accessible from anywhere, providing flexibility.
- Comprehensive RMM/PSA Features: Ideal for MSPs, offering additional features like Professional Services Automation (PSA) and Remote Monitoring and Management (RMM).
- Client-Specific Reports: Allows grouping of devices and filtering of monitoring reports by client.
Cons:
- Complex Implementation: The suite of RMM/PSA tools may require time to fully explore and implement.
The Atera platform is marketed as three editions: Pro, Growth, and Power. You can get a free trial of any of these versions to test it out. Pricing starts at $129 per technician.
See also: Step-By-Step CPU Benchmark Test
7. SolarWinds Engineer’s Toolset
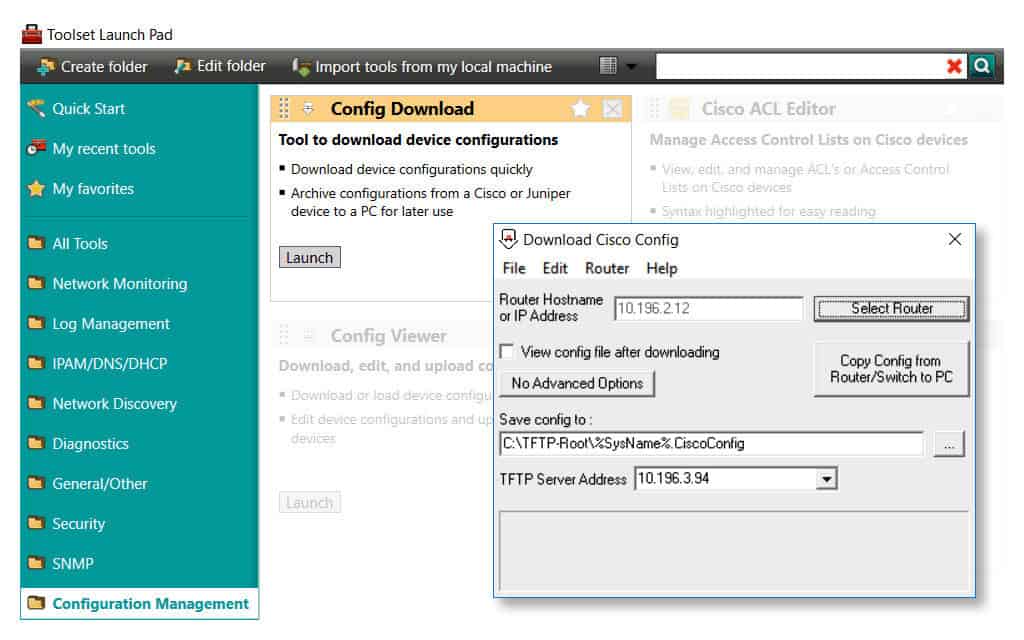 First up on this list we have SolarWinds Engineer’s Toolset which has its own CPU monitor and can monitor the maximum CPU load of connected devices. CPU load is displayed as graphs so that you can see if the CPU is declining over time. Graphs are particularly useful for seeing if there are viruses or any other issues that could be causing problems for a device.
Key Features:
- Extensive Tool Collection: Includes more than 60 system monitoring tools for comprehensive network management.
- Endpoint and Device Monitoring: Tracks performance of both endpoints and network devices.
- CPU Load Graphs: Displays CPU load as graphs to visualize performance trends and potential issues.
Why do we recommend it?
SolarWinds Engineer’s Toolset is a package of more than 60 tools and one of those is a CPU monitor. This utility is particularly useful for tracking CPU load. This is important because if your CPU is presented with too many requests, later software launches will hang while waiting and then time out.
To stop you from having to monitor everything yourself, SolarWinds Engineer’s Toolset has its own alarms feature. Alarms raise alerts whenever the defined thresholds have been reached. You can set metric thresholds for CPU load, so that once the load goes over this figure an alert is sent to you by email or SMS. This keeps you in touch with everything going on and makes sure that you don’t miss out on anything.
SolarWinds Engineer’s Toolset has its own autodiscovery feature which automatically discovers devices connected to your network. Once a device has been discovered you’re able to monitor its performance through metrics like CPU load and memory utilization. Using autodiscovery minimizes the amount of configuration time you need to spend configuring and updating the software.

Who is it recommended for?
This package is useful for system administrators and network managers. The package includes both monitoring tools and troubleshooting utilities. The CPU monitor can be set up to provide you with an alert if demand on the CPU goes above a specific percentage. Historical data will show whether the CPU is overloaded.
Pros:
- Versatile Monitoring Tools: Offers both passive and manual tools for thorough CPU testing and monitoring.
- Comprehensive Suite: Provides over 60 tools tailored for network administrators and on-site technicians.
- Efficient Device Discovery: Autodiscovery feature quickly finds and monitors connected devices, reducing setup time.
Cons:
- Specialized for Sysadmins: Designed specifically for system administrators, making it less suitable for home users.
No matter what size your organization is, SolarWinds Engineer’s Toolset is a tool that provides one of the best CPU monitor products on the market. SolarWinds Engineer’s Toolset is available on Windows from a price of $1,495 (£1,146). You can also download a 14-day free trial.
8. SysGauge
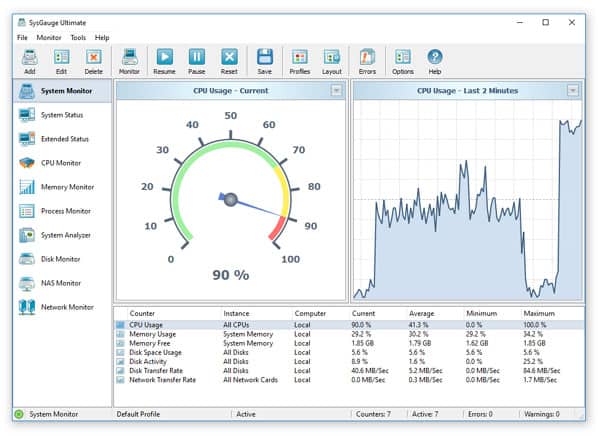
SysGauge is a program that offers a narrower approach to CPU monitoring. With this product, you can monitor the CPU and memory usage of connected devices. In fact, SysGauge has its own GUI module called the CPU monitor. The CPU monitor can monitor CPU usage, CPU interrupt time, CPU interrupt rate, and CPU frequency. This is a considerable degree of depth for a smaller monitoring product.
Key Features:
- In-Depth CPU Monitor: Offers detailed monitoring of CPU usage, interrupt time, interrupt rate, and frequency.
- Email Alerts: Provides customizable alerts via email when thresholds are crossed.
- Free Version: Available in a free version with basic monitoring capabilities.
Why do we recommend it?
SysGauge monitors computers that run Windows or Windows Server. The system is available in four editions and only the top plan, Server, provides networked monitoring. All of the other versions will only monitor the device on which the software is installed. CPU monitoring is among the tool’s activities.
In addition, SysGauge has also added an alerts system of its own. Users can set their own alert parameters and receive email notifications once a threshold has been crossed. If desired, the user can also execute custom commands to respond to events as they occur. This makes SysGauge suitable for responding to CPU performance issues within a live network environment.
There are four editions of SysGauge available: Free, Pro, Ultimate, and Server. The Free version of SysGauge offers up to 10 counters, monitors and profiles free of charge. The Pro version offers 50 counters, monitors and profiles for $50 (£38). The Ultimate version offers 100 counters, monitors and profiles for $125 (£95). The Server edition can be networked and it provides monitoring for 200 endpoints at a base price of $125 (£95). The free version of this product is an excellent choice for SMB’s.
Who is it recommended for?
This service is suitable for small businesses. There is a Free edition, which can be used on three devices. The other plans allow more endpoints to be monitored per site. All paid plans can be set up to email a notification to an administrator and the server plan will operate across a network.
Pros:
- Comprehensive Monitoring: Covers both system and hardware monitoring for a thorough analysis.
- User-Friendly Interface: Features a simple and easy-to-navigate interface.
- Visual Graphs: Built-in graphs provide basic but insightful visual representations of data.
Cons:
- Windows-Only: Available exclusively for Windows and Windows Server, limiting its use in mixed OS environments.
- Complex Notification Setup: Notification features could be easier to set up and implement, requiring some configuration expertise.
SysGauge is available for Windows and Windows Server.
9. AppDynamics
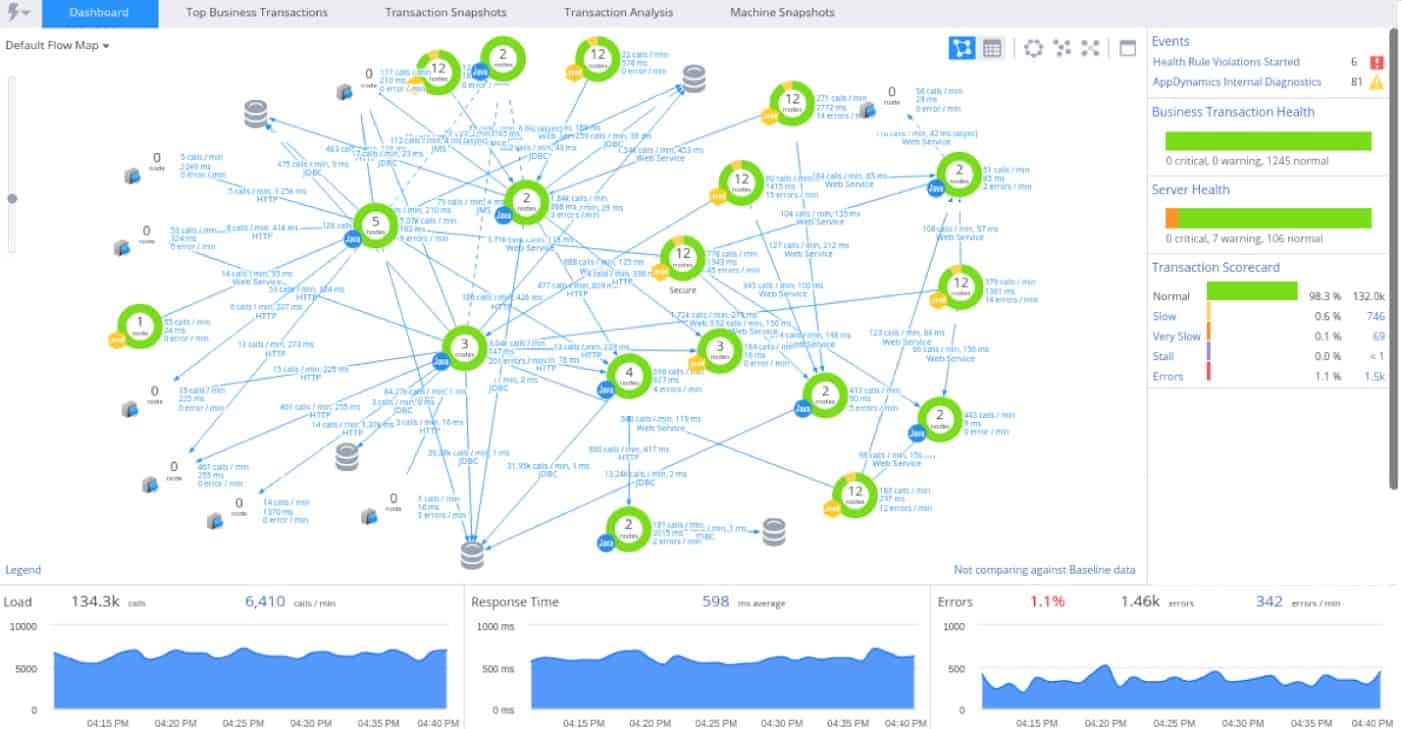
Anyone familiar with application performance monitoring is almost certain to know about AppDynamics. AppDynamics is also a formidable CPU monitoring tool in its own right. Right off the bat, AppDynamics separates itself from the crowd on account of its autodiscovery feature. AppDynamics can autodiscover devices and applications in your network automatically.
Key Features:
- Automated Device Discovery: Automatically discovers devices and applications within your network.
- AI-Based Performance Thresholds: Utilizes AI to set and monitor performance thresholds, reducing false alerts.
- Constant CPU Monitoring: Provides continuous monitoring of CPU utilization across all discovered devices.
Why do we recommend it?
The AppDynamics SaaS platform maps and monitors applications and their interdependencies. The tool is quite pricey but there is a lower plan that only covers Infrastructure. The Infrastructure plan includes CPU monitoring for servers. This provides alerts when CPUs cease to operate correctly or reach their capacity limits.
Once configured, you can use AppDynamics to monitor the CPU utilization of all discovered devices at the infrastructure level. At the application level, you can also view metrics on process-specific CPUs. This gives you the depth needed to view the CPU performance metrics of all devices in your network.
All of your usage is kept tabs on through the use of alert thresholds. AppDynamics’ alerts system makes use of artificial intelligence. Artificial intelligence is used to determine when CPU usage is consistent with anomalous behavior. Putting your threshold-based alerts in the hands of the AI system is beneficial because it cuts down on unnecessary alert notifications that you are often subjected to when a device’s CPU peaks unexpectedly.

Who is it recommended for?
The AppDynamics system looks at data flows between applications and that requires constant monitoring of the servers that support those applications. The Infrastructure plan doesn’t have that application tracking service but it does watch server activity. In fact, all of the plans of AppDynamics cover server resource monitoring, including CPU performance tracking.
Pros:
- Enterprise-Grade Monitoring: Tailored for large-scale enterprise use with comprehensive monitoring capabilities.
- Dependency Mapping: Excellent dependency mapping and visualizations for troubleshooting complex application systems.
- Free Version Available: Offers a free version for users to get started with basic monitoring.
Cons:
- High Cost: Priced higher than many similar tools on the market, making it less accessible for smaller businesses.
- Steep Learning Curve: Can be complex to learn and may benefit from additional tutorials and resources.
- Complex Deployment: Deployment and onboarding can be intricate, requiring expertise.
- Mobile App Needs Updates: The mobile app could benefit from enhancements to improve usability.
There are three versions of AppDynamics that you can purchase; APM Pro, APM Advanced and APM Peak. Each of these offers CPU monitoring, but you’ll have to contact the sales team in order to view the prices. You can evaluate AppDynamics as a free trial download.
10. Nagios XI
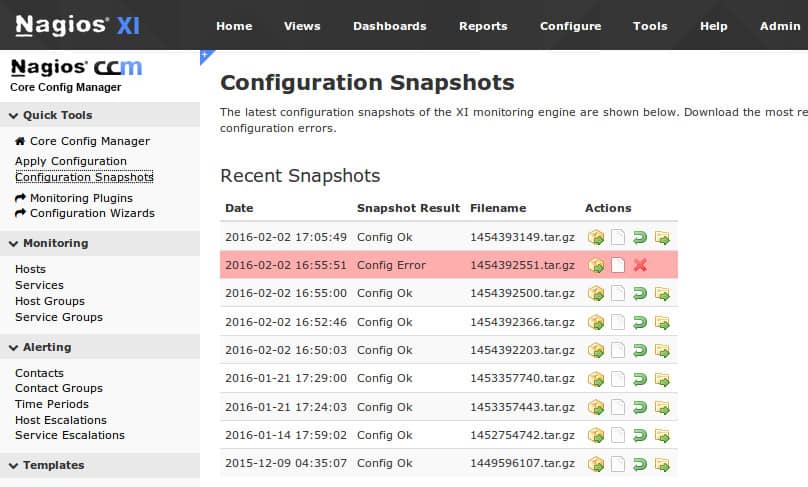
Nagios XI is another solid choice if you’re looking for a network monitor with CPU monitoring capabilities. Nagios XI is available on Linux and Microsoft (via VMware Workstation Player or Hyper-V). The GUI is completely customizable so you can build your monitoring experience according to your needs.
Key Features:
- Extensible with Plug-In Library: Offers a free library of plugins for customized monitoring.
- SNMP-Based CPU Reports: Provides detailed CPU activity reports using SNMP.
- Endpoint Monitoring: Monitors endpoints alongside servers, networks, and other infrastructure.
Why do we recommend it?
Nagios XI is a system monitoring package that covers much more than servers and networks because it also monitors cloud platforms, middleware, and applications. The monitoring services for network devices and servers include CPU activity tracking with alerts for performance problems and capacity exhaustion.
Nagios XI has over 30 different plugins related to monitoring CPU. Plugins include Check SNMP CPU Load, CPU Usage for Solaris, Linux and Windows, and Check CPU Load. All of these plugins offer their own CPU monitoring elements which can be added to expand your monitoring environment.
To keep up with CPU usage developments, Nagios XI has a notifications feature. You can configure email and text notifications to alert you when your CPU usage is reaching problematic levels. Alert preferences can be managed on separate user accounts so that only the relevant users receive update information on CPU monitoring.

Who is it recommended for?
Nagios XI has a general appeal because it covers all technologies. The out-of-the-box package sets itself up by searching your network and compiling an asset inventory, it then continuously monitors those devices. The system can be extended by free plug-ins. This software package runs on Linux, Hyper-V, and VMware.
Pros:
- Open-Source Transparency: Open-source tool that offers transparency and flexibility.
- Informative Interface: Simple yet informative interface that can be customized to user needs.
- Flexible Alerting Options: Supports SMS and email alerts to keep users informed about CPU usage issues.
- Cross-Platform Availability: Available on both Windows and Linux operating systems.
Cons:
- Limited Support for Open-Source Version: The open-source version lacks the quality support available in the paid version.
- Complex Installation: Installation can be technical and complex, potentially requiring additional expertise.
As a CPU monitoring tool, Nagios XI offers a passable CPU monitoring experience. Nagios XI is available from a price of $1,995 (£1,529) for the Standard Edition. This includes alerting, reporting, and configuration wizards. The Enterprise Edition costs $3,495 (£2,679) for SLA reports and scheduled reports. You can download Nagios XI on a free trial.
11. ConnectWise Automate

Finally, we have ConnectWise Automate. With ConnectWise Automate you can view the CPU usage for each process on a computer. You can gain complete visibility over a device’s CPU metrics via the Processes pane. Active programs are then classified based on their activity. Programs running without poor performance are denoted as a Good Program. Those with undesirable software are denoted as Grayware and those that are using processes matching malicious programs are considered to be a Virus or Spyware.
Key Features:
- Remote Monitoring: Provides remote monitoring capabilities for efficient IT management.
- Tailored for MSPs: Designed to meet the needs of Managed Service Providers.
- CPU Activity Monitoring: Monitors CPU usage and categorizes processes based on activity and potential threats.
Why do we recommend it?
ConnectWise Automate is a remote monitoring and management package that is delivered from the cloud. The key feature of this system is its automation capabilities and asset discovery is part of that. The system provides continuous monitoring, which includes the tracking of CPU activity on endpoints and network devices.
The installation process of ConnectWise Automate is three-pronged. First, you need to install the ConnectWise Automate server on a Windows Server that runs IIS and Oracle MySQL database server. Second, you need to install the ConnectWise Automate Control Center on your workstations. The final thing you need to do is install the software tool on Windows, Linux, or Mac.
Who is it recommended for?
ConnectWise Automate is aimed at IT support teams but it can also be used by managed service providers (MSPs). The automated monitoring services in the package save time because they will raise alerts if problems are discovered. For example, you get a notification if a device’s CPU is running close to full capacity.
Pros:
- Comprehensive Dashboard: Remote management, inventory management, and reporting are all accessible from a single dashboard.
- Template-Based Interface: Interface templates can be applied to individuals or entire teams for consistency and efficiency.
- Automated Troubleshooting: Supports automation and remote troubleshooting without disrupting the user session.
- Pre-Configured Commands: Includes over 100 pre-configured commands and templates for immediate use.
Cons:
- Short Trial Period: The trial period may be too short to fully explore all features.
- Complex Interface: The interface can be confusing, particularly in reporting and management areas.
- Clunky User Chat: The user chat function can be awkward and inefficient.
- Cumbersome Onboarding: The onboarding process can be lengthy and complicated.
ConnectWise Automate operates a customizable pricing structure. As a result, you need to contact the company directly in order to receive a quote. However, if you’d like to take ConnectWise Automate for a test run you can do so by downloading the free trial.
Choosing a CPU Monitoring Software Product
While all of the tools above provide a good CPU monitoring experience, Auvik provides the simplest package on the market. It can also be worth checking out SolarWinds Engineer’s Toolkit as it can autodiscover devices so that you can view how CPU usage varies over time. Monitoring your usage over time via the graphs improves your ability to detect performance degradation.
CPU Monitoring FAQs
Can CPU bottleneck cause damage to your network?
A CPU bottleneck is another way of saying that a CPU is overloaded and unable to process all of the requests that want its attention. A CPU bottleneck won’t cause physical damage to your network. However, if the CPU in question is in a switch, the excess demand on the processor will initially cause packets to be queued for processing and once the queue is full, no further packets can be dealt with and so will just be dropped. This situation causes a high degree of packet loss on the network. If the overloaded CPU is on a server, it can actually help the network because the limited capabilities of the processor slow down the amount of data that can be passed to the network. In this instance, increasing CPU capacity on a server could end up overloading a switch and just move the bottleneck to some other part of the system.
How much CPU usage is normal?
CPUs can run at 100 percent capacity without damage. However, this situation means that the CPU might not be able to process all of the demand required of it. If your CPU is always at 100 percent capacity, it is probable that much of the time, there is software that is forced into a wait state – hanging – because it can’t get any processor time. Aim for a CPU usage rate of about 70 to 75 percent during normal operations. This makes good use of your processors, delivering value for money but also allows spare capacity for surges in processing demand. Don’t worry if CPU utilization pops above 95 percent periodically.
Is monitoring CPU fan speed important?
Fan speed monitoring is important and it should be performed in conjunction with temperature monitoring both within the server and in the server room. Key statuses to look out for are if the fan speed is zero over a long time because that would mean that your fan is broken. If CPU temperature rises while your fan is running at full speed then you have a problem that needs to be addressed immediately. Look at server room temperature at the same time because a high temperature in the surrounding environment means that the fan is just blowing hot air over the CPU.
