
Few names are as synonymous with network monitoring as SolarWinds and ManageEngine. These two products have helped to revolutionize how administrators manage enterprise-level networks. There are few tools that deliver the blend of versatility and simplicity that has made these products household names. The growth of network monitoring tools has been sharp over the past decade or so.
Today, network monitoring has developed to an intricate blend of network, infrastructure, application and server monitoring. There are 101 ways to view how your network is monitoring. Whereas some tools will only show you some of these perspectives SolarWinds and ManageEngine have built names for themselves on account of their slick visual approaches to network monitoring.
In this article, we’re going to compare how well SolarWinds Network Performance Monitor and ManageEngine OpManager deliver the network monitoring experience. We’re going to pay particular attention to key features such as dashboards, alerts, reports and visualization that will determine how easy it is for administrators to use these programs to monitor their networks.
We compare the following:
- Feature comparison
- Ease of setup
- How autodiscovery compares
- Network Performance Monitor Vs OpManager
- Network monitoring
- Visualization
- Alerts & Events
- VoIP Monitoring
- Pricing
- OS compatibility
Feature comparison
| Feature | SolarWinds Network Performance Monitor | ManageEngine OpManager |
|---|---|---|
| Autodiscovery | Yes (with SNMP) | Yes (with SNMP, ICMP, WMI and Telnet) |
| Alerts | Email or SMS | Email or SMS |
| VoIP Monitoring | Needs SolarWinds VoIP Network Quality Manager | Yes |
| Pricing | See pricing table below | See pricing table below |
SolarWinds & ManageEngine Setup

How straightforward the setup process is, defines how easy it is to deploy a network monitoring product. Currently, both SolarWinds Network Performance Monitor and ManageEngine OpManager offer a setup process that is straightforward. With SolarWinds Network Performance Monitor once you’ve downloaded the program you will be guided through the installation process by a configuration wizard.
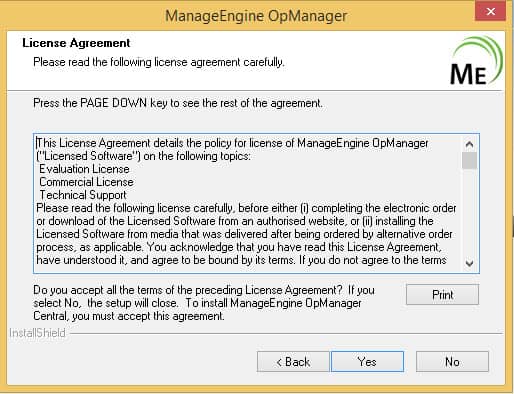
Similarly, once you’ve downloaded ManageEngine OpManager you start up an installation wizard. You are prompted to accept the license agreement and version of OpManager that you wish to install. After a couple of smaller steps, then you are prompted to select your server mode and database. This is pretty much all you need before you start using the program.
While the approach of ManageEngine OpManager is a little more meandering than SolarWinds Network Performance Monitor, it is still relatively lean. All-in-all both of these products are easy to set up and are suitable for new users as well as experienced administrators. However, based on the convenience of the setup process SolarWinds Network Performance Monitor is easier to deploy.
Autodiscovery
There are few greater barriers to deployment than that of configuring your network devices. Once you connect a network monitoring tool you typically have to connect all the devices on your network to the platform before you can start monitoring. This is time-consuming and requires an administrator to stay stuck to the computer while configuring new devices.
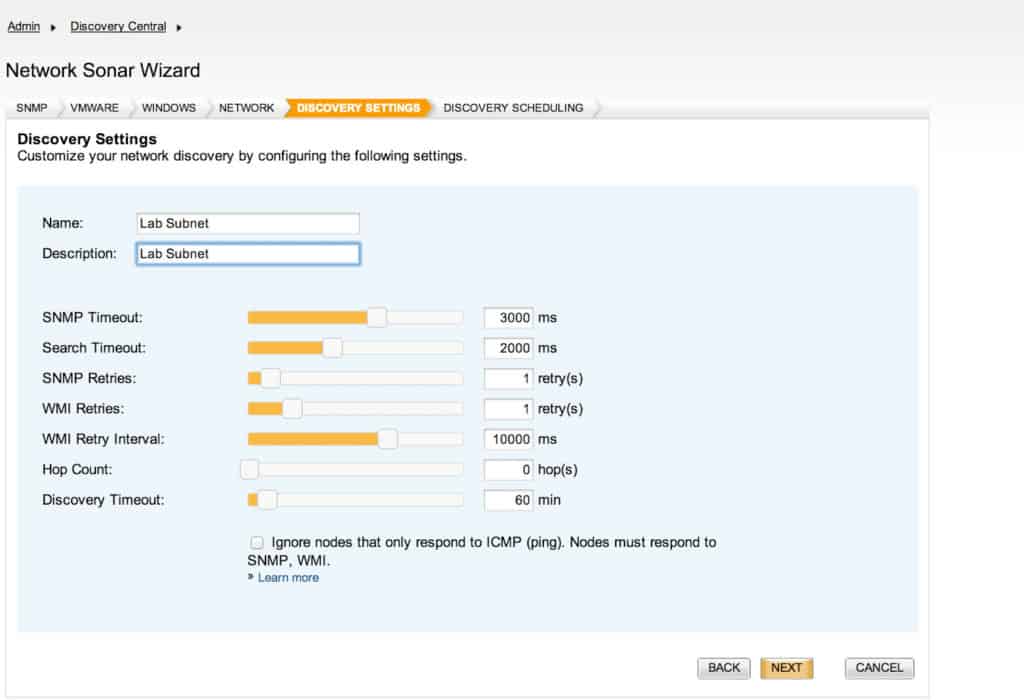
Fortunately, SolarWinds Network Performance Monitor allows the user to sidestep this tedious process through the use of its autodiscovery feature. With autodiscovery, SolarWinds Network Performance Monitor automatically recognizes devices connected throughout your network and configures them. It does this by SNMP polling each device and logging the received information. The result is a configuration process that is almost entirely automated.
ManageEngine OpManager also has its own powerful autodiscovery feature that has the ability to discover more than 5,000 interfaces every minute.
ManageEngine OpManager uses SNMP, ICMP, WMI, and Telnet to discover a wide range of devices. The autodiscovery process is lead by a Discovery Wizard which allows the user to dictate which devices they wish to be discovered.
Though it is a close comparison, based on the simplicity of the autodiscovery process, SolarWinds Network Performance Monitor offers the more lightweight experience here. Autodiscovery starts automatically once the setup process is finished. However, it has to be said that ManageEngine OpManager does offer an excellent autodiscovery process in its own right.
Network Monitoring: SolarWinds Network Performance Monitor vs ManageEngine OpManager
In this section, we’re going to compare how SolarWinds Network Performance Monitor and ManageEngine OpManager approach the practice of network monitoring. The latter allows the user to monitor devices based on their metrics detailing performance, availability, CPU, memory, and traffic. Each of these metrics tells you a crucial piece of information about your infrastructure’s health.
For example, CPU usage tells you whether a piece of hardware is performing at its best or is close to a costly failure. Having a high level of CPU usage indicates that a device is experiencing performance issues. By having the ability to identify this early on, an administrator can step in to take action to get the equipment back to working order before it goes down completely.
SolarWinds Network Performance Monitor also tracks these metrics alongside factors like temperature, fan speed, and power supply. The general health of devices is characterized as Critical, Warning, Up, and Undefined. These are all color-coded so that you can see by a glimpse if a device is experiencing problems.
Visualization
How well a network monitor delivers virtualization determines how effectively you can monitor your real-time network. If virtualization is poor and displays are cluttered, confusing, or limited then you’re not going to be able to recognize the emerging trends. Fortunately, SolarWinds Network Performance Monitor and ManageEngine OpManager are two products that don’t slack in this area.
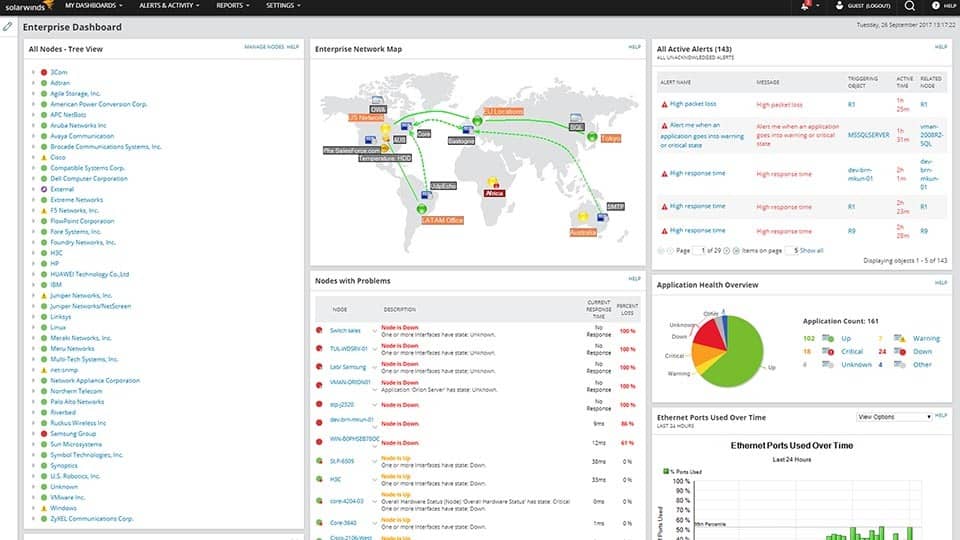
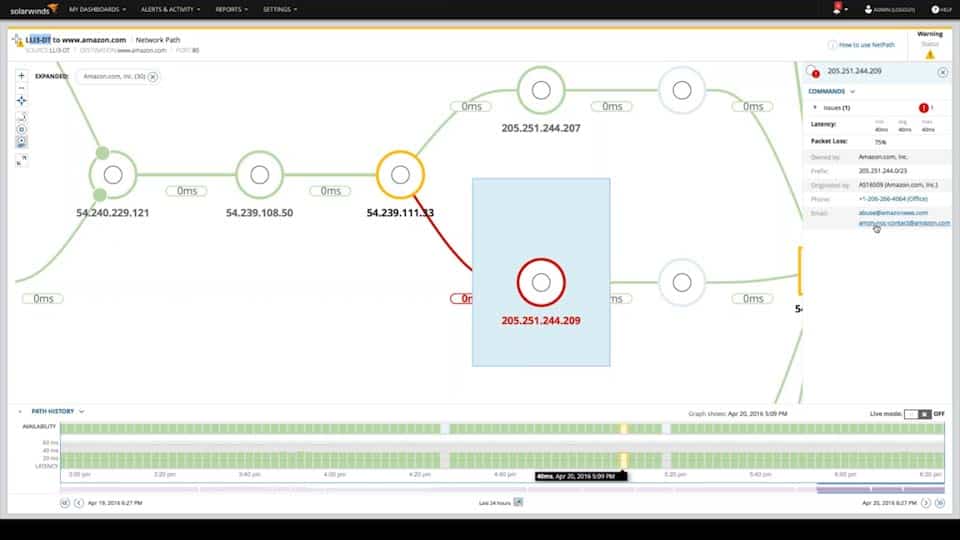
SolarWinds Network Performance Monitor has a wide range of visualization features including graphs, charts, and dials. However, that is just the tip of the iceberg as far as this program is concerned. One particularly interesting visual monitoring feature is called NetPath critical path visualization. This helps you to view dynamic network paths of traffic from hop to hop.
It collects performance data at each hop (which is color-coded based on performance) so that you can see if there is a weak link in the chain. You can then use your cursor to view more detailed information on what the problem is. NetPath is a lifesaver because it allows you to monitor disparate network setups while maintaining visibility.
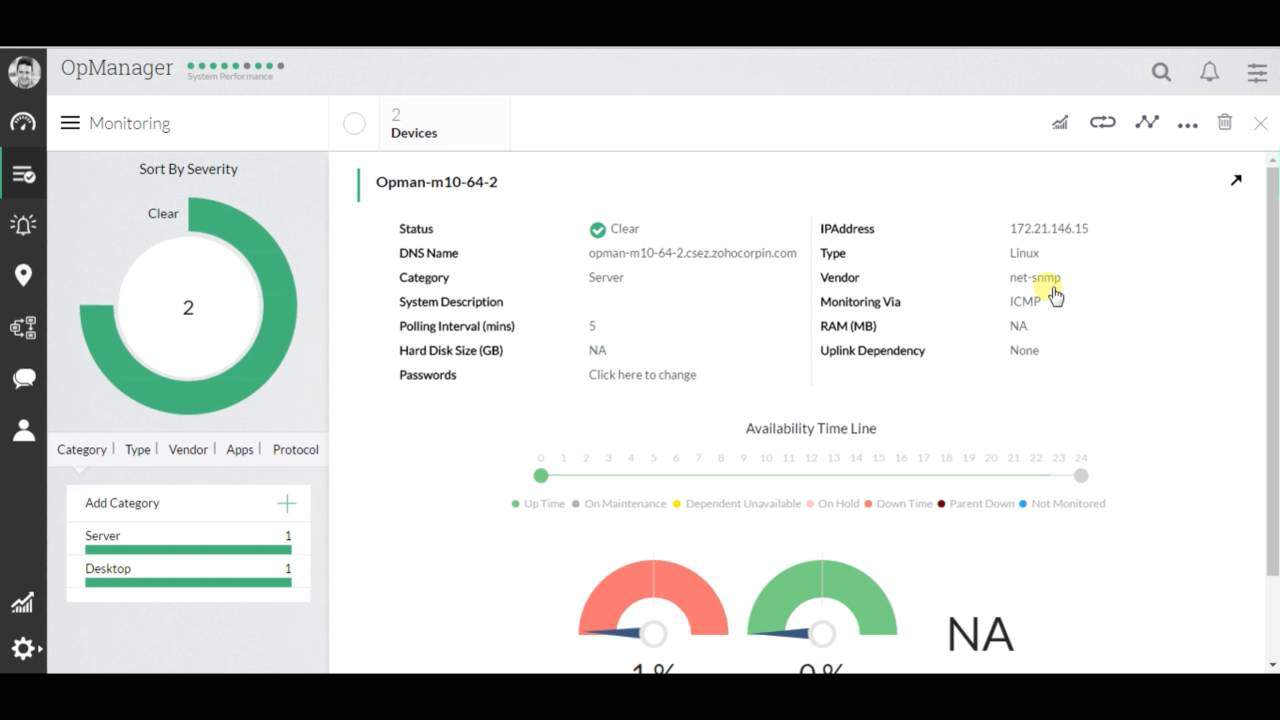
ManageEngine OpManager blends simple dashboard designs with color-coded dials and graphs charts in a similar vein to SolarWinds Network Performance Monitor. All of these designs are easy to read under pressure but what really stands out is ManageEngine OpManager’s network map. You can view topological and geographical maps of your network to see which devices are up and running.
From this perspective, you can see immediately if there is a problem. The great thing about this is that the ManageEngine OpManager autodiscovery feature ensures that this stays up-to-date. It is worth mentioning that SolarWinds Network Performance Monitor also has its own topology map as well. Overall based on the minimalistic approach to visualization, SolarWinds Network Performance Monitor stands out here. The NetPath perspective is a welcome addition.
Alerts
One of the challenges raised by running effective network monitoring is staying on top of live developments. This is particularly problematic on larger networks that have hundreds of different devices to monitor. In fact, in many networks, the sheer volume of connections and live changes are impossible to keep track of without the help of an alerts system. An alerts system automatically keeps an eye out for problematic activity and raises a notification when an administrator needs to intervene.
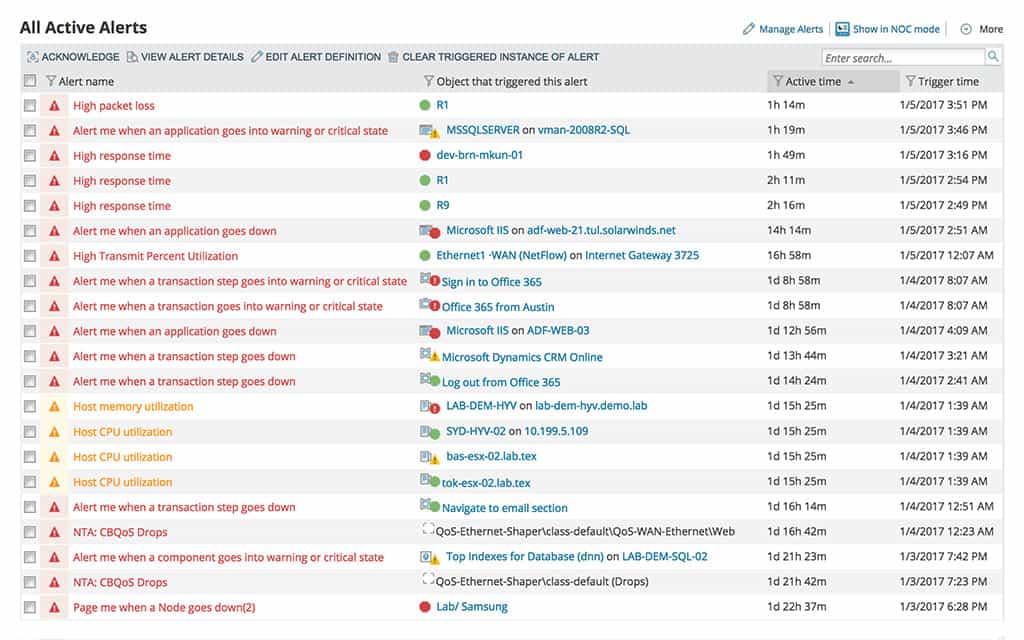
SolarWinds Network Performance Monitor has been designed in line with the philosophy that too many alerts cause “paralysis by analysis”. As a result, it aims to restrict alerts to crucial events. You can define your own trigger conditions to determine what events you receive notifications for and when. Restricting notifications serves to prevent you from being spammed with notifications outside of working hours.
In the event that the system recognizes problematic behavior then you can choose which member of your team gets notified by email or SMS. This is very beneficial because it allows you to strike out with a targeted response to threats as they occur rather than passing on emails to other staff manually after the event.
ManageEngine OpManager also has its own diverse alerts system. With the alerts system, users can choose to receive alerts via email or SMS. You can have alerts that include a note detailing the problem at hand helping the recipient to take action to address it.
One of the most notable aspects of this alerts system is its escalation chain. In the event that the first recipient doesn’t respond in a timely manner, then ManageEngine OpManager will escalate the situation and send the alert to another relevant staff member. This ensures that your network doesn’t grind to a halt if a key member of staff is unavailable for whatever reason.
The escalation chain offered by ManageEngine OpManager is what sells this as a solution for enterprise users. In larger organizations, it is extremely useful to have an escalation chain ready to go in the event that a member of staff is unavailable. This ensures that you won’t experience unforeseen downtime just because your team didn’t react in time.
VoIP monitoring
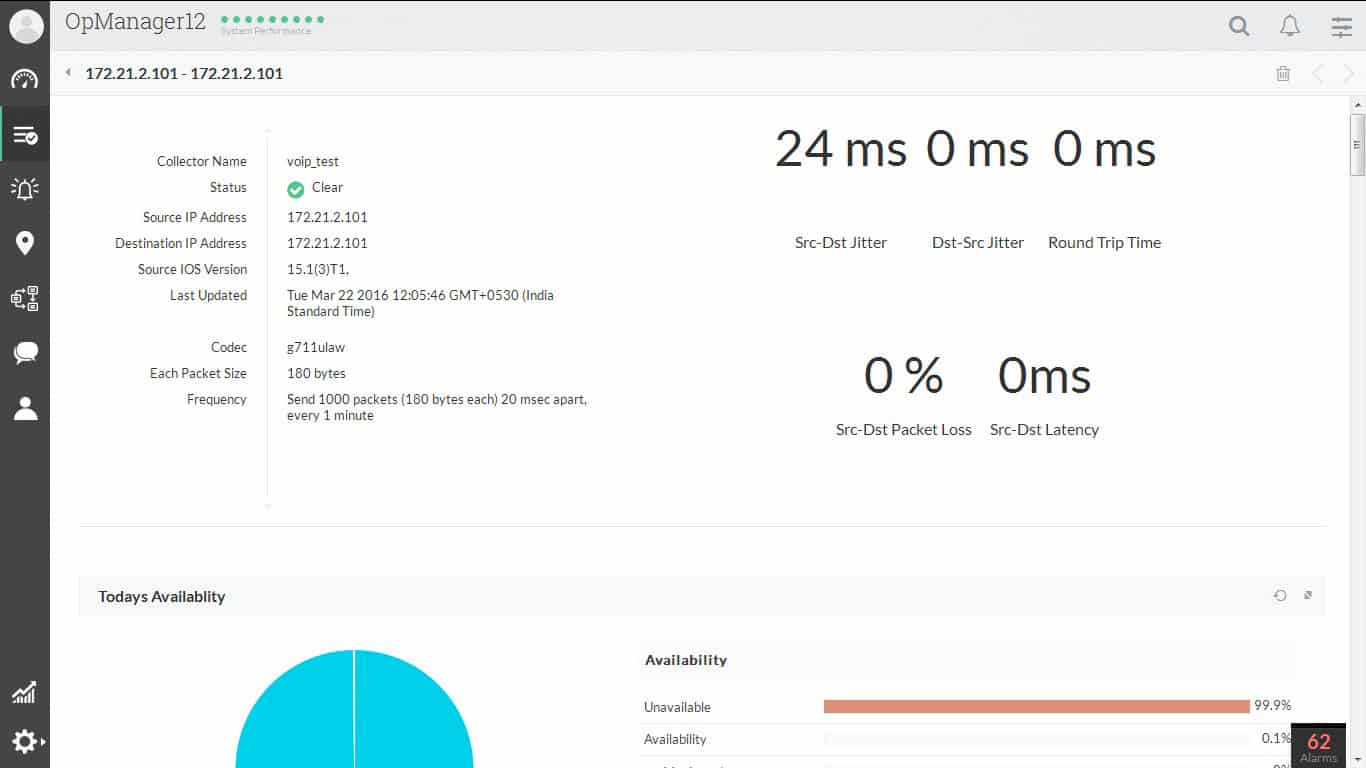
In more complex networks with VOIP solutions, ManageEngine OpManager pays dividends. ManageEngine OpManager allows you to monitor VoIP solutions for problems such as packet loss and latency. There is even a dedicated VoIP monitoring page which allows you to point to a call’s location.
Unfortunately, SolarWinds Network Performance Monitor doesn’t have the same functionality. In order to run effective VoIP Monitoring with a SolarWinds product, you need to download SolarWinds VoIP and Network Quality Manager. As a result, if your network setup involves VoIP devices you’ll find that ManageEngine OpManager has much more on board to support you out of the box.
Pricing
Pricing is an area where ManageEngine OpManager has a distinct advantage. It not only has flexible pricing options but it is also available as a freeware version. The first version is the Free Edition of OpManager which allows users to monitor up to 10 devices. While this isn’t enough for larger organizations it is a good stepping stone for smaller organizations who are unfamiliar with network monitoring. A full list of pricing options for ManageEngine OpManager are shown in this table below:
| Product Version | Device Limit | Starting Price |
|---|---|---|
| Free | 3 | Free |
| Standard | 10 (1,000 max) | $245 (£189) |
| Professional | 10 (1,000 max) | $345 (£265) |
| Enterprise | 250 (10,000 max) | $11,545 (£8,875) |
On the other hand, SolarWinds Network Performance Monitor has no free versions. A list of pricing options for SolarWinds Network Performance Monitor can be seen below:
| Product Version | Elements Supported | Price |
|---|---|---|
| NPM SL100 | 100 | $2,955 (£2,269) |
| NPM SL250 | 250 | $6,720 (£5,161) |
| NPM SL500 | 500 | $10,500 (£8,066) |
| NPM SL2000 | 2000 | $19,345 (£14,865) |
| NPM SLX | Unlimited | $32,525 (£24,986) |
In terms of flexible pricing structures, ManageEngine OpManager offers a better pricing structure out of the two products for smaller organizations. It offers a range of prices that allow smaller organizations to move into network monitoring without investing too much money too fast. By starting at a higher price, SolarWinds Network Performance Monitor may be beyond the reach of many smaller organizations.
OS
The most noticeable difference between these two with respect to OS is that ManageEngine OpManager is available on more operating systems than SolarWinds Network Performance Monitor. Below is a list of operating systems that ManageEngine OpManager can be run with:
| Windows OS | Windows Server 2000/Professional, Windows Server 2003, Windows XP Professional, Windows Vista, Windows Server 2008, Windows Server 2008 R1 & R2, Windows Server 2012, Windows Server 2012 R1 & R2, Windows 7, Windows 8, Windows 10 |
| Linux OS | Redhat Linux 6.0 and up, Redhat Linux Advanced Server 2.1 & 3.0, RedHat Enterprise Server 2.1 & 3, Debian Version 6.0, Debian GNU/Linux 3.0 (Woody), Mandrake Linux 10.0, SUSE 10 and up Cent OS 6.0 and higher, Fedora 18 and up Ubuntu 12 and higher |
In contrast, SolarWinds Network Performance Monitor is compatible with the following:
| OS | Windows Server® 2012, 2012 R2, and 2016 |
| Database | SQL Server® 2012, 2012 SP1, 2012 SP2, 2012 SP3 SQL Server 2014, 2014 SP1, 2014 SP2 SQL Server 2016, 2016 SP1 SQL Server 2017 RC1 |
SolarWinds and ManageEngine bundles
Both SolarWinds and ManageEngine offer bundles of tools that they otherwise offer individually and both have some very tempting packages that involve their network monitoring systems. SolarWinds includes the Network Performance Monitor in two bundles: the Network Bandwidth Analyzer Pack and the Log and Network Performance Pack. ManageEngine has created a super bundle called OpManager Plus.
The Network Bandwidth Analyzer Pack adds the NetFlow Traffic Analyzer to the Network Performance Monitor. This is a logical pairing because both modules can contribute details to a network map, showing capacity and utilization for each link. The two tools merge and are available in a single console. This enables network managers to identify whether a status issue with a switch component is causing observed traffic problems.
ManageEngine OpManager Plus is a much bigger package than the SolarWinds Network Bandwidth Analyzer Pack. As well as OpManager’s network device and server monitoring features, this package includes the NetFlow Analyzer, the Network Configuration Manager, the Firewall Analyzer, which also analyzes logs, OpUtils, which provides an IP address manager and a switch port mapper, and the Applications Manager.
SolarWinds Network Performance Monitor: King of network monitoring
Though both SolarWinds Network Performance Monitor and ManageEngine OpManager are high performers across the board, the former remains as the clear winner here. Though it may not have the IPAM or VOIP monitoring abilities of ManageEngine OpManager, it offers a monitoring experience that is easy to set up and maintain over the long term.
The user is provided with a simple setup process that is tied off with the autodiscovery process. The smoothness of the transition from setup to autodiscovery and monitoring is SolarWinds Network Performance Monitor’s greatest asset. Once deployment is complete, you then have the combination of NetPath visualization and SolarWinds Network Performance Monitor’s dashboard display through which to do your day to day monitoring.
One area where ManageEngine OpManager does have a massive advantage is that of price. Even though this doesn’t apply to every organization, the higher starting price of SolarWinds Network Performance Monitor is a negative for smaller organizations. The lower starting price of ManageEngine OpManager gives smaller companies a chance to enter into the network monitoring game without blowing their entire budget on one platform.
We recommend SolarWinds Network Performance Monitor for companies looking for a network monitoring solution that offers fast deployment and an excellent dashboard design. ManageEngine OpManager is more suitable for smaller organizations. You can download a 30-day free trial of the SolarWinds Network Performance Monitor.

