NetFlow is a network protocol developed by Cisco that notes and reports on all IP conversations passing through an interface. NetFlow is stateful and works in terms of the abstraction called a flow: that is, a sequence of packets that constitutes a conversation between a source and a destination, analogous to a call or connection.
Here’s our list of the best NetFlow analyzers & collectors:
![]()
![]()
![]()
![]()
![]()

A NetFlow exporter device collects data on the IP traffic entering/exiting the device; it inspects packets and groups them into flows by inspecting particular fields: the source and destination addresses, protocols, ports, etc.
Data on observed flows is rolled up from the packets and cached locally (in the flow cache), then it’s periodically exported to the collector based on active and inactive timeouts. NetFlow thus only handles IP, focusing on OSI model Layers 3 and 4. Its knowledge of the IP protocols enables it to interpret packets and work in terms of flows.
The differences between NetFlow and sFlow
Avi Freedman makes an apt analogy to monitoring vehicular traffic: “… while NetFlow can be described as observing traffic patterns (‘How many buses went from here to there?’), with sFlow you’re just taking snapshots of whatever cars or buses happen to be going by at that particular moment”.
Here are the main differences between the two technologies.
Accuracy and scalability
NetFlow’s partisans have long argued that NetFlow can be more accurate than sFlow. NetFlow aggregates data about all packets into flows locally at the device; thus it can’t by happenstance miss a conversation by failing to sample the relevant packets. This granularity of NetFlow is attractive for examining traffic with an individual host. It’s easy to see per-host details, notice localized anomalies, and investigate particular flows. But as traffic volume mushrooms, it becomes less and less feasible to collect every flow. If you’re not doing sampling, scalability becomes an issue.
sFlow is thus more scalable than traditional NetFlow. However, sampling has the downside that there may be gaps in visibility. The packets sampled may not reflect every flow (for instance, short bursts). For detecting and drilling down to investigate security issues, this can be significant.
Device performance at high volumes
As noted above, sFlow does minimal work on the network device, versus NetFlow which uses the device’s CPU and RAM to implement the flow cache. This can become a problem with high-speed devices where many conversations are concentrated onto a link. The additional CPU load on top of the “real work” the device is doing increases based on the number of flows per second, and can consume a significant fraction of the CPU per a Cisco whitepaper (PDF). In contrast, sFlow generally does its packet sampling in the switching/routing ASIC, letting the network device’s CPU concentrate on its core job.
At volumes of hundreds of gigabits per second, such as in edge routing and large data centers, traffic engineering becomes the central concern; the focus is on large-scale patterns and abrupt shifts in volume. Fine-grained visibility into individual hosts becomes less significant. Now sampling starts to become the clear winner. Because of this, NetFlow has added the option of Sampled NetFlow, which makes NetFlow scalable — but loses that accurate high granularity of traditional NetFlow.
Protocol coverage
NetFlow is IP only (with some Layer 2 support added recently). Thus legacy protocols (e.g., Appletalk, IPX) and other non-Internet protocols do not show up. In contrast, sFlow can cover Layers 2 through 7.
Latency
sFlow can have lower latency than NetFlow. A device collecting NetFlow metrics in its flow cache exports them periodically based on active and inactive timeouts. Thus reports on recent and ongoing conversations may be delayed, depending on the timeouts. In contrast, sFlow sends collected packet prefixes and counters in real-time. If sub-minute latency is a concern — and your monitoring/analysis tooling supports it — sFlow may be the better choice.
NetFlow Types and Extensions
Flexible NetFlow and IPFIX provide the ability to have vendor-extensible templates for tweaking the set of packet fields of interest. NetFlow v9 and IPFIX also add the ability to monitor Layer 2 fields. Random Sampled NetFlow adds the option of doing sampling to NetFlow (sampling is mandatory in sFlow).
See also: sFlow – Ultimate Guide to sFlow and sFlow Analyzers
The Best NetFlow Analyzers & Collectors
When your network grows to the point that seeing what’s going on has become tricky, tools leveraging NetFlow may be the solution.
Our methodology for selecting NetFlow analyzers and collectors
We reviewed the market for NetFlow analyzers and collectors and analyzed the options based on the following criteria:
- A system that can sample, capture, or summarize passing packets
- The ability to communicate with other packet capture systems such as sFlow and J-Flow, not just NetFlow
- Bandwidth capacity threshold alerting
- Live statistics reporting with graphical data interpretations
- Capacity planning and bottleneck investigation tools
- A free trial for a risk-free assessment or a free tool
- A good set of utilities that are with paying for or a free tool that is worth installing
Below, we look at several popular NetFlow-based network monitoring and analysis tools for Windows. All are sophisticated, having a considerable learning curve; so online training and good support are essential.
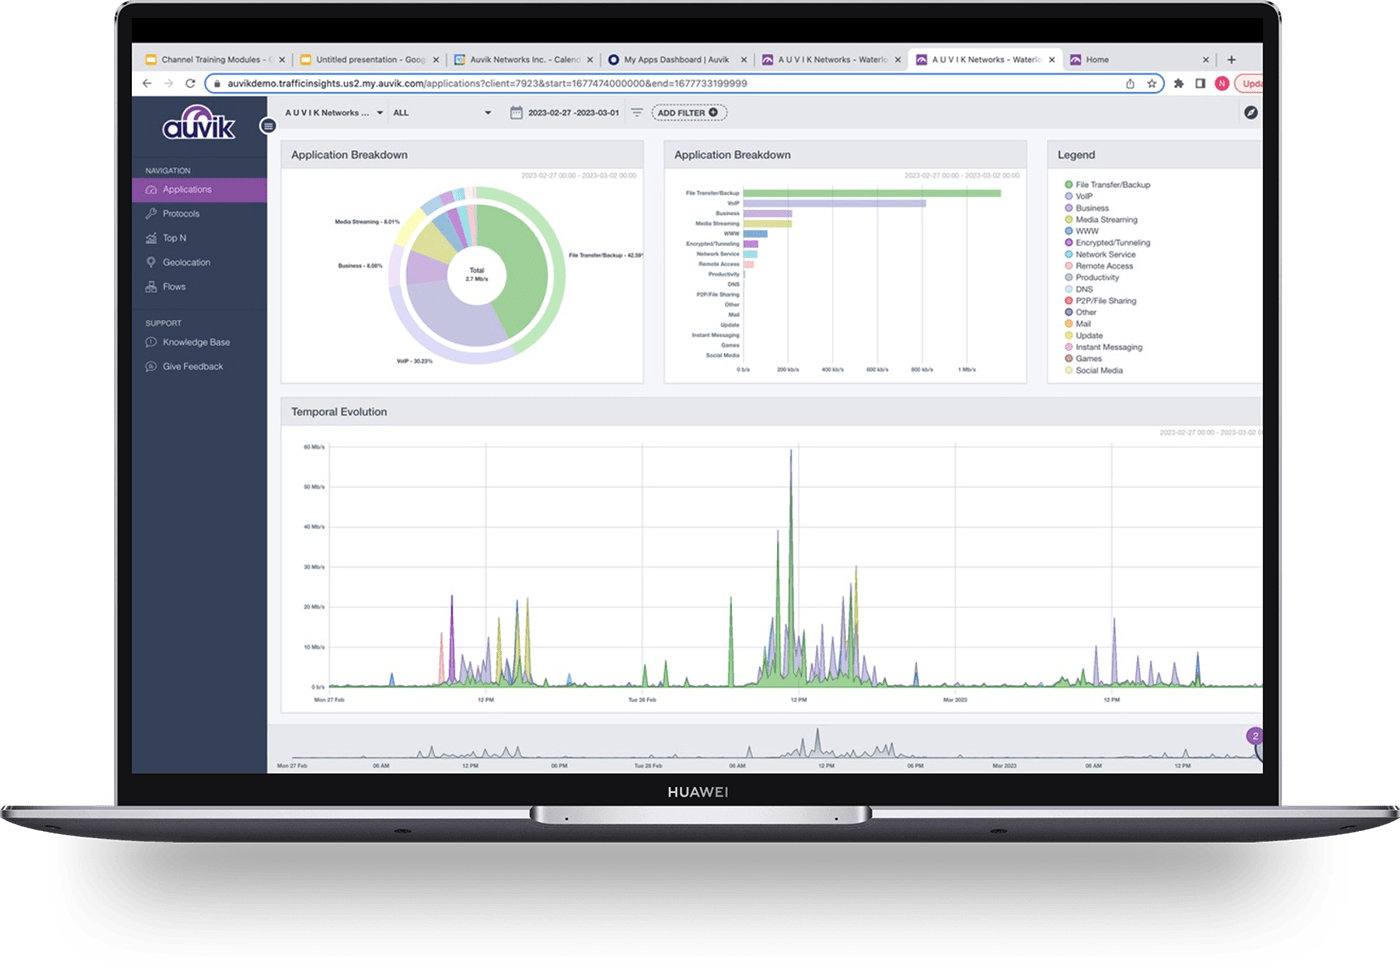
1. Auvik TrafficInsights (FREE TRIAL)

Auvik is a network monitoring package that is delivered on a SaaS platform. The basic plan, Essentials, provides network discovery, inventory management, and topology mapping, which is based on the Simple Network Management Protocol (SNMP). The higher plan, which is called Performance, adds on a traffic analysis package, called TrafficInsights.
Key Features:
- Multi-Protocol Support: Handles NetFlow, IPFIX, J-Flow, and sFlow, ensuring compatibility with various network devices.
- Topology Mapping: Automatically generates a clear visual map of network infrastructure.
- Live Traffic Analysis: Offers real-time insights into network traffic patterns and behaviors.
- Protocol Analysis: See how much bandwidth each application is using.
- Device Traffic Logging: See which endpoints are the source or destination of the most traffic.
Why do we recommend it?
Auvik is easy to set up and use. The tool will install a data collector on your site but that is a guided process. You get a network inventory and topology map from the Auvik system and ongoing device monitoring. The TrafficInsights system adds network flow information to that service.
The TrafficInsights system gathers data from network devices, using a list of protocols, which are NetFlow, IPFIX, J-Flow, and sFlow. This list is necessary because different network device providers use different protocols. So, by building in the ability to use all of them, Auvik ensured that its traffic analyzer can operate in multi-vendor environments.
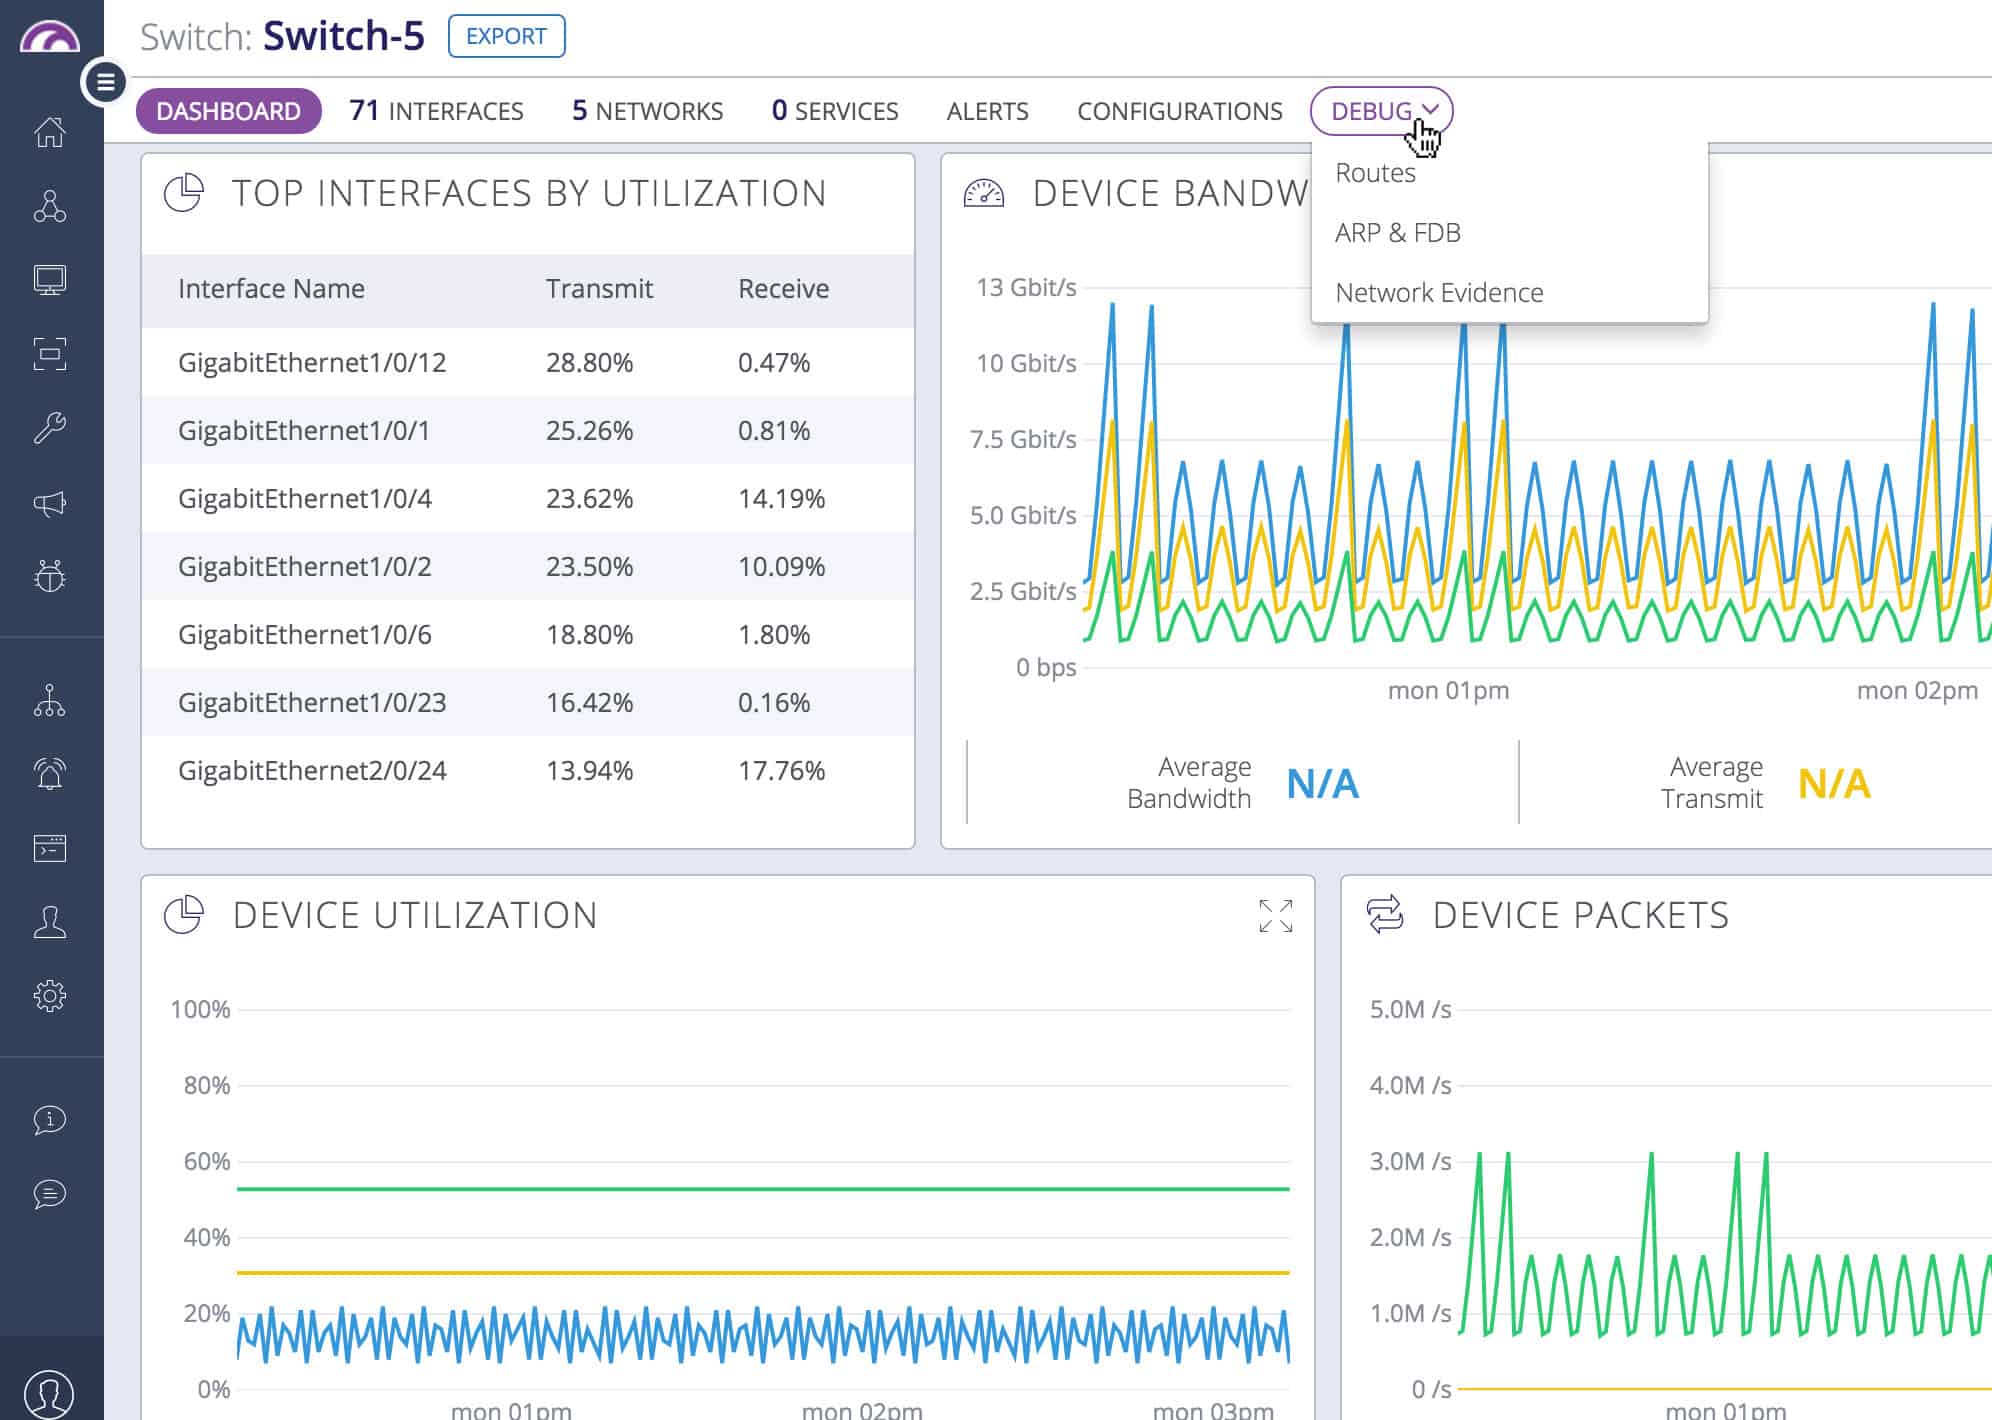
Although there are two plans for Auvik Network Monitoring, you only get the TrafficInsights module with the upper plan. This system shows live traffic statistics in the cloud-based console with analysis, such as top talkers, and the protocols that generate the most traffic on the network. Another visualization shows on a world map, the countries that are sources and destinations of the external traffic passing through the network.
It is possible to implement manual traffic analysis by accessing the flow records and viewing them in the Auvik console. This screen allows you to search, sort, and group records to gain further insights. You can see the source and destination of traffic in each record.
Other features in the Performance edition of Auvik include a log manager that can collect and consolidate messages from Windows and Linux and file them. The log manager also provides a data viewer for manual analysis.
Who is it recommended for?
Auvik is suitable for businesses of all sizes. You need to get the Performance plan to get access to the TrafficInsights system. An Auvik account will monitor multiple sites for a fixed price and there is no extra charge for each device that is to be monitored. This price structure means that large businesses get a better deal from this system.
Pros:
- Versatile Protocol Compatibility: Adapts to different network device protocols, making it ideal for multi-vendor environments.
- Intuitive Setup: I found the guided setup process straightforward, simplifying network monitoring initiation.
- Comprehensive Traffic Insights: Delivers detailed analysis of network flow, enhancing network optimization and troubleshooting.
- Traffic Source Map: See where external traffic is coming from.
- Live Session Analysis: See the characteristics of all currently open sessions.
Cons:
- Cost Consideration for Small Businesses: Might be financially challenging for smaller enterprises due to its pricing structure.
- Limited to Higher Plan: Key TrafficInsights features are only available with the Performance plan, potentially restricting access
for some users.
The Auvik Network Management system is available for a 14-day free trial.
EDITOR'S CHOICE
Auvik TrafficInsights is our top pick for a NetFlow Analyzer and collector because it is designed for IT professionals and network administrators, TrafficInsights provides deep visibility into network traffic, helping organizations monitor, analyze, and optimize their network performance with ease. One of its important features is its ability to collect and analyze NetFlow, sFlow, and other flow data, offering detailed insights into network usage patterns. This capability allows businesses to quickly identify bandwidth hogs, pinpoint the sources of network congestion, and detect unusual traffic that may signal security threats. By providing granular visibility into which applications, users, or devices are consuming network resources, TrafficInsights empowers IT teams to make data-driven decisions to optimize network efficiency. TrafficInsights is also incredibly easy to use, with a user-friendly dashboard that presents complex data in clear, actionable formats. Its integration with Auvik’s broader network management tools enables businesses to correlate flow data with network topology, making it simple to troubleshoot issues and maintain network infrastructure. Another big advantage is its cloud-based deployment, which ensures that organizations of all sizes can benefit from its capabilities without the need for complex on-premise setups. With its comprehensive features and ease of use, Auvik TrafficInsights delivers exceptional value for network performance and security monitoring.
Download: Get a 14-day FREE Trial
Official Site: https://www.auvik.com/lp/network-traffic-analysis/
OS: Cloud-based
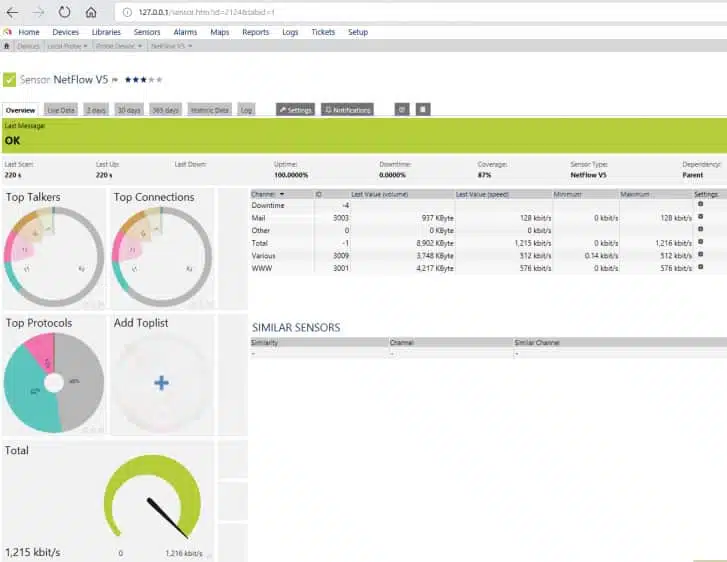
2. Paessler PRTG Network Monitor (FREE TRIAL)
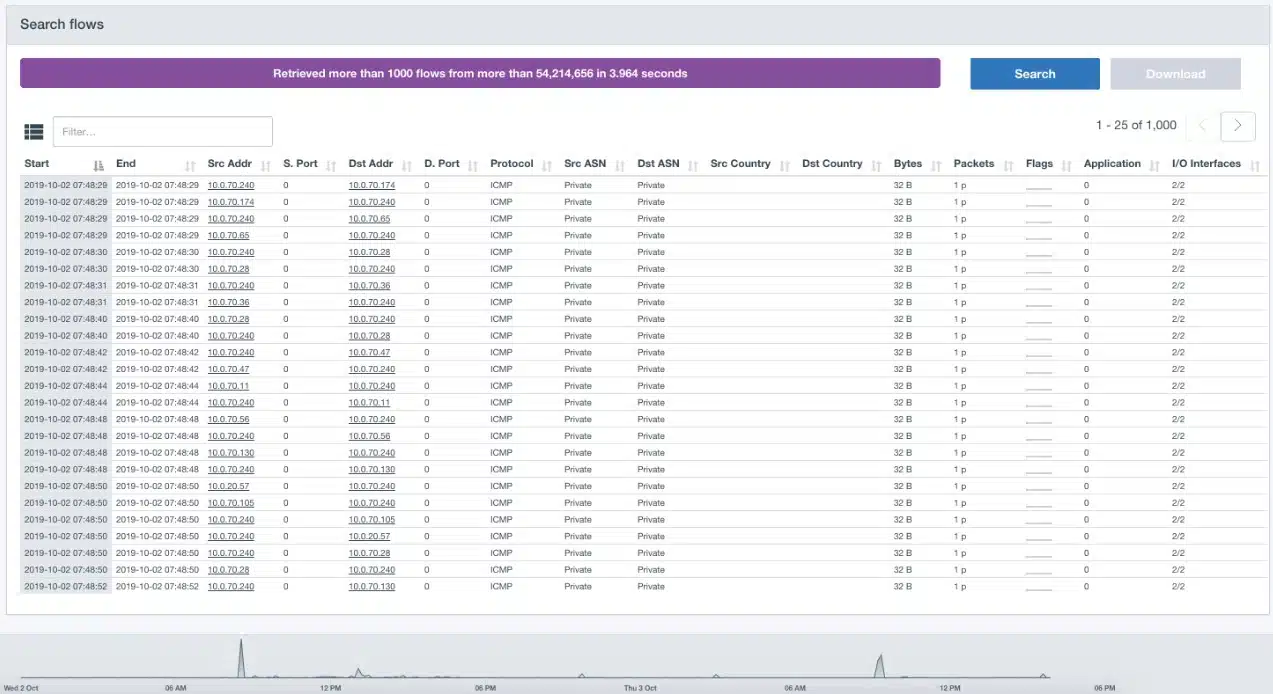
The Paessler PRTG Network Monitor is a “batteries included” solution that monitors bandwidth utilization, the availability and health of devices on your network, and more. PRTG can monitor multiple sites, WAN, VPN, and cloud services. The free version provides unlimited sensors for a month, and thereafter is limited to 100 sensors; a sensor is an individual data stream, so each device will typically require several sensors.
In PRTG’s user interface, a primary view is the device tree showing all devices on your network and the sensors monitoring each. Devices include firewalls, routers, access points, servers, workstations, virtual servers, storage, etc. The device tree is supplemented by table views of sensors, logs, and alarms, as well as various charts and graphs for bandwidth, etc. Tables can be sorted and filtered.
Key Features:
- Extensive Sensor Support: Offers a variety of sensors for tailored network traffic analysis.
- Comprehensive Monitoring: Covers infrastructure, network, and application performance in one platform.
- Flexible Alerts: Customizable alert system for comprehensive monitoring.
Why do we recommend it?
Paessler PRTG Network Monitor is a flexible tool that provides a number of sensors that can be used for network traffic analysis. Among these are a packet sniffer, NetFlow, sFlow, J-Flow, and IPFIX systems, and an IP SLA assessor. The system is able to monitor wireless networks and provides a Ping system for testing local and internet connections. The PRTG package also includes an SNMP monitor that checks on the health of network devices and it includes an autodiscovery function that creates a network inventory and a topology map. This system can also be extended to provide server and application monitoring, giving you a full stack monitoring system.
Drilling down through the tree view reveals indicators and metrics at every level. Settings, like scan interval, are inherited and can be overridden at lower levels in the device tree. Alerts can similarly be set at every level, so you can arrange to be notified about events and threshold transitions of a particular critical device, or rolled up from an overall aspect of your network. Alerts can be transmitted in multiple ways, including SMTP email and SMS text messaging.
The devices-and-sensors abstraction shapes the dashboards and reports too. Custom dashboards can be created, including interactive maps. There is a range of predefined reports, and facilities for designing custom reports; reports can also be scheduled.
Traffic analysis facilities include built-in NetFlow support. For flow protocols, PRTG supports NetFlow, sFlow, and J-Flow. Other protocols/mechanisms used include SNMP, WMI, and packet sniffing. Paessler calls these detection systems, such as the NetFlow collector, “sensors.”
Installation is straightforward. There is a setup wizard, as well as a video providing step-by-step guidance. At installation, the core server’s local probe does auto-discovery to identify devices and set up sensors. Additional sensors (including NetFlow collectors) can be added manually; a video provides instructions.
The core server is Windows only. Monitoring of a single site can be done via the web application, but the simultaneous view of multiple core servers requires using the enterprise app on Windows. A mobile app is also provided. One clever addition is that PRTG provides QR codes that can be pasted on particular devices for a quick look-up and status in the mobile app. PRTG supports clustering for fault tolerance: you can set up failover instances of the monitor.
Who is it recommended for?
Paessler PRTG is available for installation on Windows Server, which means that it competes with SolarWinds and ManageEngine. It is also available as a SaaS package, which puts it in competition with Site24x7. The PRTG system is very comprehensive and is most suitable for large organizations. However, Paessler has an ace up its sleeve to attract small businesses – there is a free version. You don’t have to pay for PRTG if you only activate 100 sensors.
Pros:
- All-In-One Monitoring: Provides a unified solution for diverse monitoring needs, from NetFlow to application performance.
- Efficient Data Handling: Captures only packet headers, optimizing analysis speed and storage efficiency.
- User-Friendly Visualization: Utilizes intuitive graphs for clear traffic insight.
Cons:
- Sensor-Based Licensing: The long-term cost consideration for sensor licensing might be a factor for growing networks.
Though PRTG is all-in-one so you don’t need multiple products and licenses to gain comprehensive monitoring, a key question to evaluate is how many sensors your network needs, and what will be the long-term cost of the sensor-based licensing model as you grow. To evaluate, you can download a 30-day free trial.
Related post: Best Juniper Networks J-Flow Monitoring Tools
3. Progress WhatsUp Gold (FREE TRIAL)
Progress WhatsUp Gold is an on-premises monitoring platform built around a core network device monitoring service, with higher editions adding broader monitoring capabilities. Its NetFlow collection component is called Flowmon, and that unit is included in the top two WhatsUp Gold editions. Flowmon supplies traffic data to the Network Traffic Analysis module, where the information is processed and presented.

Key Features:
- Multiple Flow Protocols: Supports NetFlow, IPFIX, J-Flow, sFlow, and NetStream.
- Monitors Multi-Vendor Networks: Can work with many devices at the same time, even when they use different flow standards.
- Performance Alerts: Raises warnings when traffic-related issues appeare.
Why do we recommend it?
We recommend WhatsUp Gold because it combines traffic analysis with network device status monitoring in the same platform. The system discovers and documents the network, then keeps tracking traffic volumes across each link. Built-in alert thresholds help administrators spot capacity problems quickly.
The traffic analysis module is not sold as a separate product. It works alongside the core network device monitoring service, which is useful because traffic issues are often tied to switch or router faults, or to capacity constraints on the LAN. When the platform reports a traffic problem, technicians can immediately check the condition of the nearby infrastructure from the same console.

The network device monitoring component builds the dashboard by discovering and documenting everything connected to the network. That process also allows Flowmon to determine which flow protocol it should use with each router and switch. The platform continues to rescan the environment, so the dashboard and infrastructure records stay updated as the network changes.
The alerting system for traffic analysis comes with preconfigured thresholds, but those defaults can be changed. Administrators can also define additional alert conditions to reflect the needs of a specific network.
Who is it recommended for?
This module is not available on its own, and it is not included in the two lowest WhatsUp Gold editions. It is intended for environments with between 1,000 and 25,000 connected devices, so it is not aimed at small businesses. Organizations that buy it also gain access to other modules, which together provide a broader full-stack monitoring platform.
Pros:
- Partners with a Network Device Monitor: Combines traffic records with live device health data.
- Automated Setup: Builds visibility into the network without requiring manual device entry.
- Network Topology Map: Generates a map of the network automatically.
Cons:
- No Cloud Version: This is an on-premises product for Windows Server.
Progress offers four WhatsUp Gold editions: Business, Enterprise, Enterprise Plus, and Enterprise Scale. The network traffic monitor with the Flowmon collector is included only in Enterprise Plus and Enterprise Scale. The software runs on Windows Server, and you can try it through a 30-day free trial.
4. ManageEngine NetFlow Analyzer (FREE TRIAL)
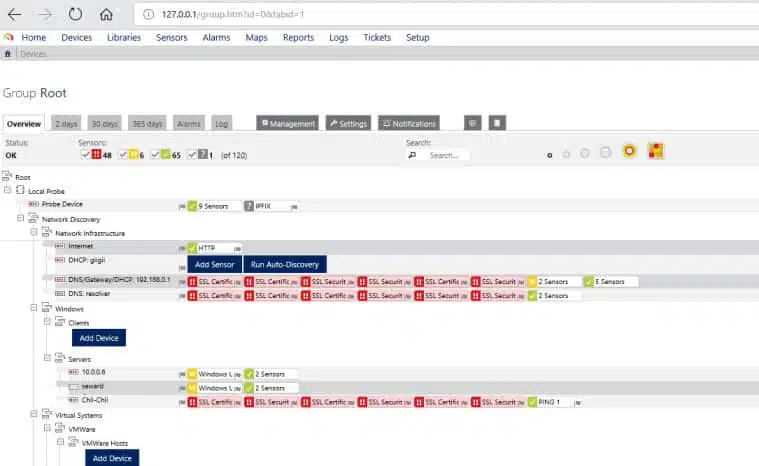
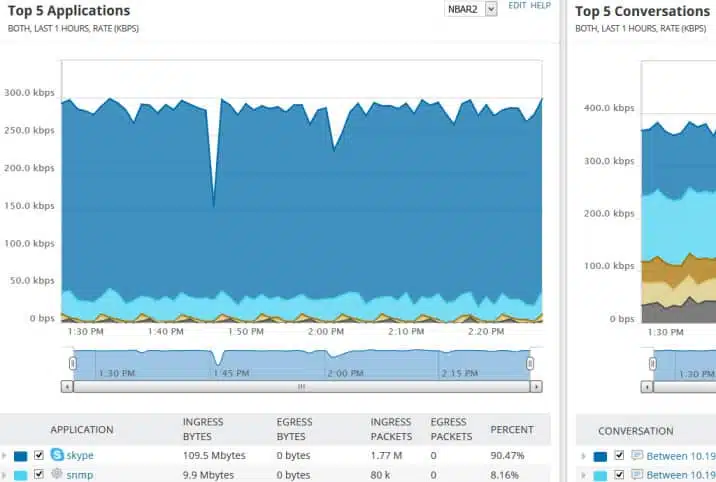
The ManageEngine NetFlow Analyzer provides real-time visibility into network bandwidth and traffic patterns. The tool visualizes traffic by applications, conversations, protocols, etc. Alerts can be set based on traffic thresholds. There are a variety of useful predefined reports, ranging from troubleshooting oriented to capacity planning and billing. Custom search reports can be created.
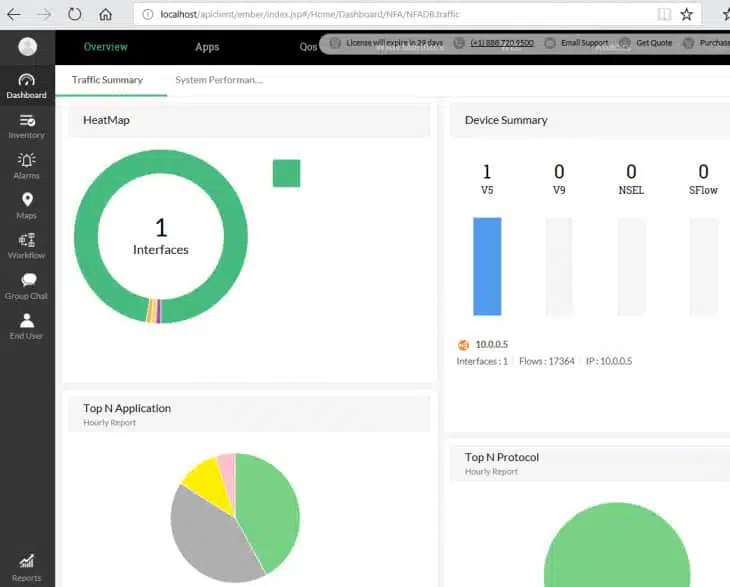
The NetFlow Analyzer has a suite of NetFlow-oriented tools for managing complex networks. The web-based user interface has a default dashboard with several real-time pie charts, including a heat map showing the status of monitored interfaces, top applications, top protocols, top conversations, recent alarms, top QoS, and more.
Key Features:
- Real-Time Traffic Analysis: Provides instant visibility into network bandwidth and traffic patterns.
- Multi-Site Monitoring: Capable of overseeing traffic across various locations effectively.
- VoIP Traffic Focus: Specialized in managing time-sensitive traffic like VoIP.
Why do we recommend it?
ManageEngine NetFlow Analyzer is a standalone software package that will provide an analysis of traffic patterns by querying the devices produced by all the major network hardware providers. It is able to extract statistics through the use of NetFlow, IPFIX, sFlow, J-Flow, Netstream, and AppFlow. This system will also monitor wireless networks and the highest plan will cover multiple sites and the internet connections between them. This package can also focus on time-sensitive traffic, such as VoIP through IP SLA scoring. It is able to implement traffic shaping measures with mechanisms such as CBQoS
Hovering over a graphic usually provides an explanatory pop-up, and clicking on any graphic drills down to more details on the selected element. There are specific displays for detecting security issues. Dashboards are customizable.
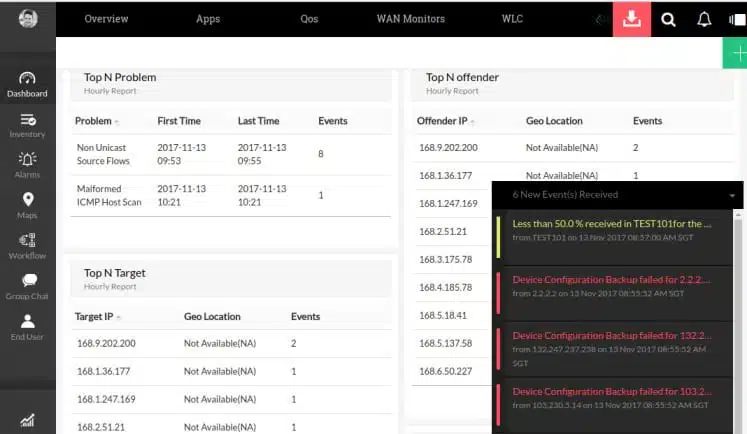
Alerts show up as pop-ups on the user interface. Multi-site traffic can be analyzed; there is a smartphone app for mobile monitoring and alerting.
Flow technologies supported include NetFlow, IPFIX, J-Flow, NetStream, and several others. The tool leverages advanced features of Cisco devices, including support for adjusting the traffic shaping and QoS policies on your network.
Who is it recommended for?
This is a package for mid-sized and large organizations. There is a Free edition for small businesses. However, it is limited to monitoring two interfaces, which isn’t really enough for anything larger than a home office. So, this isn’t a tool that would be suitable for small businesses. The ManageEngine system is a major competitor to our number one pick, SolarWinds NetFlow Traffic Analyzer. This system has a few advantages over the SolarWinds system. First, this is a standalone package, while the SolarWinds NetFlow Traffic analyzer needs to be paired with the Network Performance Monitor. The other advantage that ManageEngine has is that this tool installs on Windows Server, as does the SolarWinds system, but, unlike the rival product, the NetFlow Analyzer will run on Linux and it is available as a service on AWS.
Pros:
- Flexible Protocol Support: Accommodates a variety of protocols, making it suitable for diverse network environments.
- Scalable Solution: Efficiently handles large enterprise networks, adapting to growing business needs.
- Detailed Traffic Analysis: Offers granular traffic insights, aiding in precise network management.
Cons:
- Limited Appeal for Smaller Networks: Not designed for small-scale network environments.
- Complexity for Non-Technical Users: Might present a steep learning curve for users without technical expertise.
The ManageEngine NetFlow Analyzer provides a range of capabilities for managing complex networks making heavy use of NetFlow. The free version allows unlimited monitoring for 30 days but then reverts to monitoring only two interfaces. ManageEngine has various related products to expand beyond NetFlow traffic-oriented data analysis into a full network management suite. Download the 30-day free trial.
5. Site24x7 Network Traffic Monitoring (FREE TRIAL)
Site24x7 Network Traffic Monitoring is a cloud-based traffic analyzer that forms part of several system management packages. Site24x7 offers infrastructure monitoring, website management, and an application performance monitor, and a system for managed service providers.
This tool provides live network traffic monitoring and also stores data for capacity planning and trend analysis. As a cloud service, the dashboard is accessed through any standard web browser. All of the processing for the service is performed on the Site24x7 servers but there also needs to be an agent installed on site.

Key Features:
- Integrated Monitoring Suite: Part of a full-stack service monitoring range, offering comprehensive insights.
- Cross-Vendor Support: Compatible with devices from over 200 vendors, enhancing versatility.
- Anomaly Detection: Identifies unusual traffic patterns for security monitoring.
Why do we recommend it?
Site24x7 Network Traffic Monitoring is a module in a package of full-stack monitoring services. This is a SaaS package and forms part of a combo pack that includes server, application, and website performance monitoring as well. The network monitoring features of the package also provide SNMP-based device status checks. This system is able to extract statistics from network devices using NetFlow, sFlow, J-Flow, CFlow, IPFIX, Netstream, and AppFlow. This system can also be used for security monitoring by identifying traffic pattern anomalies.
The monitor communicates with network switches through a number of protocols. These include NetFlow, sFlow, J-Flow, IPFIX, CFlow, NetStream, and AppFlow. The system extracts traffic statistics and it can also sample packet headers. The information taken from traffic enables the traffic monitor to identify traffic per application, per source and destination, and per user account. The system can communicate with the network devices supplied by more than 200 vendors.
As well as spotting traffic hogs, the analyzer shows time-series graphs and can identify peak hours. This information allows network managers to squeeze extra value out of existing resources by moving non-urgent tasks such as batch administration processes to less busy periods of the day.
Who is it recommended for?
Site24x7 is a branch of Zoho, which also produces ManageEngine. The ManageEngine systems can be run on cloud platforms – for example, the NetFlow Analyzer can be installed on AWS – but these are not SaaS packages. Site24x7 is the SaaS version of all of the main ManageEngine tools for monitoring networks, servers, and applications. You get all of those systems in a plan, not just the Network Traffic Monitoring unit. If the ManageEngine NetFlow Analyzer appeals to you but you want a SaaS package, go for Site24x7 instead.

The information shown by the network monitoring system is able to plot traffic loads link by link and also end-to-end across the network. It is able to spot bottlenecks and assist in traffic-shaping measures, such as queuing and prioritization.
The monitor imposes performance thresholds that are set at levels that allow time to fix problems. If a threshold gets tripped, the service generates an alert. This is shown on the system console and can also be sent out to key personnel as an email, SMS, or voice-calls.
Pros:
- Intuitive User Interface: Features one of the most user-friendly dashboards among NetFlow analyzers.
- Mobile Monitoring Capability: Includes a functional mobile app for both Android and iOS, facilitating remote management.
- Diverse Vendor Integration: Supports a wide array of vendor devices, ensuring broad compatibility.
Cons:
- Feature-Rich Complexity: The platform’s extensive features can be overwhelming to fully master.
- Learning Curve: Might require significant time investment to leverage all available features and customization options.
The network traffic monitoring service is included in the Website Monitoring plan, which is offered in four editions with the cheapest starting at $9 per month. It is also included in the Infrastructure package, which also starts at $9 per month. Site24x7 offers an Application Performance Monitor (APM), which includes the network traffic monitor and starts at $35 per month.
An All-in-One package from Site24x7 offers all of the services included with all of its other bundles and that includes the traffic monitoring system. That plan is available in four editions, with the cheapest costing $35 per month. An MSP plan, which is a multi-tenanted version of the All-in-One plan, includes the network traffic monitor and its price starts at $45 per month. All of the plans and editions of Site24x7 are available for 30-day free trials.
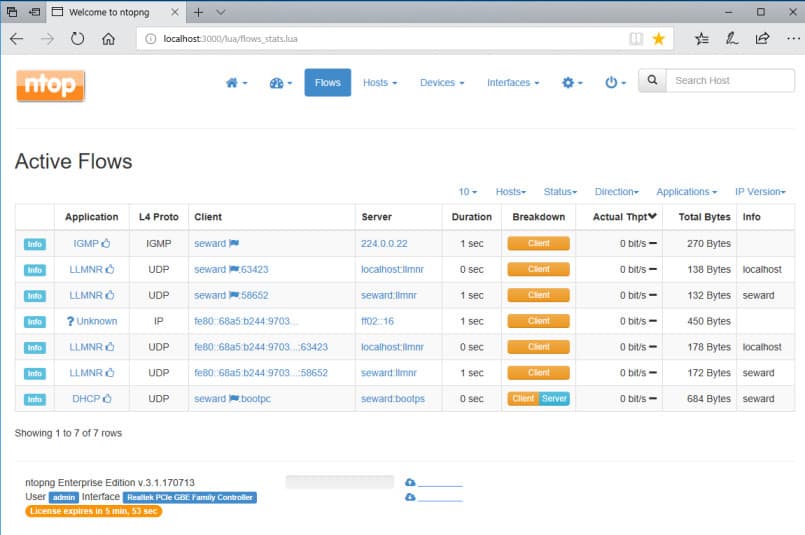
6. Nprobe and ntopng
ntopng is an open-source web-based traffic analysis tool that does passive network monitoring based on flow data and statistics extracted from observed traffic. ntopng does the packet capture itself; to receive flow data it depends on nProbe, a NetFlow/IPFIX exporter/collector. Flow protocols include NetFlow v9, IPFIX, and NetFlow-lite.
The community version of ntopng is free. The professional (small business) and enterprise versions require a paid license, but are free to educational and nonprofit organizations. nProbe can be test-driven for free but a fully functioning version requires a paid license. So the use of NetFlow data is limited (unless you qualify for a free license).
Key Features:
- Open-Source Flexibility: Offers customizable monitoring solutions through open-source availability.
- Multi-Protocol Compatibility: Supports various flow protocols, enhancing adaptability.
- Cross-Platform Operation: Runs on Windows, Linux, macOS, and Unix, catering to diverse system preferences.
Why do we recommend it?
Nprobe and ntopng are a suite – you won’t use Nprobe directly because this is the packet sniffer that supplies ntopng with raw data for analysis. The system is very flexible and it can be used to gather SNMP data to monitor device health. It can analyze packets by protocol and it is also a useful system for anomaly-based intruder detection. The ntopng package is also able to query network devices using the NetFlow and IPFIX protocols. The statistics delivered by this tool can be displayed as graphs and they can segment metrics by a range of characteristics, such as protocol.
ntopng’s web-based user interface rolls up data into traffic (e.g., top talkers), flows, hosts, devices, and interfaces. Most categories have multiple views, a mix of charts, tables, and graphs; and in each you can drill down to explore in depth and cross-reference. Tables can be sorted – so for instance, selecting the throughput column on the flows table shows the current top bandwidth users.
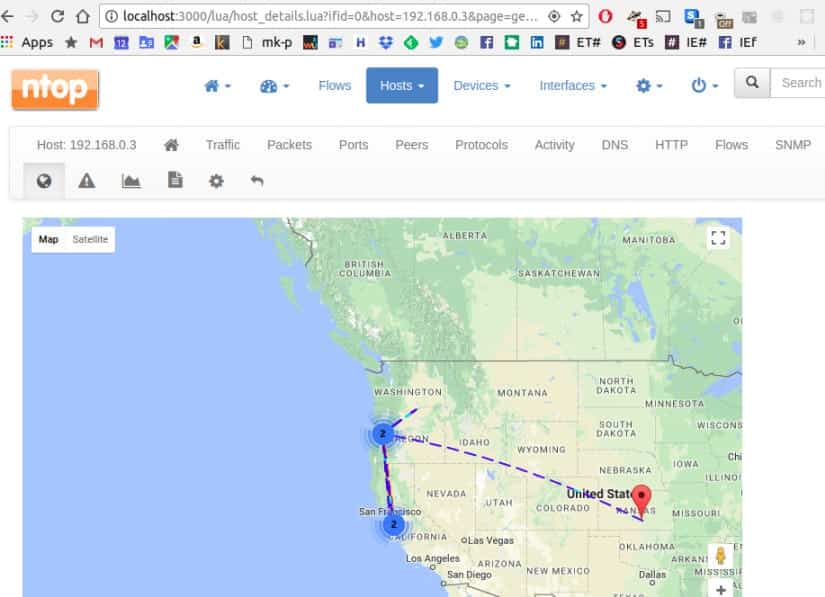
The flow display shows application protocols (e.g. Facebook, YouTube). Latencies and TCP statistics (e.g. packet loss) are displayed. Observed hosts/IP addresses can be displayed on a map via geolocation. Alerts can be set on hosts based on many criteria, and will show up as an icon in the user interface.
The professional version can save and display historical application usage statistics, do active monitoring via SNMP, generate custom traffic reports, and several other additional features.
The installation package for both ntopng and nProbe is a zip file containing a standard Windows setup wizard. The installer will install winpcap (for packet sniffing) if needed.
Who is it recommended for?
This is an on-premises system that will run on Windows, Linux, macOS, and Unix. This is a particularly appealing system for small businesses because there is a free version. Technicians that can take the time to learn how the tools packet filtering and analysis tool works can get a lot of value out of this system because it can also be used as a security monitor to detect anomalous traffic and spot intrusion. However, large businesses would probably require a traffic analyzer that has a higher degree of monitoring automation so that they can get value out of their highly-paid technicians.
Pros:
- Customization Potential: Highly adaptable for specific needs due to its open-source nature.
- Comprehensive Protocol Support: Ideal for environments with mixed device types.
- Educational and Non-Profit Benefits: Free options available for certain organizations.
Cons:
- Challenging Setup: Might present a steep learning curve, especially for those without technical expertise.
- Limited Full Functionality: Some advanced features are accessible only behind a paid version.
Since ntopng is open source, there is considerable scope for extending it. Data can be exported to MySQL, ElasticSearch, and LogStash, where it can be merged into the reports stored by your Syslog server.
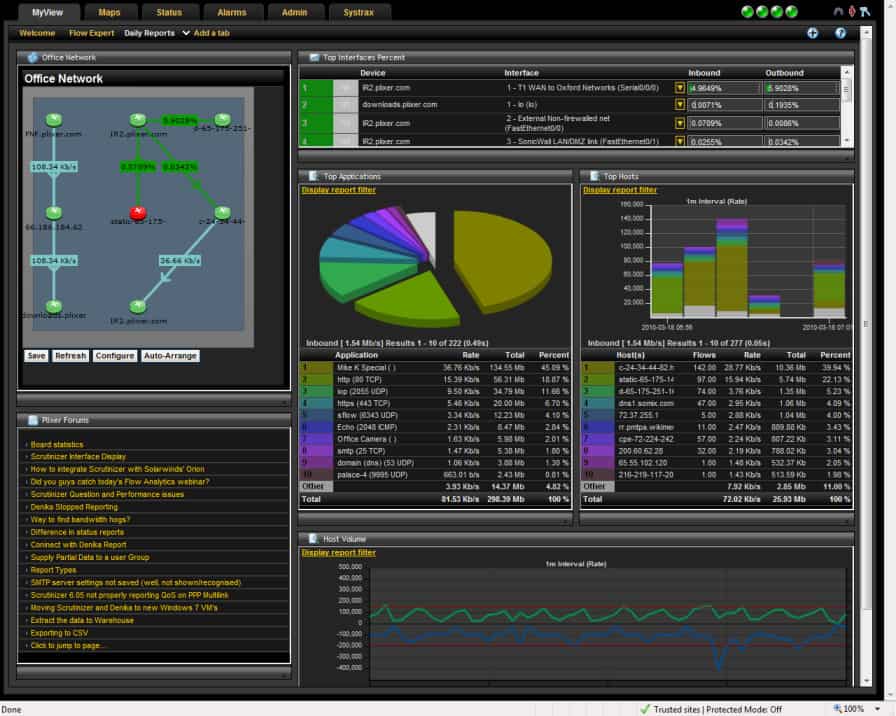
7. Plixer Scrutinizer
Plixer Scrutinizer is a sophisticated flow-oriented traffic analysis system with particular focus on security forensics (it’s called the “Scrutinizer Incident Response System”). It supports both NetFlow and sFlow.
Scrutinizer can be installed as a dedicated physical appliance, as a virtual machine running on a server, or as a SaaS solution running in the cloud (public or hybrid). It’s a sophisticated system, so even the free trial on a virtual machine demands considerable resources (e.g., a dedicated 16GB of RAM).
Key Features:
- Dual Focus: Combines performance monitoring with security forensics for comprehensive insights.
- Deployment Flexibility: Available as SaaS, on-site, or virtual appliance, suiting various infrastructural needs.
- Scalable Solution: Tailored for environments ranging from small to very large.
Why do we recommend it?
Plixer Scrutinizer is designed primarily to provide security monitoring but it can also implement traffic performance analysis. This tool is very fast at detecting specific patterns of traffic that can indicate an intruder or a traffic flood attack. The system acts as a protocol analyzer and also implements traffic source device profiling to provide insights into where anomalous traffic is coming from or where the network has become congested. The screens offer data representations in a number of formats simultaneously, which can help technicians to manually identify problems quickly.

Scrutinizer is designed for high network performance and scalability from small to very large environments. It provides a rich range of analysis and reporting features.
The trial includes full access for 30 days. After that, the free version has a limit of 10K flows collected per second, five hours of raw flows kept, and one week of historical summaries maintained. The paid version includes notifications, dashboard customization, custom reports, scheduled email reports, and support.
Who is it recommended for?
As it is more of a security tool, the Plixer Scrutiny system doesn’t really compare to the other tools on this list for traffic analysis. You wouldn’t buy this tool just for network performance monitoring. The system provides more functionality than a small business would need. The purpose of this tool is to bring activity identification for network managers that operate systems that are so large that they are constantly at risk of becoming unmanageable through manual scrutiny. Plixer has a wide potential market for its product from the context of system requirements because it can be run on premises as a virtual appliance or on a cloud platform. However, there isn’t a SaaS version.
Pros:
- Adaptable Implementation: Offers multiple deployment options to fit different organizational requirements.
- Enhanced Security Features: Includes additional traffic analysis capabilities focused on security.
- Large Network Suitability: Ideal for handling large-scale enterprise network environments.
Cons:
- Resource Intensity: Demands significant system resources for optimal functioning.
- Complex Learning Curve: More intricate to navigate compared to similar tools, requiring deeper understanding.
- Opaque Pricing: Requires direct contact with sales for detailed pricing information, lacking upfront transparency.
License pricing depends on the platform chosen and the number of flow exporters to be supported.
8. SolarWinds NetFlow Traffic Analyzer
The SolarWinds NetFlow Traffic Analyzer (NTA) is a bandwidth monitor that handles not just the original Cisco Netflow but many of its variants from other manufacturers, as well as NetFlow’s primary alternative, sFlow.
Once installed, NTA offers you a wide range of sophisticated facilities for managing multi-vendor networks. It features bandwidth monitoring, traffic analysis, performance analysis, alerts, customizable reports, policy optimization, and more.
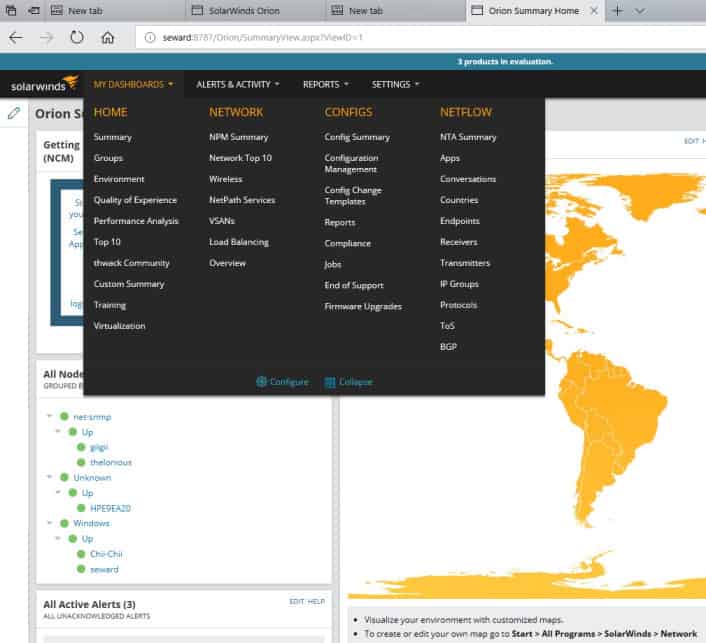
The NetFlow Traffic Analyzer gathers flow data exported by the flow-enabled devices tracked by the SolarWinds network monitoring software.
Key Features:
- Broad Protocol Support: Compatible with NetFlow, sFlow, J-Flow, and others, ensuring wide network device integration.
- Customizable Dashboards: Enables personalized data visualization for enhanced monitoring.
- Quality of Service Tracking: Monitors and manages network traffic priorities effectively.
Why do we recommend it?
SolarWinds NetFlow Traffic Analyzer provides traffic statistics gathering with NetFlow, sFlow, J-Flow, IPFIX, and NetStream. You can get packet data categorized by NBAr2 and see which applications are using up most of your bandwidth. This package can also assess wireless network and VMware vSphere performance. The package partners with SolarWinds Network Performance Monitor to give you device discovery and network mapping as well as live device status checking. Special features in this bundle let you track traffic patterns along a route between two given endpoints with the NetPath utility.
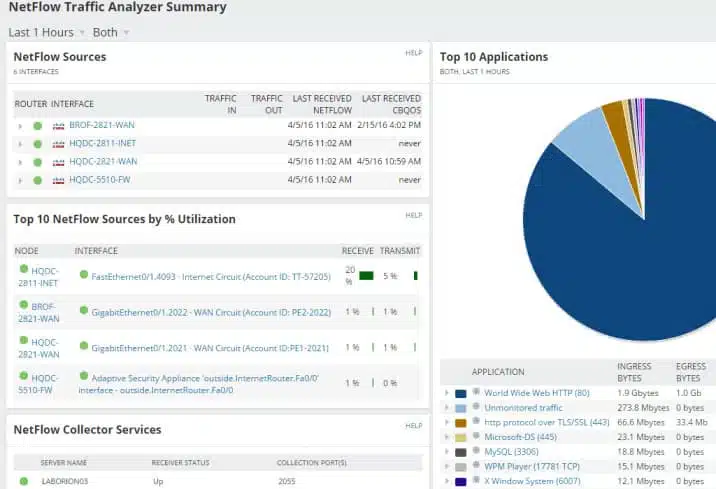
The default NetFlow Traffic Analyzer Summary has multiple sections like Top 5 Applications, Top 5 Endpoints, Top 5 Conversations, Top 10 Sources by % Utilization, etc.
As a flow analyzer, NTA identifies the users, applications, and protocols consuming the most bandwidth. You can sort by ports, source, destination, and protocols, and view traffic patterns over minutes, days, or months.
The NetFlow Traffic Analyzer is also able to collect traffic data with the protocols used by other manufacturers, such as J-Flow from Juniper Networks and NetStream from Huawei. This tool can track the performance of wireless networks and VMWare vSphere virtualizations. The facilities within the NTA allow you to implement traffic shaping measures and get the best value out of your existing network resources, without compromising on service quality.
Who is it recommended for?
The NetFlow Traffic Analyzer provides automated traffic monitoring systems and tools for manual analysis. Once you identify important traffic that needs to be prioritized, you can implement that traffic shaping through the NetFlow Traffic Analyzer with CBQoS measures. This package is suited to large organizations with complicated networks. With this tool, you can squeeze extra value out of your existing infrastructure and avoid the expense of buying more hardware.
Pros:
- User-Friendly Interface: Offers a clean and intuitive dashboard, facilitating easy navigation and data interpretation.
- Comprehensive Network Support: Works seamlessly with various networking technologies, providing a versatile solution.
- Efficient Data Categorization: Effectively organizes packet data for quick insights, enhancing network management.
Cons:
- Not Ideal for Small Networks: May be overly complex for small LANs or home setups.
- Windows and Linux Compatibility: While it supports diverse operating systems, this may require additional setup for non-Windows
environments.
If you have a sophisticated network with NetFlow-enabled devices, NTA’s capabilities are worth exploring. For details on NTA, see our SolarWinds NetFlow Traffic Analyzer review. You can also start a 30-day free trial.
9. Noction Flow Analyzer
Noction Flow Analyzer offers three main strategies to network managers. These are to monitor and control bandwidth utilization, to implement capacity planning, and to detect and prevent network performance problems.
The system has a striking front-end. You are free to choose between the Light, Dark, or Auto theme options. Here, below, you can see the Data Explorer screen, which provides detailed network traffic stats in both graphs and report forms. “Group by”, “Filters” and “Devices” functions are available to focus or broaden attention to the desired aspects of network traffic or specific network nodes. You can look at network traffic details and filter by protocol, source and destination addresses, ports, VLANs, L2 MAC addresses, TOS, MPLS labels, AS paths, etc. All data queries can be subsequently saved as widgets and placed on dashboards.

Multiple dashboards can be set up in NFA. These are the collections of graphs that are typically grouped by a specific purpose, e.g capacity planning, enabling you to see trends and cycles in traffic patterns and giving you the choice over which capacity strategy to adopt.

Key Features:
- Comprehensive Monitoring: Enables detailed observation of network traffic for efficient bandwidth utilization and capacity
planning. - Advanced Path Analysis: Provides insights into traffic paths for optimized routing and performance.
- Intuitive Data Query Tools: Offers flexible data exploration to analyze specific network aspects or nodes.
Why do we recommend it?
Noction Flow Analyzer operates with NetFlow data to examine traffic within a network and it can be extended to provide information about traffic flowing in and out of the network. This system has a very attractive console with informative graphs and charts that display live traffic statistics and can also be deployed for manual historic analysis. The Noction system can also be set up to raise alerts if traffic congestion is detected and performance drops.
The network monitoring system lets you see live traffic data with the facility to examine traffic at each node or look at ends-to-end traffic between two given points.
You can set up alerts on any of the metrics that the Flow Analyzer collects. These are thresholds that will activate alerts when they are crossed. These alerts can be sent to technicians via email or Slack, so staff does not need to watch the network monitor unless a problem is developing.
Who is it recommended for?
Noction Flow Analyzer is too expensive to appeal to small businesses and mid-sized businesses will probably be more comfortable with the automated monitoring of the SolarWinds, ManageEngine, and Site24x7 tools on this list. The price structure of Noction Flow Analyzer is going to be particularly attractive to large businesses because one subscription can be used to monitor multiple sites with no limit to the size of each network. This is an on-premises system that runs on Linux.
Pros:
- User-Friendly Interface: Boasts an attractive web-based interface for straightforward navigation and data interpretation.
- Real-Time Monitoring: Capable of live traffic observation, facilitating immediate issue identification and response.
- Versatile Data Analysis: Historical traffic pattern analysis aids in strategic capacity planning decisions.
Cons:
- Platform Restrictions: Available only for Linux, limiting usage for environments primarily using other operating systems.
- On-Premise Hosting Requirement: Needs to be hosted on-site, which may not be feasible for all organizations.
Noction Flow Analyzer is a software package for installation on Ubuntu, CentOS, or RHEL Linux. The system creates a Web server so the screens for the system are accessed through any standard Web browser. Despite hosting the service yourself, you do not buy the software outright. Instead, you pay a subscription, with a rate per month or per year. There is one add-on service, which is to collect Border Gateway Protocol internet routing data from the network gateway. You can try the Noction system on a free trial.
10. Nagios XI and Nagios Core
Nagios is an enduring standard in network monitoring. Nagios Core is the open-source free version, and Nagios XI is the commercial for-cost variant with additional features and automated assistance for configuration. Nagios has a reputation for being powerful, reliable, scalable, and extremely customizable – and being complex to configure.
Key Features:
- Version Variety: Offers both a free, open-source version and a more feature-rich paid version.
- Extensibility: Can be enhanced with free plugins for tailored monitoring solutions.
- SNMP Traffic Measurement: Utilizes SNMP for network traffic assessment.
Why do we recommend it?
Nagios XI and Nagios Core are two versions of a very highly respected system monitoring package. The Nagios Core system is an open source project and it is free to use. However, it doesn’t have a proper front end, so you would have to organize another system to pair it up with – the free Kibana package is a good option. The Nagios XI package has a very good front end and it provides full-stack live monitoring. Annoyingly, Nagios has split its traffic analysis service into a separate product, so there is no NetFlow feature in either version of the Nagios system. Nagios can be expanded by free plug-ins. However, the Nagios team has ensured that there are no NetFlow extensions available as a competitor to its paid add-on.
The free version has a learning curve but also an active community. It monitors servers, services, and applications, just like the commercial version. It includes reporting by email and SMS, a basic user interface (including the network map), and basic reports.
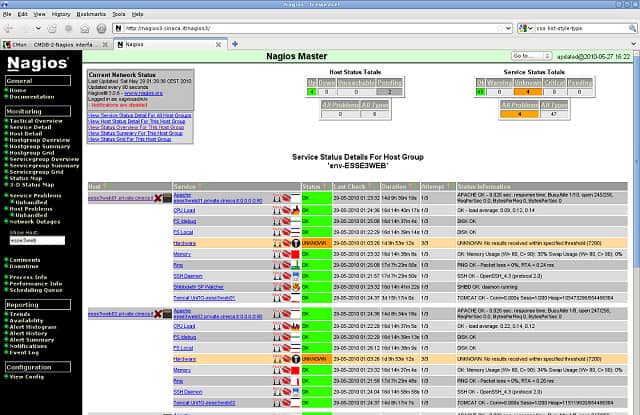
Nagios Core lacks auto-discovery, and you must learn to set up and maintain complex configurations. On the plus side, it does give you a lot of flexibility to customize and extend the tool. Community-developed addons can perform discovery and help you get started with configuration.
You can use the free 60-day trial to evaluate the for-cost version. If you elect to go with the free version when the trial is done, you can save the auto-generated config files from /usr/local/nagios/etc before uninstalling your eval copy. You can then use those files as your starting point for your new installation’s configuration.
The commercial version Nagios XI has a richer range of features, including automated support for discovering your devices and hosts, automatically configuring the tool, and commercially-supported addons. It has a much more sophisticated user interface and more advanced reporting that covers trends, capacity planning assistance, etc.
Nagios XI is built to run on Red Hat Linux and CentOS. For Windows, use a VM appliance with Hyper-V or VMware. It includes an auto-discovery tool and a configuration wizard for adding a new device, host, or application.
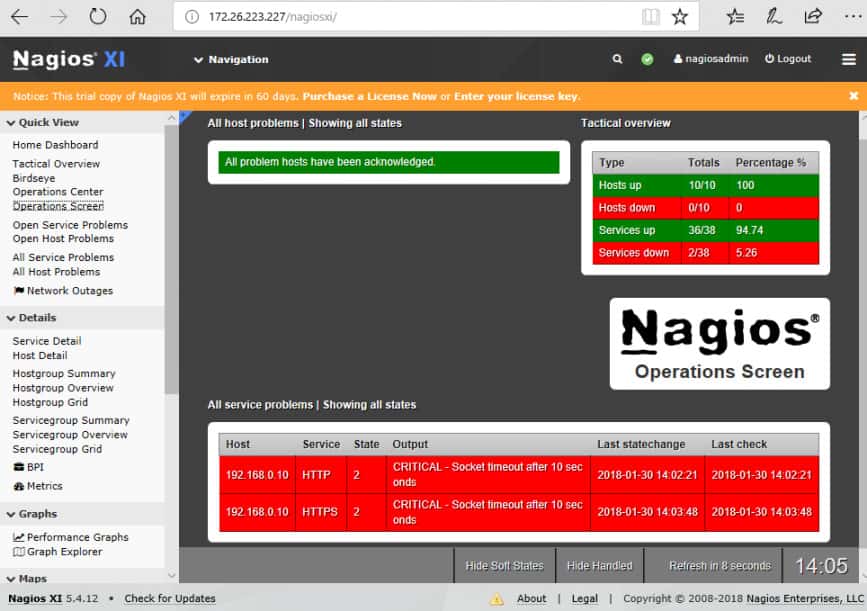
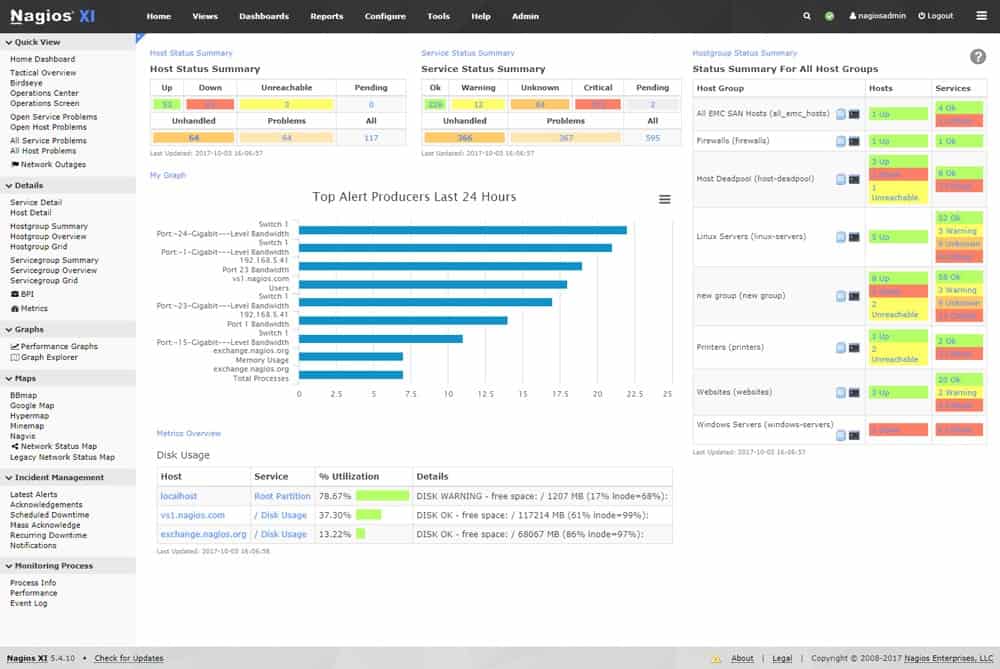
Once Nagios XI is installed and monitoring, the Operations Screen gives you a high-level view of the current state of the network, and the Operations Center lets you drill down to the items mentioned.
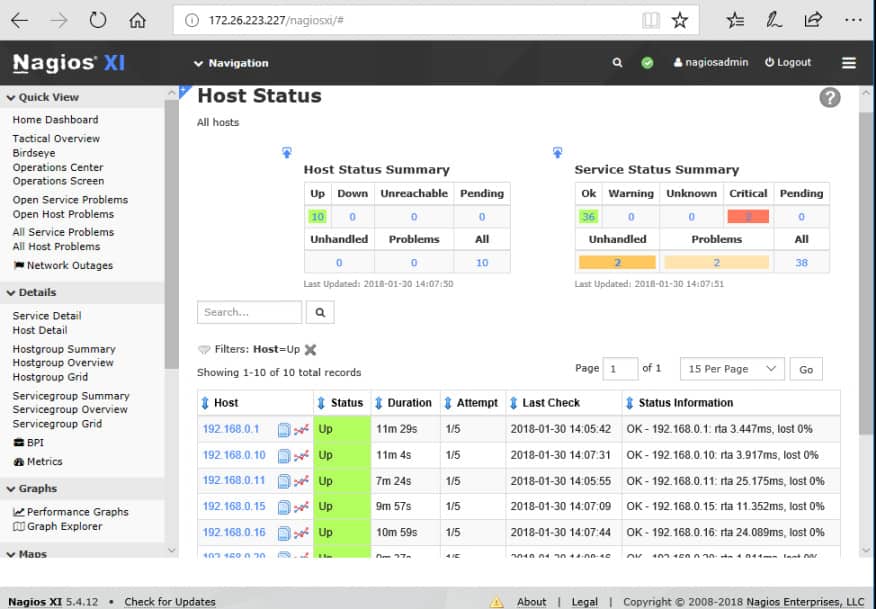
The Host Status page shows a summary of metrics for the monitored hosts. You can drill down to an individual host to see details including performance graphs, capacity planning info, alarms, etc.
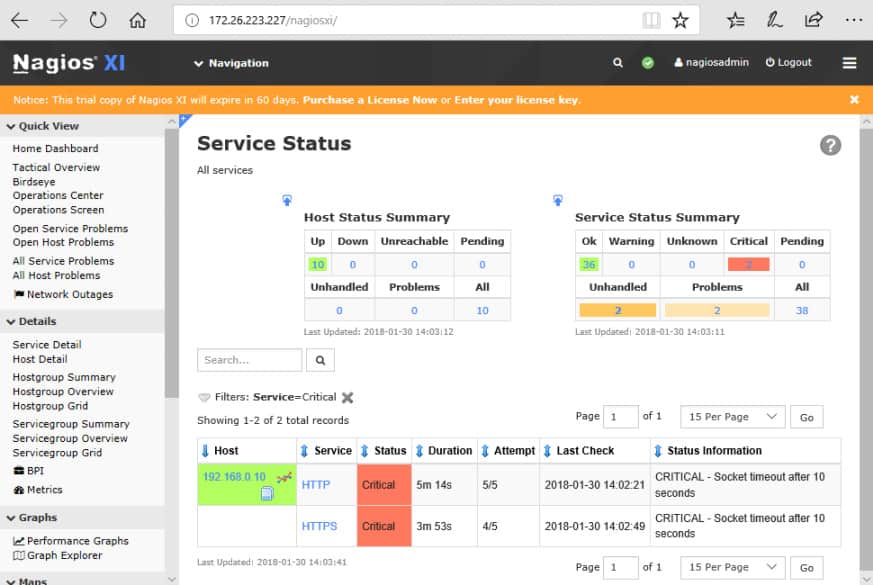
The Service Status page summarizes the state of the monitored services.
Who is it recommended for?
Small businesses with no money to spend will be attracted by Nagios Core. however, remember that you need to connect it to a third-party front-end package and that process requires technical skills. The removal of traffic analysis functions from both these system means that you are reliant on SNMP for network analysis. Nagios is written for Linux but you can run it on Windows over a virtualization or with Docker.
Pros:
- Cost-Effective Options: The availability of a free version makes it accessible to organizations with limited budgets.
- Flexible Pricing Structure: Pricing based on the number of flow exports, allowing scalability.
- Comprehensive Reports and Alerts: Provides detailed data analysis and timely notifications for network issues.
Cons:
- Configuration Complexity: Setup and customization can be challenging, especially for beginners.
- Less Intuitive Interface: The user interface may be less straightforward compared to other monitoring tools.
Nagios is a well-regarded solution for network monitoring. As with other tools that offer a fully-free vs commercial version tradeoff, you must decide whether you have (or will develop) the expertise and time to use the free tool, or whether it would be more cost-effective to pay for the automation and support of the commercial version.
11. Kentik
Kentik Detect, in contrast to the traffic analyzer tools above, is a pure Software-as-a-Service (SaaS) system. As such, it offers the scalability of the cloud.
Networks are growing, and off-premises network resources are more vital to success. Thus, traffic data is becoming big data, and cloud-based big data solutions start to make sense.
Kentik aims to capture the details of multiple types of data, provide a unified view of all of it, and provide interfaces for accessing the data and integrating with other systems. Kentik Detect is composed of a custom high-availability time-series datastore (Kentik Data Engine) and a UI (Kentik Portal). Protocols include Netflow, IPFIX, sFlow, SNMP, and BGP.
Key Features:
- Cloud-Based Solution: SaaS platform offers scalability and ease of management.
- Support for Multiple Protocols: Accommodates NetFlow, sFlow, IPFIX, SNMP, and BGP for comprehensive monitoring.
- Advanced Data Exploration: Features a robust data explorer for in-depth network analysis.
Why do we recommend it?
Kentik is a cloud platform of services that gathers network and platform statistics and also performs tests to add to the research that is used for analysis. The platform hosts a suite of modules and the exact capabilities that you get depend on the plan that you choose. Network analysis functions are implemented by the Core module, which deploys NetFlow, IPFIX, and sFlow to query network devices. It also uses SNMP to identify performance issues. The Edge module checks on external traffic with the Border Gateway Protocol, and the Cloud unit assesses cloud platform performance, utilization, and value for money. The Protect module looks for DDoS attacks, and the Protect Advanced unit looks for threats, such as intruders or bot activity. You can also get a benchmarking service to test your service provider with a module called Service Provider Analytics.
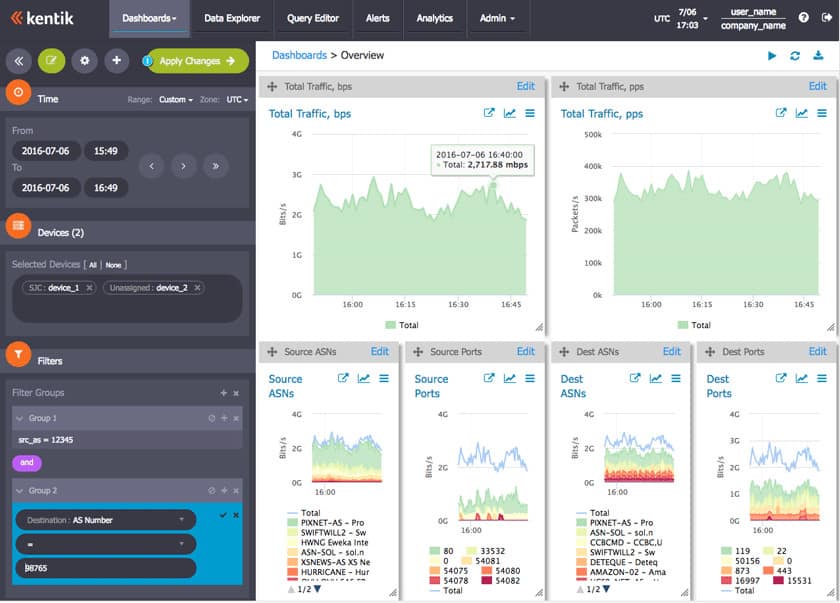
Kentik Portal is a web-based interface (of course) and provides a growing range of configurable dashboards.
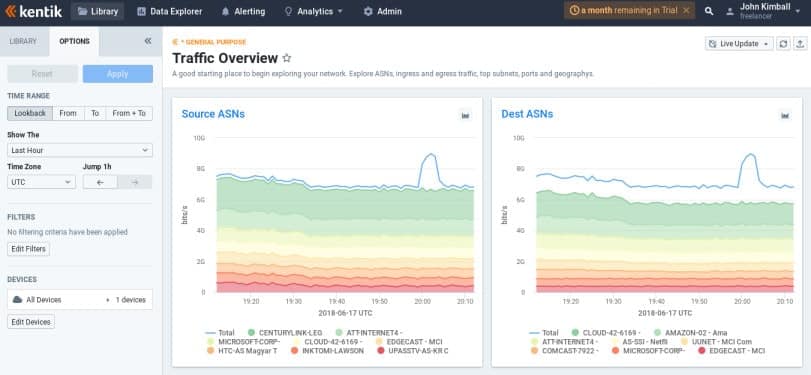
The Data Explorer permits ad-hoc exploration of the collected network data. You can quickly drill down and filter on potentially billions of records, obtaining views in the form of tables and graphs.
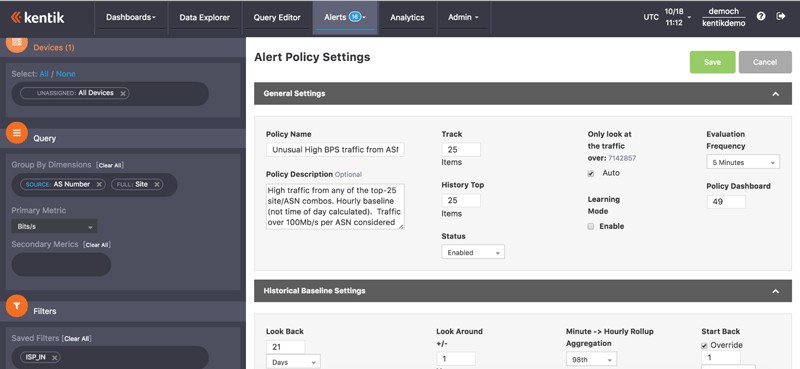
Alerting to notify you of unusual conditions can be set up by creating policies that define when an alert will enter the alarm state. Alerts can be sent by various media, including email, Slack, paging, etc.
Who is it recommended for?
Kentik is much more than a traffic analyzer and it is considerably more expensive than the other tools on this list. Consequently, this is not a good choice for small businesses and even mid-sized companies would need to examine the functionality of the Kentik system against the services offered by the other tools in this review. Kentik is a good choice for large businesses that run multiple sites and use cloud services as well as applications that are hosted on site and delivered by their local networks
Pros:
- Efficient Data Representation: Combines real-time reporting with simple graphics for clear NetFlow metric display.
- Intuitive Filtering: User-friendly filters aid in quick access to historical data.
- Wide Protocol Support: Adapts to various NetFlow protocols, enhancing its utility in diverse network environments.
Cons:
- SaaS-Only Availability: Limits options for organizations preferring on-premises solutions.
- User Interface Complexity: The Kentik Portal interface could be more user-friendly for enhanced ease of use.
Roll Your Own NetFlow Αnalyzer
Perhaps none of the above pre-packaged NetFlow analyzers are customizable enough or powerful enough to meet your needs. Maybe you’re sure you can do better, or you just want to experiment with analyzing the data yourself. There are multiple packages for time-series data capture and analytics available that make this quite doable. Several are free open-source software; some are not. Some can be integrated with prepackaged analyzers, such as Plixer and ntopng.
Here are a few possibilities to check out.
Splunk
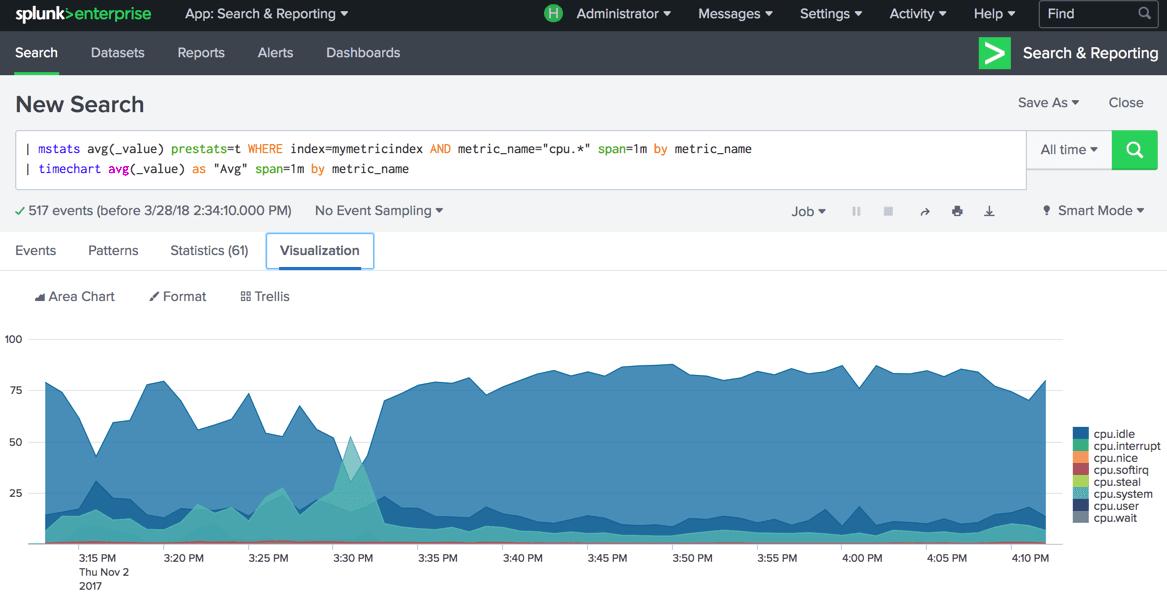
Splunk is a for-cost package for searching, monitoring, and analyzing/visualizing big data. Splunk captures real-time data and provides web-based facilities for analyzing and visualization. Splunk has an add-on for NetFlow, and one for IPFIX.
Key Features:
- Flexible data processor
- NetFlow and IPFIX feeds
- Build your own analyzer
Why do we recommend it?
Splunk is a very widely-used data analyzer. It is a flexible tool and isn’t purely intended for network traffic analysis. The capabilities of this system depend on what data you feed into it and what searches you perform on it. This is a do-it-yourself option and you need to dedicate a lot of time to setting up a network traffic analyzer with it. However, if you master this system, you can create applications to monitor sales data, product costs and profitability, and all sorts of analytical tools that will make you popular all over the organization.
Who is it recommended for?
Splunk is a great tool for specialist developers who have learned how to create monitoring systems on top of the analysis platform. It is available in an on-premises version, called Splunk Enterprise and as a SaaS version, called Splunk Cloud. Splunk produces a series of off-the-peg analysis packages and there is a system available called Splunk Observability, which monitors IT infrastructure. However, these systems still need to be set up and if you don’t know how to collect NetFlow data and connect it through to the Splunk platform, you won’t get any traffic analysis out of the package.
The ELK / Elastic Stack
The ELK Stack – Elasticsearch, Logstash, and Kibana – is an open-source analytics toolset typically used with data that resembles log messages. Elasticsearch is a popular distributed search and analytics engine. Logstash is a data collection and log-parsing engine. Kibana is a browser-based data visualization dashboard for analytics and search. Logstash includes a codec for processing multiple versions of NetFlow data.
Key Features:
- Free version
- A suite of data collectors and analyzers
- No pre-written searches
Why do we recommend it?
ELK / Elastic Stack is a very powerful suite of tools and it is a little like SPlunk in that you can use it to collect and analyze any data series. This system is a little easier to use than Splunk because its modules enable you to concentrate on specific tasks in isolation without needing to worry about the big picture. For example, you can focus on getting Logstash set up to collect traffic data from NetFlow and then set up analysis functions in Elasticsearch later. When you get to Kibaba, you can create charts from the output of an Elasticsearch analysis and create great screens and reports.
Who is it recommended for?
ELK is very hot right now and everyone wants to use it, so an aspiring network specialist would get a big career boost by taking the time to get educated in how to use the suite. There are a number of third-party providers that offer a hosted ELK and many of them have created their own monitoring and management systems that you can subscribe to if you don’t have the time to learn how to construct your own applications. The elements of the ELK suite are free to use if you download them to host them yourself.
Several groups have used the ELK Stack with NetFlow. Cisco has a guide for doing it, and there are several other articles online. People have built systems using the ELK Stack with other popular components, such as the Riemann distributed system monitoring and alerting tool. An alternative to logstash is fluentd.
Telegraf, Influxdb, Chronograf, Kapacitor
Influxdata‘s TICK Stack – Telegraf, Influxdb, Chronograf, and Kapacitor – is a set of Go-based open-source tools for capturing, monitoring, and analyzing/visualizing time-series metrics data. Telegraf collects performance metrics; InfluxDB is a time series database; Chronograf performs real-time visualization of InfluxDB data, and Kapacitor is a streaming/batch data-processing engine that can do monitoring and alerting of views of InfluxDB data. The TICK Stack has been used with network statistics from sFlow and SNMP.
Key Features:
- Data manager
- Can search sFlow data
- Free to use
Why do we recommend it?
The TICK Suite is a competitor to ELK but it hasn’t gathered the same large following of the Elastic Stack. The bundle is all provided by InfluxData, which copies Elastic’s strategy of offering the bundle for a fee but making each module available for free. The system can be threaded together into a network traffic monitoring service through the use of the TICKscript language. There is an enthusiastic user community that you can join to get tips and tricks and InfluxData hosts free training videos on its site.
Who is it recommended for?
The decision to create a custom network traffic monitor is either driven by a small business entrepreneur’s need to get a traffic analyzer for free or by a large organization’s desire to have a completely custom-built monitoring package. Either way, someone is going to have to spend a lot of time learning TICKscript and working out where to get source data and how to process it. From an individual technician’s point of view, it would be better to push the project manager towards using ELK instead, because that will give you a more marketable skill.
Another powerful tool, sometimes used with Influxdb is Grafana, an open-source package for time-series analytics and visualization. Grafana is analogous to Kibana, but where Kibana is log-message oriented, Grafana is metrics-oriented.
Choosing a NetFlow Analyzer or Collector
Multiple excellent tools for network monitoring and traffic analysis are available. Small organizations have an array of free choices, and large or growing organizations have many for-cost options.
In recent years, open-source solutions have become widely implemented for many types of networking software and also for business and network security applications. A benefit of open-source projects is that anyone can read the code that drives the software. By that inquiry, you can be sure that there is no malicious code hidden inside the program.
Usually, open-source projects are maintained by volunteers. The benefit of enthusiast-developed software is that it can be given away for free. The downside of this setup is that the free tools aren’t professionally managed and can contain bugs. The lack of income of free software means that the organizations that maintain it don’t have the funds to keep up with security standards or fix problems with the code.
When you consider using open-source software for network monitoring and analysis, check out the packages that interest you and test them thoroughly before you commit the network to it. Consider paying for network analysis tools in order to get guaranteed performance and also support from the commercial organizations that provide that paid software.
Anyone who wants to contribute the effort to learn has a toolbox of powerful components that you can use to roll your own solution. Your final choice depends on the size and complexity of your network, the expertise you bring (or want to develop), and how you expect your network to evolve in the future.
Netflow Collector & Analyzer Tools FAQs
What is the difference between SNMP and NetFlow?
The Simple Network Management Protocol (SNMP) and NetFlow are two standards for querying network equipment.
SNMP is more usually used to check on the performance of network equipment, while NetFlow enables the gathering of information about the network traffic that passes through the device.
What is the best ntopng alternative?
The free ntopng is a packet capture tool that enables header data to be sorted and grouped in order to gain statistics on network traffic. Wireshark is a good alternative that is free to use and has basic packet sorting and header analysis capabilities in its data viewer.
How do I change the MySQL port in NetFlow Analyzer from 13310?
NetFlow Analyzer is a tool provided by ManageEngine. In order to change the MySQL port used by the tool from 13310 to another port, you need to edit the mysql-ds.xml file, which is found in the /server/default/deploy directory. Look for the line jdbc:mysql://localhost:13310/netflow and change that 13310 to the number of the port that you want to use.
I wish Scrutinizer from Plixer had made your list. It is free for unlimited exporters and supports every vendor’s unique export. Maybe next time.