
sFlow (sampled flow) is a network monitoring protocol used to analyze traffic patterns on high-speed networks. Instead of capturing every packet, it samples traffic at intervals, reducing overhead while still providing useful insights. This approach allows administrators to monitor network activity in real time, helping with troubleshooting, security monitoring, and capacity planning without generating large volumes of data.
Here’s our list of the best sFlow collectors and analyzers:
- Site24x7 sFlow Traffic Monitoring EDITOR’S CHOICE Cloud-based system monitoring tool that includes sFlow communication capabilities.
- ManageEngine NetFlow Analyzer (FREE TRIAL) A lightweight sFlow-based traffic monitoring with multi-vendor support and L2–L7 visibility. Start a 30-day free trial.
- Paessler PRTG Network Monitor (FREE TRIAL) A traffic analysis tool that is part of a much wider network monitoring system. Runs on Windows Server. Download a 30-day free trial.
- Noction Flow Analyzer This is an on-premises package that implements network monitoring both for device performance and for bandwidth utilization. The system uses sFlow in its traffic monitoring processes. Runs on Linux.
- inMon sFlowTrend – In free and paid versions, this network monitoring tools is produced by the creators of the sFlow standard.
- ntopng and nProbe Two network traffic analysis tools that use both NetFlow and sFlow standards.
- Plixer Scrutinizer A traffic flow analyzer that focuses on security issues. Available for online access or on-premises installation.
The History of sFlow
sFlow was developed in the late 1990s as a way to monitor traffic on high-speed networks without the overhead of full packet capture. It was created by InMon Corporation, founded in 1999, with the goal of providing a scalable alternative to traditional monitoring approaches like NetFlow.
Due to its lightweight design and efficiency, sFlow was quickly adopted across the networking industry. It is now widely supported by network hardware vendors and is used to monitor traffic across a range of devices, including routers, switches, and virtual environments.
Relevant RFCs
Like many open networking standards, sFlow is formally defined through the Internet Engineering Task Force (IETF) using the RFC (Request for Comments) format. The protocol specification is outlined in RFC 3176:
- RFC 3176: Published in 2001, this document defines how sFlow operates, including its data format, sampling method, and how collected traffic data is sent to analysis systems. It established the technical foundation for sFlow’s adoption in network monitoring.
Overall, sFlow provides a scalable and efficient way to monitor and analyse network performance across a variety of environments.
Using sFlow for network traffic monitoring
When your organization’s network is behaving strangely, how do you know what’s going on inside it? If you have just a few segments connected by a handful of switches or routers – like a simple small-office/home-office (SOHO) network – you might be fine with basic network monitoring tools, such as the simpler ones from among our lists of the best packet sniffers and network analyzers and best free bandwidth monitoring software. When your organization relies on and develops a complex high-performance network, you need more powerful help.
How is sFlow different to NetFlow?
The sFlow network messaging standard is managed and developed by an independent not-for-profit organization that is overseen by a number of network equipment and software producers. The ethos behind this administration aims to break the dominance of one network equipment supplier and create a universal standard — NetFlow is owned by Cisco Systems. The sFlow messaging system is similar to NetFlow in that it creates a format for notifications that are generated by networking equipment and can be picked up by monitoring software.
Why use an sFlow tool?
When you’re responsible for keeping the network up and performing well, it can’t be a black box to you. You need visibility. If your network is growing larger or more complex, you may need network monitoring and traffic analysis tools. Monitoring and analysis tools assist you with diagnosing and troubleshooting problems. They give you early warnings of problems and provide the visibility and historical insight you need for network planning. Business-grade network devices, as well as many host operating systems, have built-in network monitoring facilities that gather key metrics for you and forward them to analysis tools. The most common protocols for this are NetFlow and sFlow. We look at the best free NetFlow analyzers and collectors in another post. In this post, we will look at the best free sFlow collectors and analyzers. Related: NetFlow – Ultimate Guide to NetFlow and NetFlow Analyzers
What does an sFlow analyzer do?
The monitoring component of sFlow focuses on sampling network packets rather than collecting all passing traffic for a period. The logic behind this strategy is that any excessive traffic will be just as visible at regular intervals as it is in a continuous copy of network traffic. The administrator selects the sampling frequency. If one application is generating 50 percent of all network traffic, that statistic will still be derived if you only pick up every tenth or every hundredth packet. The data collected by sFlow takes up less storage, uses less memory, and is quicker to sort through than the data dumps used for NetFlow. The sFlow technique is preferable for high-speed networks. As well as copying truncated versions of packets traveling on the network, an sFlow analyzer collects counters and statistical data generated by network equipment.
sFlow Types and Extensions
sFlow v5 adds the ability to export host and application related data along with the packet prefixes and counters. All extensions depend on having hardware that supports them, the correct system software, and analyzer consoles that will work with them.
The best sFlow collectors and analyzers
Our methodology for selecting sFlow analyzers
We reviewed the market for sFlow collectors that analyze network traffic and assessed the options based on the following criteria:
- An sFlow collector that is easy to set up
- Options to change the sampling rate
- A setting to specify the data retention period
- Interpretation of sFlow data by attributes, such as IP address or protocol
- A data analyzer for manual searches and sorting
- A free trial or a demo version that provides an opportunity to try before you buy
- Value for money from an sFlow analyzer that is packaged in with traffic shaping systems so that you can address the problems that analysis discovers
1. Site24x7 sFlow Traffic Monitoring (FREE TRIAL)

Site24x7 is a system monitoring service that is based in the cloud. Although this is a SaaS system, it is not limited to monitoring cloud resources. With the installation of an agent, the Site24x7 system can monitor any network anywhere.
Key Features:
- Automated sFlow analysis
- Also NetFlow, J-Flow, IPFIX, NetStream, AppFlow, and CFlow
- Spots bottlenecks
- Full stack monitoring
Why do we recommend it?
Site24x7 sFlow Traffic Monitoring is a cloud-based service that is packaged together with other network monitoring capabilities and sFlow is not the only network statistical analysis protocol that the service can use. You also get server and application monitoring in with your subscription for network monitoring.
One of the tools that is included in all of the Site24x7 packages is its sFlow Traffic Monitoring service. The monitor samples traffic data from network switches and shows the information that it reaps live in the dashboard for the service.
The sFlow system is an independent protocol and is not proprietary to any manufacturer of network devices. The network traffic monitoring service in Site24x7 is able to communicate with the devices produced by more than 200 vendors. As well as using sFlow, the Site24x7 system can communicate with NetFlow, J-Flow, IPFIX, NetStream, AppFlow, and CFlow. It is capable of handling multi-vendor sites and can also integrate the monitoring of multiple sites in one location. The tool can blend the monitoring of on-premises and cloud resources as well.

The traffic monitor presents overall traffic statistics for a network and is able to examine each link’s throughput. It can segment traffic data by application and by source and destination. It also has the ability to isolate a conversation, detailing all of the communications that occur between two devices by address.
Time-series traffic graphs show peaks and troughs in network demand and highlight periods of each day where the network regularly comes under strain.
The system allows network managers to set performance thresholds. When these levels are crossed, the service will generate alerts. These warnings can also be sent out to technicians as emails, SMS texts, or voice calls. That mechanism allows the operation team to leave regular monitoring to Site24x7 because they can be sure that they will be drawn back to the system console if problems arise.

Who is it recommended for?
The Site24x7 platform is a good choice for small businesses. All of the subscription plans include network traffic analysis service alongside network performance monitoring, server, application, and cloud monitoring. The packages are priced to be accessible to SMBs and larger organizations pay a supplement to get extra capacity.
Pros:
- Has one of the best user interfaces among similar NetFlow analyzers
- Features a mobile app for both Android and iOS
- Can measure can detect latency, jitter, and performance over time, making it a viable long-term solution for ping monitoring
- Can integrate and monitor up to 200 different vendor devices
- The free version can support up to hosts, making it a great introductory option for smaller businesses
Cons:
- Site24x7 is a feature dense platform that can take time to fully learn all of its features and customization options
Site24x7 offers monitoring packages and all of them include sFlow monitoring. Those plans are Website Monitoring, Infrastructure, the Application Performance Monitor, and an All-in-One plan. There is also a multi-tenanted version for managed service providers, called MSP. You can get any of these bundles on a 30-day free trial.
EDITOR'S CHOICE
Site24x7 is our top pick for an sFlow analyzer because this cloud-based service is part of a package of full-stack observability tools. The package also includes collectors for NetFlow, IPFIX, J-Flow, CFlow, NetStream, and AppFlow, so you can monitor a multi-vendor network with this package. That range of capabilities is important because not every business limits its purchasing policy to one supplier. Site24x7 sells subscription packages that include server and network device status monitoring as well as traffic analysis. You also get a configuration manager and a log manager with this system and you can monitor Web applications with the bundle as well. The plans for Site24x7 are sized and priced to be accessible to small businesses but they can expand to work for larger organizations with capacity extension packs. This system can monitor multiple sites in one console and the platform also provides a multi-tenant version for managed service providers.
Download: Get a 30-day free trial
OS: Cloud based
2. ManageEngine NetFlow Analyzer (FREE TRIAL)

ManageEngine SFlow Analyzer is a specialized module within the NetFlow Analyzer platform. It is originally designed to process sampled flow data from sFlow-capable devices. Unlike NetFlow, which records every flow, sFlow uses packet sampling, so it is lightweight and suitable for high-speed or resource-constrained environments.
Key Features:
- One-click sFlow export from supported devices
- Real-time monitoring of apps, IPs, and conversations
- Supports Cisco, HP, Huawei, FortiGate, Dell, and more
- L2–L7 visibility from packet header capture
Why do we recommend it?
We recommend ManageEngine NetFlow Analyzer because it delivers lightweight and high-speed visibility. It does not have the overhead of full-flow collection. During our active testing in a mixed-vendor environment (Cisco and FortiGate), the tool consistently processed sFlow exports in real time (without straining CPU or memory). This is critical for enterprises where full NetFlow collection would be resource-intensive.

What impressed us most was the depth of reporting despite the sampling method. Even though sFlow captures only packet samples, the Analyzer reconstructs meaningful traffic baselines. This makes it easy to detect anomalies like sudden application surges or misconfigured QoS policies. In practice, we found it great for identifying “top talkers” during peak office hours. If we were to compare it to cloud-native competitors, ManageEngine’s module requires more setup. But, on the flip side, it rewards you with granular customization. So, you can create great reports filtered by user, application, or business hours.
In short, SFlow Analyzer is more than a “lighter” NetFlow substitute—it’s a scalable, forensic-friendly watchdog for any multi-vendor environment.
Who is it recommended for?
We recommend ManageEngine NetFlow Analyzer to smaller businesses because of its low resource use. Larger enterprises, on the other hand, can gain scalable, centralized capabilities within the ManageEngine ecosystem.
Pros:
- Flow-based methods minimize overhead and avoid device strain
- Works across Cisco, Juniper, Fortinet, Huawei, Dell, and more
- Strong L2–L7 visibility for detailed traffic analysis and anomaly detection
- Flexible reporting engine with scheduled and on-demand options
Cons:
- UI is functional but could use modernization
You can get started with ManageEngine NetFlow Analyzer on a 30-day free trial.
3. Paessler PRTG Network Monitor (FREE TRIAL)
The Paessler PRTG Network Monitor is a “batteries included” solution that monitors network traffic, bandwidth utilization, the availability and health of devices on your network, and more. The free version provides unlimited sensors for a month, and thereafter is limited to 100 sensors; a sensor is an individual data stream, so each device on your network will typically require several sensors.
Key Features:
- Automated and manual sFlow analysis utilities
- Can also collect NetFlow, IPFIX, and J-Flow
- Support customized graph creation
Why do we recommend it?
Paessler PRTG Network Monitor is a full stack observability package and not just for networks. The system includes a range network device query languages, which includes sFlow, NetFlow, and J-Flow. This package is adaptable and you only activate the parts of the monitoring bundle that you need.
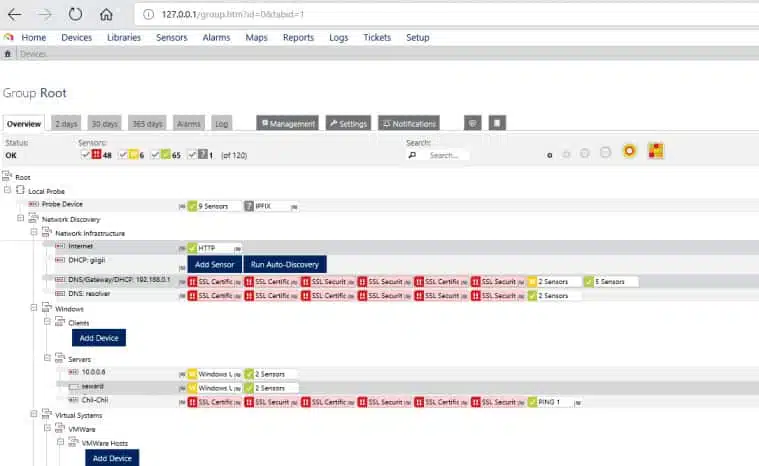
In PRTG’s user interface, a primary view is the device tree showing all devices and the sensors monitoring each. Devices include firewalls, routers, access points, servers, workstations, virtual servers, storage, etc. The device tree is supplemented by table views of sensors, logs, and alarms, as well as various charts and graphs for bandwidth, etc. Tables can be sorted and filtered. Drilling down through the tree view reveals indicators and metrics at every level. Alerts can be set at every level, so you can arrange to be notified about events and threshold transitions of a particular critical device, or rolled up from an overall aspect of your network. Alerts can be transmitted in multiple ways, including SMTP email and SMS text messaging. 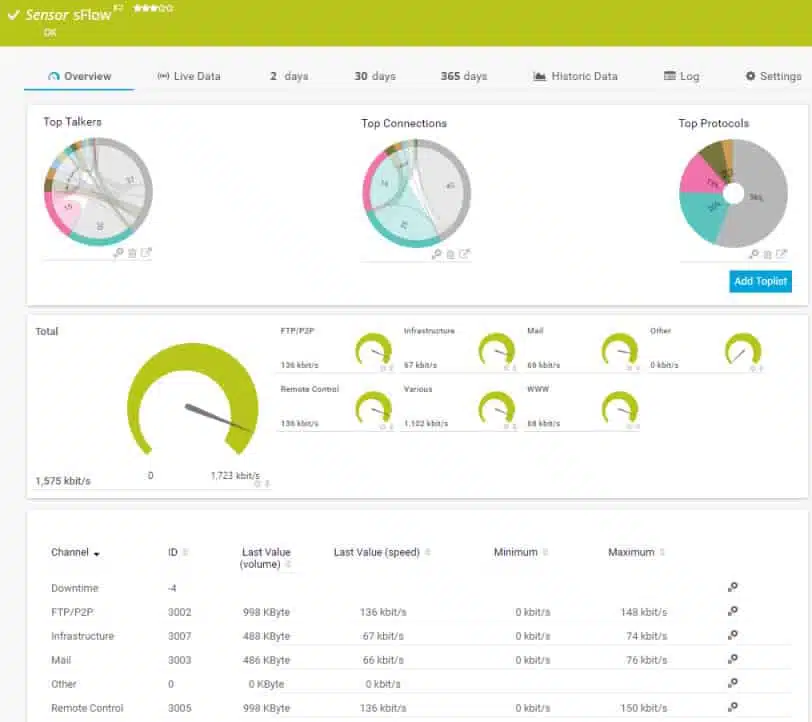
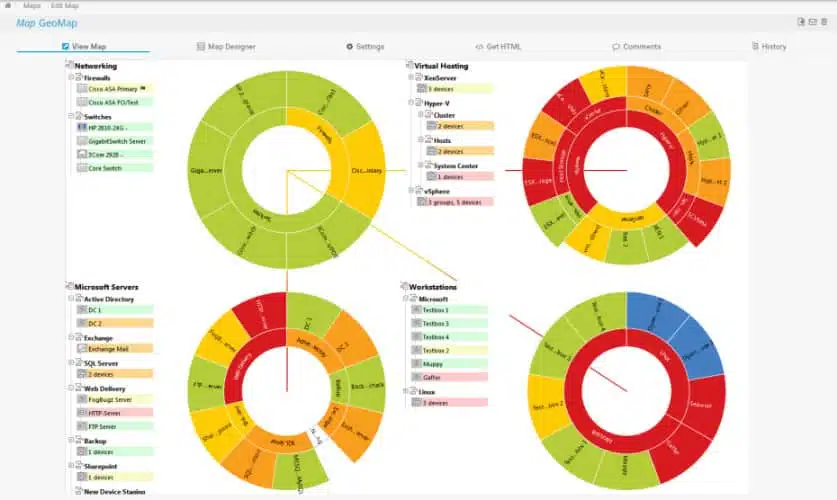
The devices-and-sensors abstraction shapes the dashboards and reports too. Custom dashboards can be created, including interactive maps. There is a range of predefined reports, and facilities for designing custom reports; reports can also be scheduled. Installation is straightforward. There is a setup wizard, as well as a video providing step-by-step guidance.
Who is it recommended for?
The PRTG system is suitable for businesses of all sizes. The buyer pays for an allowance of sensors and then decides which of the monitoring tools to activate. If you only turn on 100, you don’t have to pay. The system can assist with protocol analysis and traffic shaping measures.
Pros:
- Designed to be an infrastructure monitoring tool that supports multiple sensors types such as NetFlow, sFlow, and J-Flow
- Offers additional monitoring on the same platform, supporting infrastructure, network, and application performance monitoring
- Captures packet headers only, helps speed up analysis and keep storage costs down for long term collection
- Uses simple yet intuitive graphing for traffic visualization
Cons:
- Very detailed platform, takes time to learn and fully utilize all of the features available
At installation, the core server’s local probe does auto-discovery to identify devices and set up sensors. Though PRTG is all-in-one so you don’t need multiple products and licenses to gain comprehensive monitoring, a key question to evaluate is how many sensors your network needs, and what will be the long-term cost of the sensor-based licensing model as you grow. You can download 30-day free trial.
4. Noction Flow Analyzer

Noction Flow Analyzer is a network traffic monitoring and planning package that is delivered as software for installation on premises.
Key Features:
- Analyzes sFlow records for capacity planning
- Can also collect NetFlow, IPFIX, J-Flow, and NetStream
- Traffic stress alerts
Why do we recommend it?
Noction Flow Analyzer combines network performance monitoring with traffic analysis. The tool is able to communicate with network devices using the sFlow protocol, NetFlow, and others. Features include protocol analysis and traffic volumes by source or destination. The system also provides root cause analysis for performance problems.
The system extracts traffic information from switches and routers through the use of the sFlow, IPFIX, NetFlow, J-Flow, and NetStream protocols. The package consolidates data drawn through these different protocols, converting records into a common format. The live monitoring system shows those records in text and graphical formats in the dashboard for the Flow Analyzer.
The traffic monitor also stores the data that it assembles and that information can be read back into the dashboard section of the console. This service allows for data periods to be selected and there are data query facilities, which allows analysis to be performed. This enables the user to project the future bandwidth capacity requirements of the network.
There is an alert system in NFA, which can notify you when the preset conditions are detected in your network traffic data. You can configure alerts based on different parameters of your network traffic: volume changes, frequency, specific traffic type existence, duration, baseline or a combination of such characteristics.

Alerts are shown in the dashboard and they are also forwarded to technicians by email or SMS.
The dashboard for the system is implemented as a website for the company intranet. The screens in the package can be customized by association presentation widgets with data stores. So, the layouts shown here are not the definitive system that you could be using – you can change it.
Who is it recommended for?
This is the most expensive network traffic monitoring solution on this list, so it won’t appeal to small businesses. A big advantage of the Noction plans is that they have no limit on the number of devices that can be monitored for a fixed price. This means that the package will particularly interest large businesses.
Pros:
- The system provides live network traffic monitoring
- A module in the package provides performance monitoring for network devices
- The service includes a network capacity planning module
- The system can communicate with sFlow, NetFlow, IPFIX, NetStream, and J-Flow
- The dashboard is delivered as a website and can be customized
Cons:
- There is no version for Windows Server
Noction Flow Analyzer can be installed on three distros of Linux: Ubuntu, CentOS, and RHEL. The system is charged for by subscription with a rate per month or per year. You can get a free trial of the monitoring system.
5. inMon sFlowTrend
sFlowTrend is a basic but capable network and server monitoring tool from inMon, the originators of sFlow. The free version of sFlowTrend accepts sFlow data from up to five switches/routers or hosts and maintains only one hour of history in RAM. The pro version does not limit the number of hosts and switches monitored, and stores history to disk. The tool is implemented in Java and provides a Java-based or web-based user interface. Online help gives you step-by-step instructions for configuring the tool.
Key Features:
- sFlow summaries and detail
- Customized alert thresholds
- Free version available
Why do we recommend it?
InMon sFlow Trend should be the definitive sFlow tool because InMon created the sFlow protocol. This is an on-premises system that runs on Windows, Linux, and macOS. The package draws up a network map and gathers traffic statistics that show which applications, users, or subnets are using up most bandwidth.
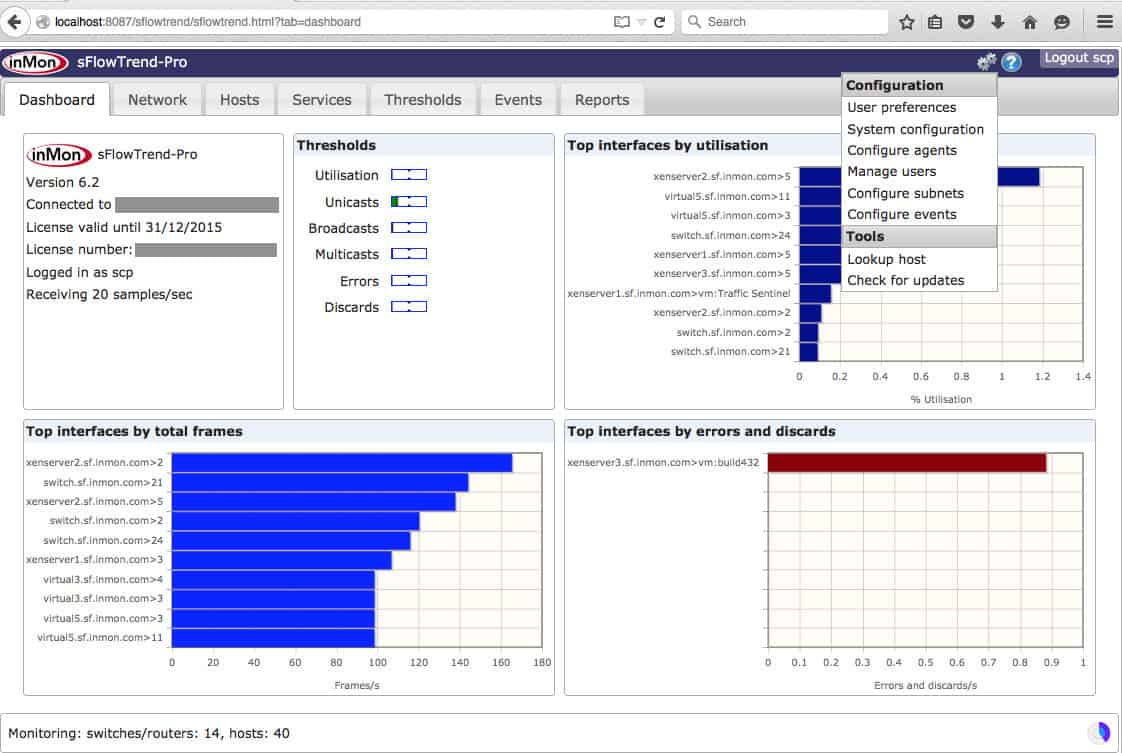
The Dashboard tab gives an overview of the current state of the monitored network and hosts, including top-level thresholds and interfaces with potential errors. On the Network tab, sflowTrend shows performance statistics as summaries and details of traffic at the network or device level. You can define Thresholds to receive alerts when abnormal levels of network traffic or errors occur. On the Network > Root cause tab you can explore the cause of a traffic anomaly such as a threshold violation. The Hosts tab provides tabular and graphical performance data on network, CPU, disk, etc, for servers – including virtual servers – that are exporting sFlow data. The Services tab provides performance metrics for applications (including various webservers) that export sFlow data.

The Events tab provides a log of events such as thresholds crossed or errors detected. The Reports tab provides access to canned reports, supports defining custom reports, and lets you run reports and view the results. sFlowTrend is a straightforward tool that offers a lot to smaller organizations whose network devices, hosts, and services are sFlow enabled.
Who is it recommended for?
This is a nice free tool that provides the perfect solution for small businesses. However, before installing it, it would be necessary to check that your network devices have sFlow capabilities – not all of them do. The system isn’t as sophisticated as the commercial packages from Solarwindsa and ManageEngine.
Pros:
- Offers a freemium version, great for small businesses
- Easy to configure threshold-based alerts
- Visuals are customizable and easy to read, good for NOC environments
Cons:
- Reporting is fairly limited
- Would like to see more alert integrations into other messaging platforms
6. ntopng and nProbe

The open-source network traffic analysis tool ntopng does passive network monitoring based on flow data and packet capture; it uses nProbe for collecting flow data from devices and hosts that export it. We’ve examined the capabilities of ntopng and nProbe for NetFlow monitoring and analysis before. They can also handle sFlow. ntopng’s web-based user interface rolls up data into network traffic (eg, top talkers), flows, hosts, devices, and interfaces. The flow display shows application protocols (eg Facebook, YouTube), and can list latencies and TCP statistics (eg packet loss). You can set alerts based on many criteria.
Key Features:
- Packet sniffer
- Post-collection NetFlow and sFlow analysis
- Technician tool
Why do we recommend it?
The nProbe part of this duo is where you will find sFlow data collection. You can get NetFlow data into ntopng but not sFlow. So, nProbe has a utility that converts sFlow data to a NetFlow format, and that makes it workable. That data processing function occurs on live data.
Who is it recommended for?
These two tools provide a respectable package and they will appeal to the network managers of small businesses. While ntopng has a free version, nProbe has a price tag. Larger organizations will probably need software support to comply with their business insurance requirements and that is available with the paid version of ntopng.
Pros:
- Open-source tool, highly customizable
- Supports multiple flow protocols
- A great option for Unix and MacOS
- Free options for education and non-profit organizations
Cons:
- Has a steep learning curve, especially for non-technical users
- Fully functional version is behind a paywall
nProbe can be test-driven for free but is limited to 25000 exported flows. You can get the less-restricted versions of ntopng and nProbe by buying licenses. Educational and nonprofit organizations can qualify for free licenses.
7. Plixer Scrutinizer
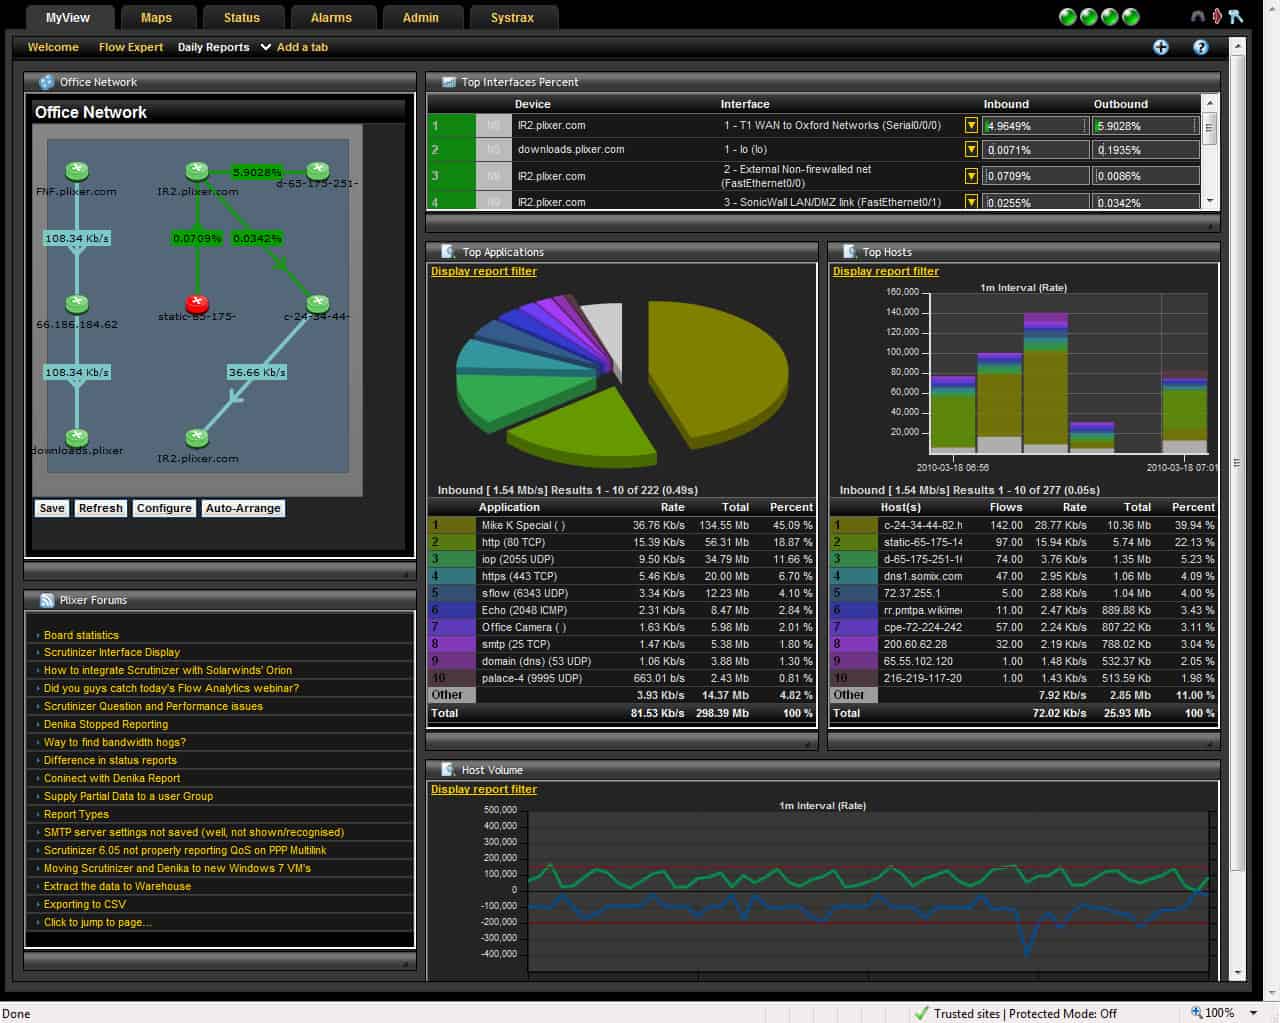
Plixer Scrutinizer (R) is a sophisticated flow-oriented network traffic analysis system with a particular focus on security forensics (it’s called the “Scrutinizer Incident Response System”). It supports both NetFlow and sFlow. Scrutinizer can be installed as a dedicated physical appliance, as a virtual machine running on a server, or as a SaaS solution running in the cloud (public or hybrid). It’s a sophisticated system, so even the free trial on a virtual machine demands considerable resources (eg, a dedicated 16GB of RAM).
Key Features:
- Network security analyzer
- Uses NetFlow and sFlow
- Physical or virtual appliance
Why do we recommend it?
Plixer Scrutinizer is a traffic analyzer but it has a lot of the features of automated network performance monitoring because it includes a discovery function and will create a network inventory for you. This is a high-end product that will provide a lot of data.
Who is it recommended for?
The free version of this tool is a good option for small businesses. Plizer attracts a wide market because it offers just about every deployment option that you could imagine. The service will give you a lot of detail on your traffic and you need to play around with the tool to work out how to get just specific metrics on your screen.
Pros:
- Offers multiple deployment options
- Designed to support large enterprise networks
- Offers additional security-related traffic analysis features
Cons:
- Uses a considerable amount of system resources
- Must reach out to sales for pricing
- Steeper learning curve than similar tools on the market
Scrutinizer is designed for high performance and scalability from small to very large environments. It provides a rich range of analysis and reporting features. The trial includes full access for 30 days. After that, the free version has a limit of 10K flows collected per second, five hours of raw flows kept, and one week of historical summaries maintained. The paid version includes notifications, dashboard customization, custom reports, scheduled email reports, and support. License pricing depends on the platform chosen and the number of flow exporters to be supported.
Conclusion
If your installed devices primarily support sFlow, there are multiple excellent tools for network monitoring and traffic analysis, including free options. As usual, your final choice depends on the size and complexity of your network, and how you expect it to evolve in the future.
