
When it comes to monitoring and managing the performance of network infrastructure, choosing the right tool is crucial for ensuring optimal system health and minimizing downtime. Two widely recognized solutions in this space are SolarWinds Network Performance Monitor (NPM) and Nagios XI. Both are designed to help IT teams monitor the performance of networks, servers, and applications, but they approach this task differently in terms of features, user experience, and customization options.
SolarWinds Network Performance Monitor (NPM) is a comprehensive, user-friendly network monitoring tool that provides in-depth visibility into network performance. It is well-known for its intuitive interface, ease of deployment, and out-of-the-box features, making it ideal for organizations looking for a straightforward, reliable solution. SolarWinds NPM offers real-time monitoring, network topology mapping, and automated alerts, all designed to streamline the detection of network issues and improve response times.
On the other hand, Nagios XI is an open-source network monitoring solution that is renowned for its flexibility and customization options. Nagios XI offers a wide range of plugins, allowing users to monitor nearly every aspect of their network and systems. Nagios XI can be a little complicated to set up and configure, it is highly regarded for its extensibility and detailed insights into network health. Nagios XI is often favored by organizations that need highly tailored monitoring solutions or those with more complex network infrastructures.
By understanding the strengths and limitations of SolarWinds NPM and Nagios XI, you can make a more informed decision on which tool best aligns with your organization’s network monitoring needs.
[/ctech_content_w_bk]
| Feature | SolarWinds Network Performance Monitor | Nagios XI |
|---|---|---|
| Network Monitoring | SNMP, ICMP, and WMI | SNMP, ICMP, and WMI |
| Autodiscovery | Yes (with SNMP) | Yes (with SNMP, ICMP, WMI and Telnet) |
| Dashboard Visualizations | Live graphs and charts | Live graphs and charts |
| Customizations | Customized OID with pollers | Plug-ins |
| Alerts | Email or SMS | Email or SMS |
| Reports | Built-in reports editor, pre-written report formats | Built-in reports editor, pre-written report formats |
| Vitualization Monitoring | Requires SolarWinds Virtualization Manager | Includes VMWare monitoeing, other platfroms added through plug-ins |
| Pricing | $2,975 | Standard Edition - $1,995, Enterprise Edition - $3,495 |
| OS Compatibility | Windows Server | RHEL, CentOS, Oracle Linux, Debian, Ubuntu |
Purchase Considerations
When purchasing a network performance monitor there are many different factors that need to be taken into account. These range from network monitoring techniques, to autodiscovery, alerts, and customizable dashboards right through to the price. However, the most important thing to take into account is the user interface. The user interface will be the lens through which you analyze your network.
Even a fully-featured network monitoring platform can be cumbersome and inefficient if the user interface makes the job difficult for the administrator using it. Luckily Nagios XI and Network Performance Monitor maintain high standards, but there are distinct differences between the two.
As a result, our head-to-head is based specifically on finding out which has the best user interface for monitoring. Whether this is allowing you to see the status of infrastructure from a glance or assessing the program from a mobile app, we’ve taken it into account in our analysis.
Features Overview
Before we start, we’ve included a brief overview of features to allow you to compare the two easily:
- Network Monitoring: In terms of network monitoring, both products support the use of SNMP, WMI and ICMP. This is a solid range of protocols to work with for monitoring a large network. As such, both programs can be considered appropriate for use within a large enterprise environment.
- Autodiscovery: SolarWinds has the edge when it comes to autodiscovering devices on your network. It is adept at using SNMP scans to ascertain which devices are up on your network and can even situate them on a topology map. This makes it much easier for administrators to find what they need in a live monitoring environment. While Nagios does allow the user to scan their devices, they have to choose specific IP ranges manually. Like Network Performance Monitor, Nagios XI can create its own network diagrams.
- Alerts and Notifications: Both SolarWinds and Nagios deliver an excellent standard of alerts and notifications. You can set predefined alert parameters on each platform and decide whether you receive notifications on key events via email or SMS.
- Dashboard Visualization and Customization: Both products deliver quality dashboards with plenty of visualizations and displays to help with network monitoring. The sleekness of SolarWinds’ design gives it the edge in this area.
- Reports: In terms of reporting, Network Performance Monitor and Nagios offer quality reporting features. Though Nagios XI’s graphs have a lot of depth, Network Performance Monitor’s are much cleaner.
- Virtualized Monitoring: SolarWinds’ Network Performance Monitor has the ability to monitor a variety of virtualized hypervisors, whereas Nagios XI is limited to VMware alone.
- Mobile Application: SolarWinds Network Performance Monitor has an app available for both IOS and Android. Nagios XI has no remote app at this time.
- Pricing: SolarWinds’ Network Performance Monitor and Nagios XI both carry substantial price tags. SolarWinds Network Performance Monitor carries a price tag of $2,975 (£2,245). The Standard Edition of Nagios XI can be purchased for $1,995 (£1,505) and the Enterprise version for $3,495 (£2,637).
Network Monitoring
Network Monitoring is an area of incredibly demanding requirements. A network monitor isn’t just responsible for providing you with an individual service but is tasked with helping to ensure the stability of your entire network. A network monitoring tool needs to have a wide range of tools in order to scan a network for vulnerabilities effectively. Missing or ignoring a simple issue can have disastrous implications in the form of downtime.
As a result, when weighing network monitoring tools it is important to cut straight to the core of the issue: how does a product go about monitoring a network? In this instance, SolarWinds’ Network Performance Monitor and Nagios XI both make use of SNMP, WMI, and ICMP to verify the integrity of devices across the network.
SNMP monitoring is where the program sends a ping to devices within a network and awaits a response. The program then assesses the health of the appliance based on its response time. This allows a network monitor to ensure that key services are online. Unusually long response times to an SNMP test indicate poor performance or system failure.
On Network Performance Monitor you can use data pulled from the network to build wireless heat maps. This helps you to view your network from a geographical perspective. With a heat map, you can see where your network connectivity is at its strongest and troubleshoot for dead zones. If your hardware is an area with poor connections, you can simply move it to improve your service or attempt to improve your entire network.
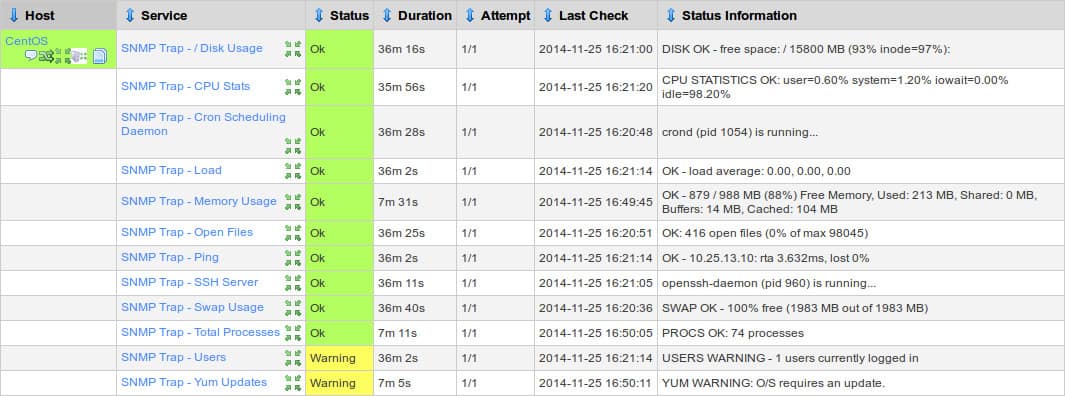
On the other hand, Nagios offers agentless monitoring with SNMP. You can send SNMP traps and monitor Windows Event Logs through the program. Once you’ve run an SNMP Trap all objects that are up and running will be denoted by the color green. Though this doesn’t have the same quality as Network Performance Monitor it is still good enough to function within an enterprise environment.
When it comes to network monitoring features SolarWinds Network Performance Monitor has a clear advantage. It has more tools available at its disposal and helps to troubleshoot far more performance issues than Nagios. NetFlow analysis, in particular, can be incredibly useful for helping to protect against downtime in the future.
Autodiscovery
One of the main challenges of onboarding a network monitoring solution is going through the process of configuring it with your network. Every piece of topology on your network needs to be accounted for and logged. Without an autodiscovery tool, you have to manually configure each device on your network. An autodiscovery tool allows you to automate this process. SolarWinds Network Performance Monitor automatically scans all the devices on your network and connects them, so they can be monitored.
This is very useful because it allows you to hit the ground running without having to configure an entire network’s worth of infrastructure from scratch. Autodiscovery also works to discover new devices once they are connected to an established network, making this an ideal solution for businesses looking to upscale their network infrastructure.
Nagios XI has its own answer to network discovery but is far from a complete autodiscovery solution. In order to configure devices on your network you need to specify IP ranges in order for it to scan. IP range scans enable the user to comb through their topology efficiently.
Dashboard Visualization and Customization
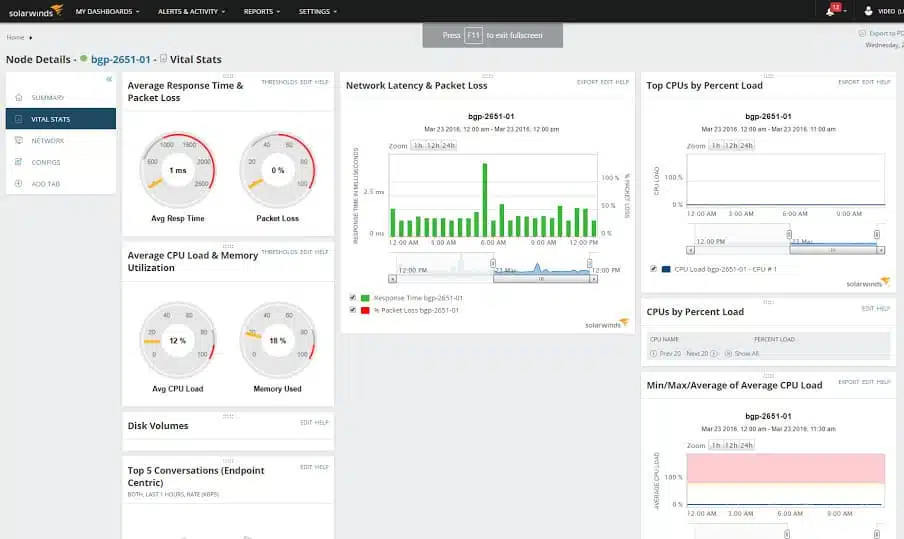
One of the most important parts of being able to monitor your network effectively is having a fully-featured dashboard that you’re able to customise. SolarWinds Network Performance Monitor allows you to customise your views with pie charts and graphs displaying your infrastructure health. For example, you can generate a ‘hardware health overview’ which color codes devices that have an up, critical and warning status.
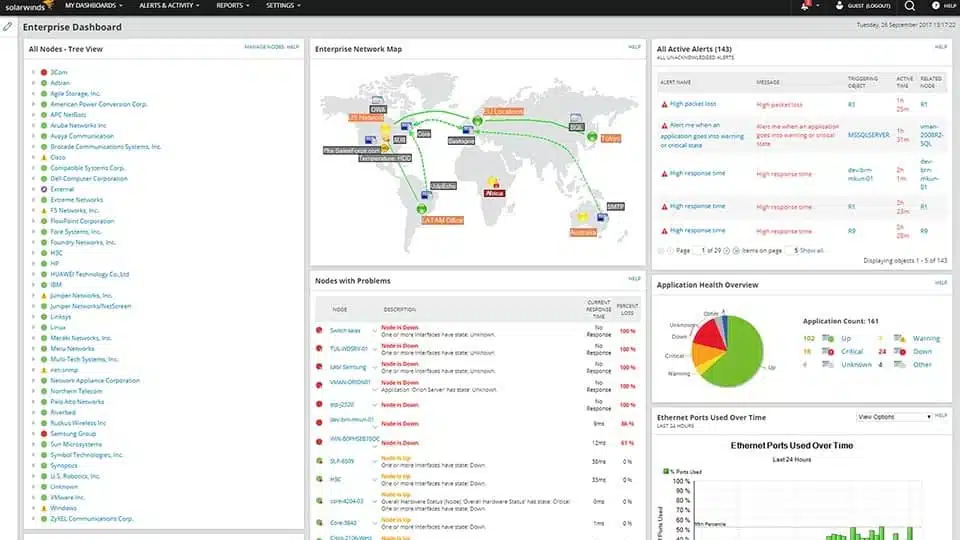
Nagios XI also has its own customizable web-based user interface. With this program, you can customize by user, so that each user has a unique view of the network. This is useful for seeing under the hood of your network and identifying system status. The dashboard displays a range of graphs, dials, and charts detailing the health of your infrastructure.
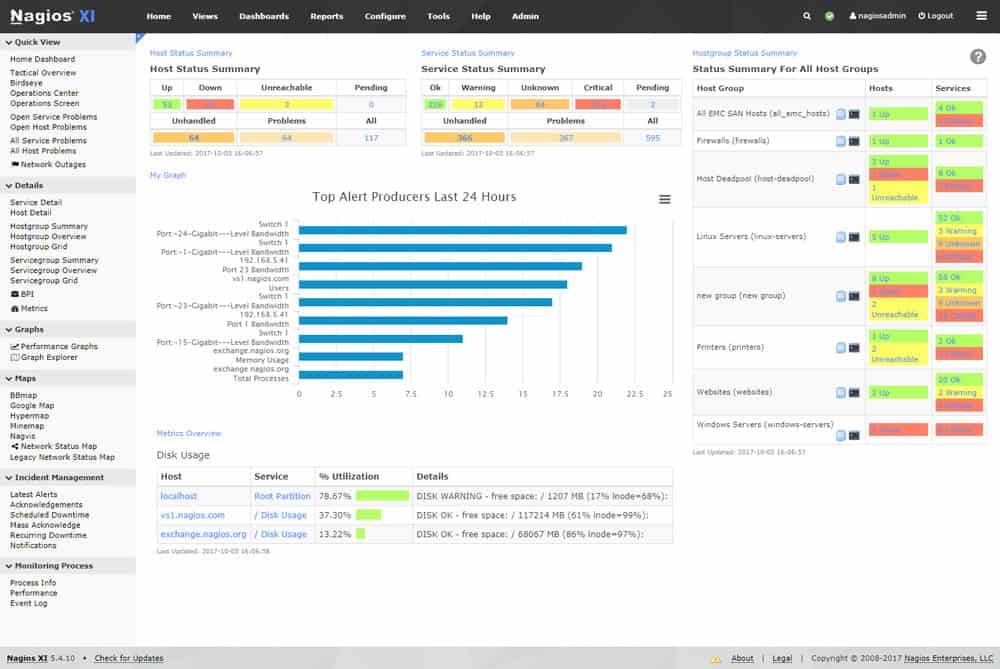
Like the Network Performance Monitor, the Nagios dashboard is color-coded. While it doesn’t have the same finesse and quality that SolarWinds user interface has, it is clear enough to give you a healthy-sized snapshot of your network. This is important to note because the visual displays will guide most of your monitoring activity. In most cases, the clarity of graphs and charts is more important than individual metrics themselves. After all, you only need a second to spot an emerging trend on a graph.
Alerts and Notifications
There is only so much network monitoring you can do manually. Even if you’re at your desk 24/7 there are going to be moments when your attention span dips. In these moments you can miss crucial network events that affect the status of your service. Alerts and notifications help to step in and draw your attention to problems in those moments when you are unavailable or distracted.
SolarWinds Network Performance Monitor has an excellent alerts system. You can configure specific trigger conditions and parameters where the software will notify you via email or SMS when a particular event occurs. There is also an alerts window within the user interface which details the status of all alerts, including the reason behind the alert, active time, and trigger time.
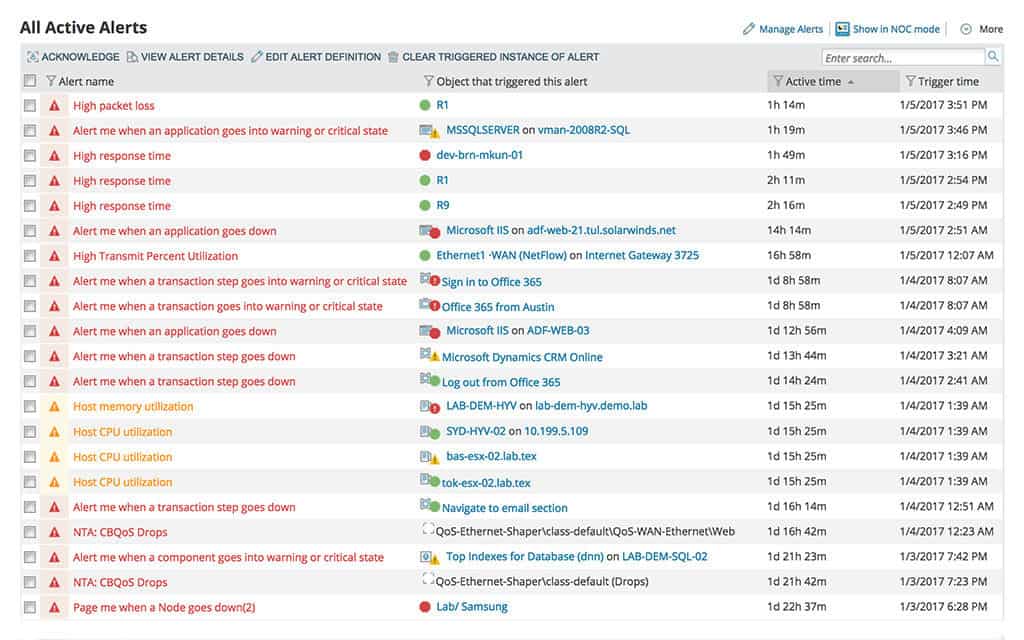
You can choose to receive notifications for a wide range of issues. For example, high packet loss, high response time, warning, or critical state. This ensures that you don’t miss anything. When monitoring a large network, simply keeping up is half of the battle. Taking your eye off the ball, if only for a moment, can have severe consequences.
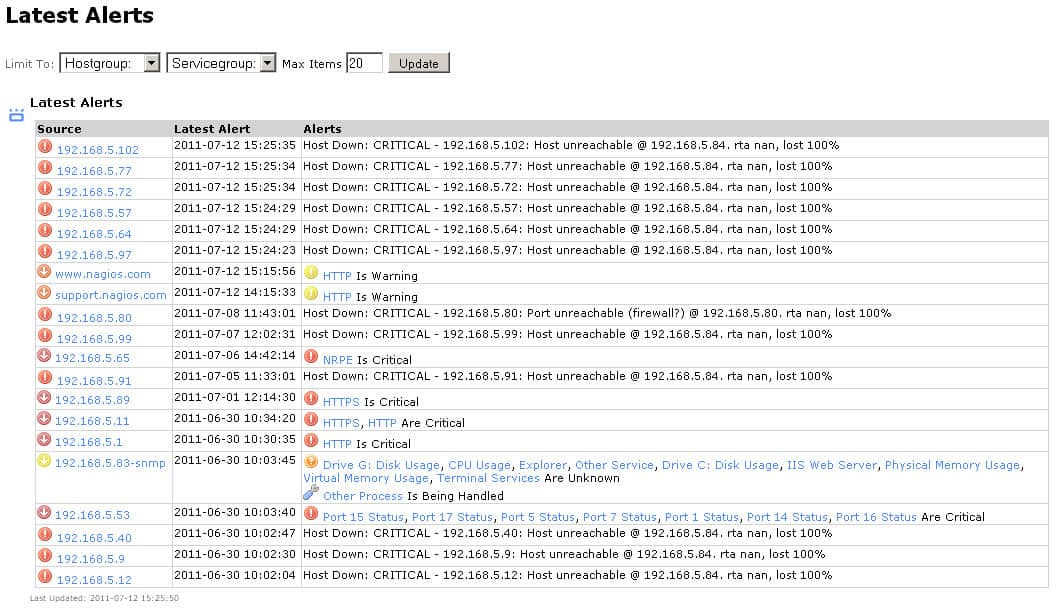
Nagios XI addresses this by allowing you to configure email and text notifications. There is a wide range of configuration settings that are centered on specific users. Users can define their own notification preferences, down to the emails and notifications that they receive. You can set alerts to rise for Warning, Critical and Downtime situations. Notifications can be selected or unselected by pressing the On or Skip buttons.
While many programs offer alerts and notifications, few do so as well as Nagios XI and Network Performance Monitor. Both systems offer symbol and clear color-coded status graphics, but SolarWinds’ visual quality is just higher across the board. You don’t have to invest any time in order to see if your core infrastructure is online.
Reports
Monitoring historic data is as important as monitoring live data. After all, in order to gain perspective over how well your network is performing now you need to know how it was performing in the past. Having the ability to create a report allows you to reflect on your network usage and to pass key information along to other members of staff. It also helps in defining a long-term network management strategy.
Reports are something that Nagios XI and Network Performance Monitor do very well. Nagios has a range of default reports that allow you to view graphs and tables full of past usage metrics. These can be exported to JPEG for closer inspection.
There are also plugins that expand this functionality and allow you to export to PDF for closer inspection.
SolarWinds Network Performance Monitor also has its own report generation capability. The user can quickly generate reports with a range of graphs and charts to get to the heart of the crucial issues. While Nagios XI reports are easier to use, Network Performance Monitors report design is much clearer and modern.
Virtualized Monitoring
As organizations have gravitated more towards virtualized infrastructure, it has become important to choose network monitoring solutions that are designed to monitor this type of equipment. This is another area in which SolarWinds Network Performance Monitor performs exceedingly well. SolarWinds has its own Virtualization Manager tool which allows the user to monitor a variety of hypervisors.
On the other hand, Nagios has the ability to monitor VMware but not much else. While this is valuable given the prominence of VMware it is far from SolarWinds’ complete Virtualization Manager. As a result, the edge goes to SolarWinds here.
Mobile Applications
Remote working has emerged as one of the largest trends in the world of technology. As a consequence, mobile applications have become very important. They provide staff with an opportunity to interact with a service without having to be at their desk. Unfortunately, Nagios XI doesn’t have an app at present. This is disappointing given the growth in popularity they have enjoyed over the past few years.
In contrast, SolarWinds has apps available for both Android and IOS. This allows staff to check up on their monitoring accounts to make sure that everything is in working order. This makes it more suitable for teams looking to work remotely.
Pricing
In terms of price, both Nagios XI and SolarWinds Network Performance Monitor are evenly matched. SolarWinds Network Performance Monitor can be purchased for a price of $2,975 (£2,245). There is also a 30-day free trial so that you can try out the platform before making a purchase. Nagios XI’s comes in both a Standard and Enterprise version.
The Standard Edition starts at a price of $1,995 (£1,504) and includes custom dashboards, reporting, custom user views, and notification escalations. If you want a more fully-featured version, then the Enterprise edition is well worth considering. The Enterprise version starts at a price of $3,495 (£2,636) and includes scheduled reports, capacity planning reports, web-based server console access, and SLA reports.
Enhancements
Nagios XI can be extended by free plug-ins that are available in the Nagios Exchange. The SolarWinds approach to extending the capabilities of its systems is to recommend the purchase of multiple modules. SolarWinds created many of its tools on a common platform, called Orion and if a buyer takes on more than one tool, they can access them through a single dashboard.
The most accessible enhancement for the SolarWinds Network Performance Monitor is to get the tool as part of the Network Bandwidth Analyzer Pack, which also includes the NetFlow Traffic Analyzer. This second tool is a traffic monitoring package that can sample packets and analyze the capacity and utilization of switches and routers by extracting statistics from them. The monitor communicates with network devices using the NetFlow, IPFIX, sFlow, J-Flow, and NetStream protocols.
The comparable addition to Nagios XI is the Nagios Network Analyzer. Nagios has ensured that none of the plug-ins available in Nagios Exchange cover traffic flow monitoring, so there is no free alternative to its paid traffic analysis package. This system communicates with network devices using NetFlow, IPFIX, sFlow, J-Flow, and Cflow. The Network Analyzer is an add-on to Nagios XI and integrates into the Nagios dashboard, providing a single console for all system monitoring services.
The enhancements that these traffic analysis packages add to the Network Performance Monitor and Nagios XI are very similar. Therefore, with respect to the ability to add on traffic analysis, these packages have equal capabilities.
SolarWinds Network Performance Monitor Takes the Win
Both SolarWinds and Nagios XI are high performers across the board when compared to other network monitoring competitors. However, based on its clear user interface, autodiscovery and all-around slickness, SolarWinds Network Performance Monitor is our top pick. While Nagios XI has a formidable pool of monitoring features, it doesn’t have an autodiscovery feature and the design feels a little dated when compared to Network Performance Monitor.
The most important factor in our criteria was the simplicity of the user interface. Effective network monitoring all comes down to how the user interface performs. If it’s too complex or clunky then you can’t get an accurate appraisal of the status of your infrastructure. Right from launching and running autodiscovery through to using the alerts center to prioritize your response to threats, Network Performance Monitor makes this process easy.
There’s little chance of you missing anything, and you don’t have to search around for what you’re looking for. Make no mistake, Nagios XI also offers a very user-friendly design, but it isn’t as easy to use. Likewise features like NetFlow, sFlow, and jFlow analysis give Network Performance Monitor a wider range of tools to work with. After all sophisticated network monitoring is about taking everything into account.
When there is little difference in price between the Network Performance Monitor and the full-featured Nagios XI Enterprise edition, it makes more sense to go for the former based on its superior design. SolarWinds Network Performance Monitor can be downloaded here. Alternatively, if you prefer Nagios XI’s classic approach to network monitoring you can download it from this link here.

