

No matter what your website does, it exists to attract the public to your business, cause, or interest. Confusingly, thanks to cache servers and content delivery systems, your site can be available in one part of the world and not in others. Are all of the elements of every page on the site loading successfully? It is impossible to check these issues constantly yourself, so you are going to need an uptime monitoring tool.
The best uptime monitors don’t run on your in-house system – they are strategically located on servers all around the world. Many businesses outsource the hosting of their sites and don’t even know the physical location of those servers. It really doesn’t matter where your website is sent from, it matters that it successfully reaches your full potential audience. Uptime monitoring lets you know when things go wrong.
Here is our list of the best network uptime monitoring software and tools:
- Site24x7 Website Monitoring (FREE TRIAL) Cloud-based service that monitors website performance, IT infrastructure, and application activities.
- ManageEngine OpManager Uptime Monitoring (FREE TRIAL) A monitoring system for networks and servers that tracks uptime on all devices. Available for Windows Server and Linux.
- ManageEngine Applications Manager (FREE TRIAL) This monitoring system covers website performance issues as well as cloud systems and on-premises applications. Available for Windows Server and Linux.
- Better Stack Uptime (FREE TRIAL) Availability checker that monitors website uptime from five, globally dispersed locations.
- Paessler PRTG (FREE TRIAL) An integrated network, server, and application monitor that offers an external website uptime and response time checker. Runs on Windows Server.
- Datadog Synthetic Monitoring API-driven or browser-based uptime monitoring plus other automated tests that can be run from a Datadog data center or a private location. This is a cloud platform.
- Nagios XI A systems monitoring tool that includes availability monitoring for websites.
- Zabbix Free, open-source network monitoring system that has a plug-in for monitoring the availability of server farms. Runs on Linux.
- SolarWinds Network Performance Monitor The industry leader in network monitoring uses SNMP routines to check on the health of network devices.
- StatusCake This cloud-based package provides uptime monitoring along with page speed testing, domain assurance, and SSL certificate check.
- Uptime.com A testing service for Websites and other Web applications that includes regular uptime checks.
- Dotcom-Monitor A Range of website and web services monitoring tools from this cloud-based platform.
- ITRS Uptrends Synthetic Monitoring Launches uptime tests from 180 locations in 60 countries, monitoring availability and response times for each element in a page – not just the site overall.
- Icinga 2 A popular, free system monitoring tool that runs on Linux. The server monitoring console of this system can be adapted to watch website uptime.
Uptime monitoring and response time monitoring
Uptime monitoring and response time monitoring are critical components of maintaining a reliable and user-friendly online presence. These practices ensure that websites, applications, and other digital services remain accessible and perform efficiently, minimizing downtime and delivering a seamless experience for users.
Uptime monitoring focuses on tracking the availability of a service, ensuring it is online and functioning as expected. Tools for uptime monitoring regularly ping servers or endpoints and report on their operational status. If a service becomes unavailable, these tools send alerts via email, SMS, or integrations with communication platforms like Slack or Microsoft Teams.
Consistent uptime is essential for user satisfaction, brand reputation, and compliance with service level agreements (SLAs). Monitoring tools often provide detailed reports, allowing organizations to track uptime percentages and identify patterns in downtime for proactive resolution.
Response time monitoring, on the other hand, measures the speed at which a service responds to user requests. Even if a service is available, slow response times can frustrate users, leading to poor experiences and lost business opportunities.
Monitoring response times provides insights into performance bottlenecks, whether caused by server issues, database delays, or network congestion. By setting thresholds for acceptable response times, businesses can detect and address issues before they significantly impact users.
Together, uptime and response time monitoring play a vital role in ensuring service reliability, maintaining user trust, and optimizing operational performance. Employing these practices allows organizations to maintain competitive, efficient, and dependable digital services.
The best uptime monitoring tools
When looking for the best uptime monitoring software and tools, we identified specialist services that focus on website availability monitors and also in-house software that can check your network servers and web services to make sure that they are working correctly.
Our methodology for selecting uptime monitoring software
We reviewed the market for uptime monitoring tools and analyzed the options based on the following criteria:
- Options for network device availability
- Internet-based uptime monitoring for Web assets
- Checks launched from several locations to catch partial connection outage
- Nice to have response time and other rending statistics
- Systems for on-premises installation and cloud platforms
- An opportunity for a cost-free assessment through a demo system or a free trial
- A constant monitoring tool that is worth paying for
We used these selection criteria as guidelines and made sure to discover software packages for purchase or metered or subscription cloud-based services.
1. Site24x7 Website Performance Monitoring (FREE TRIAL)
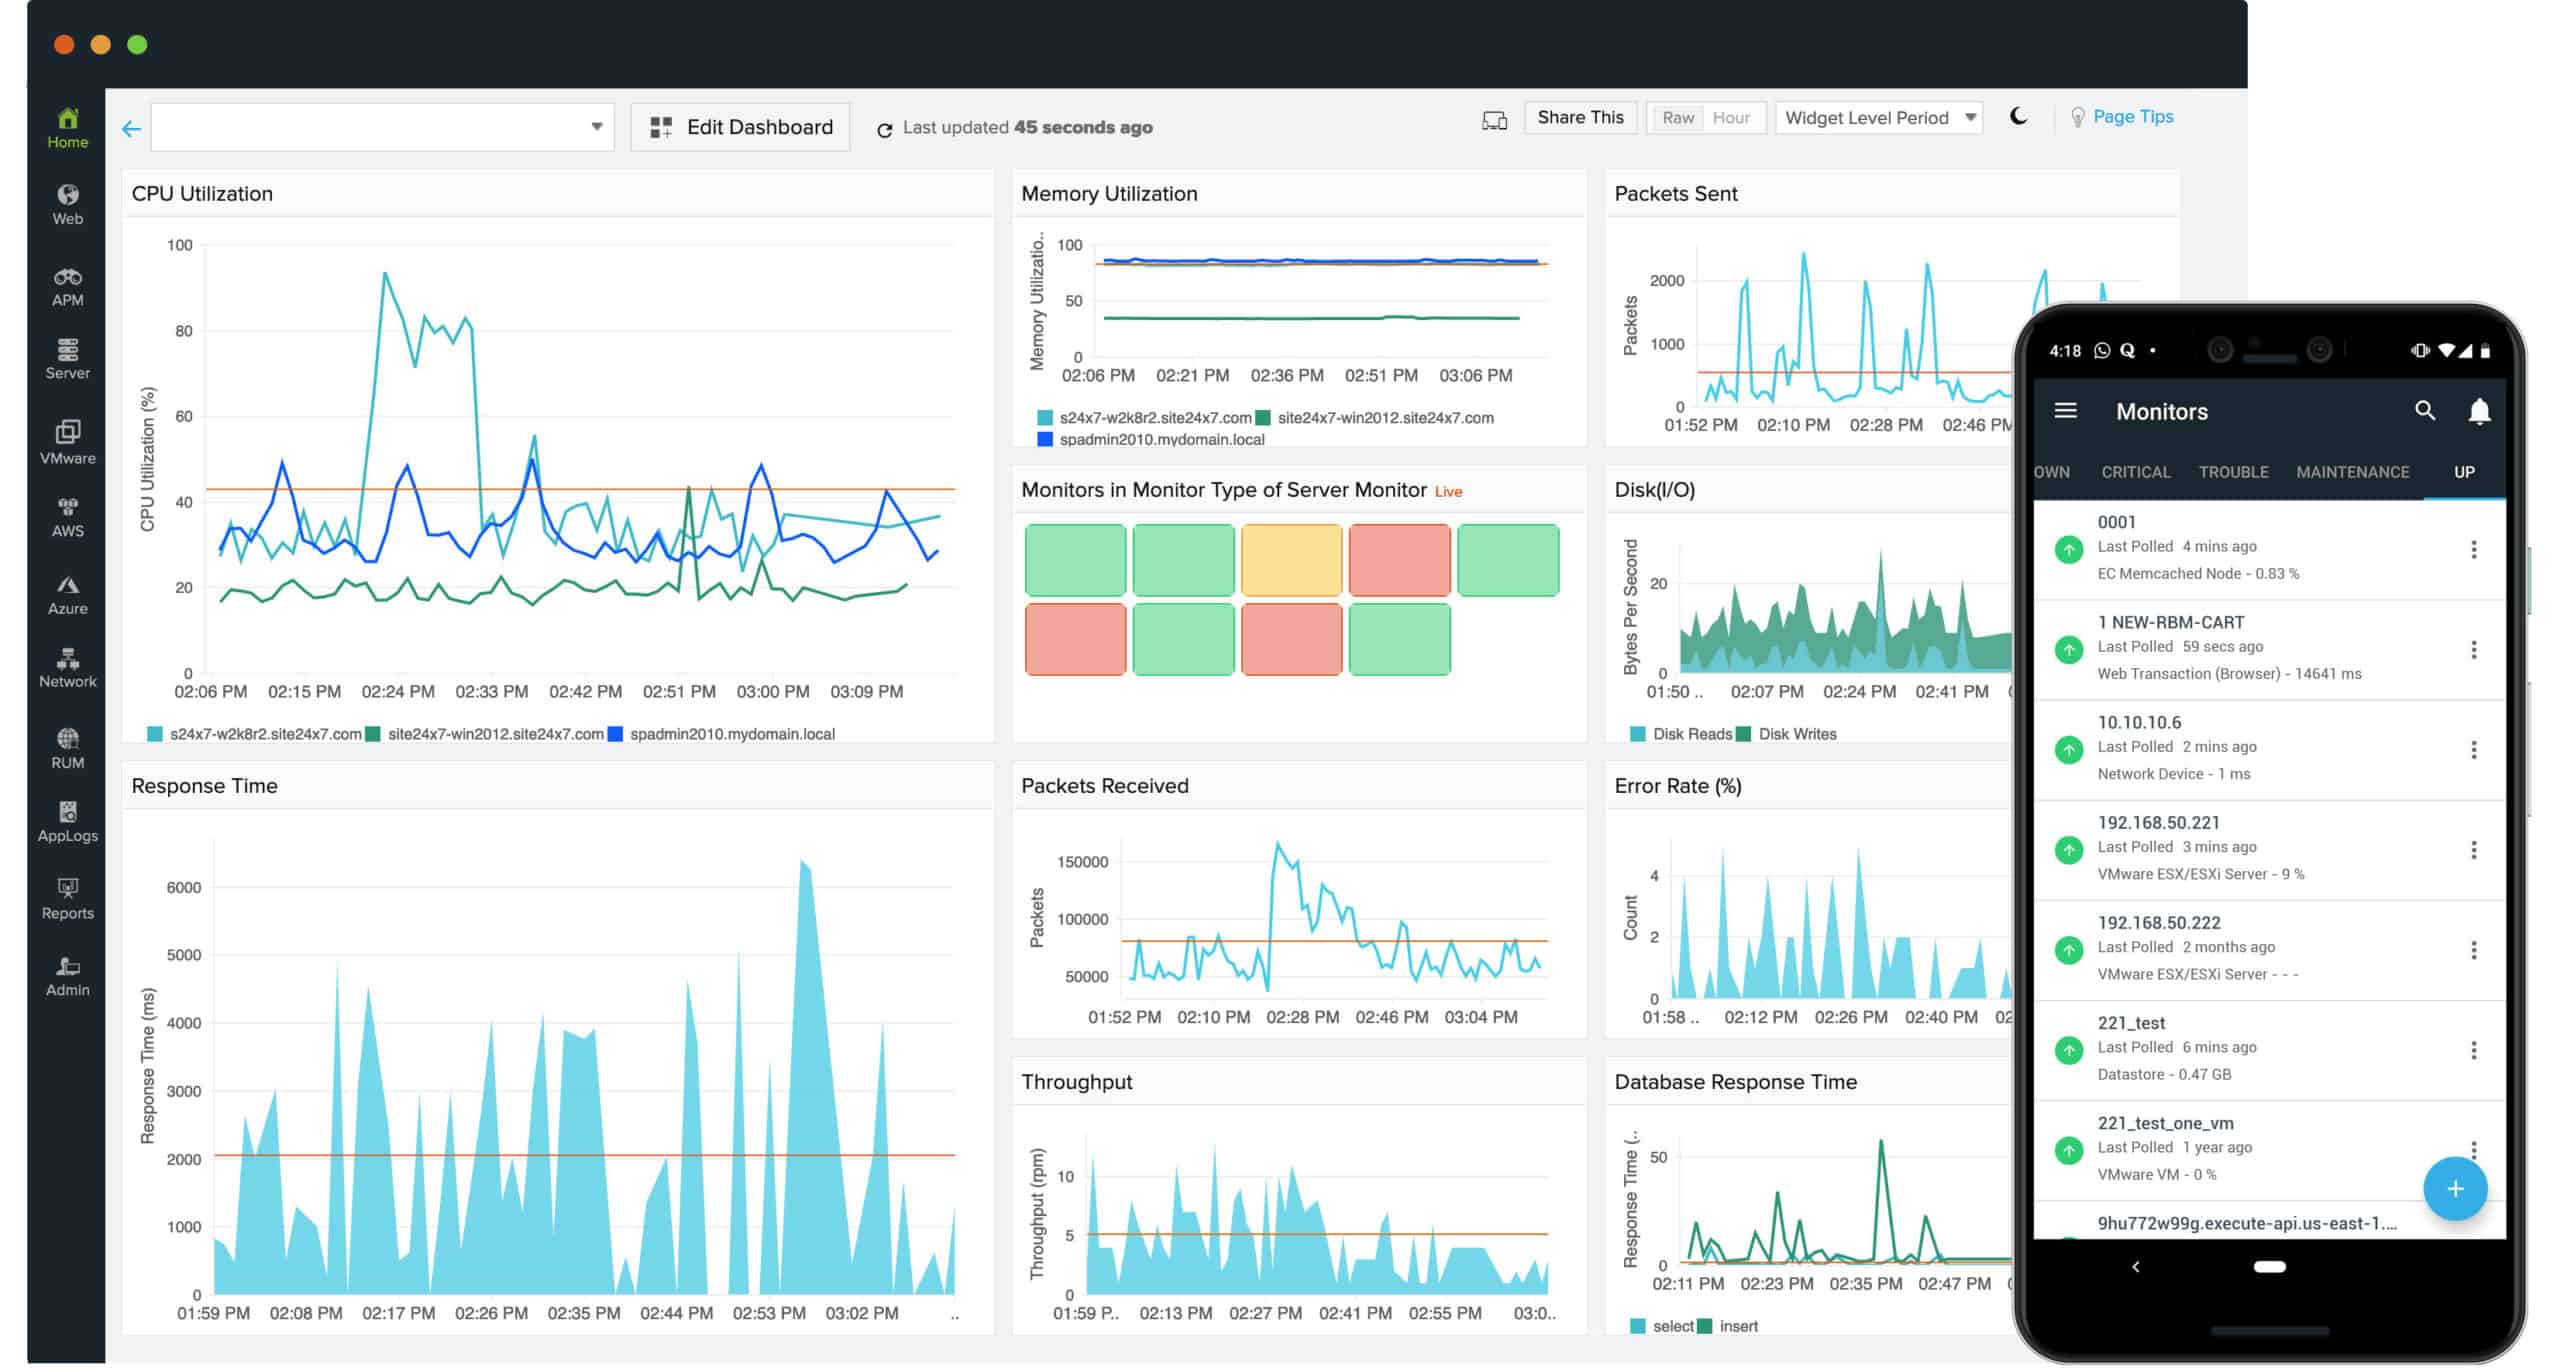
Site24x7 covers all the IT support of websites, enabling it to help web entrepreneurs to keep their sites available. The cloud service performs continual checks on the sites of customers from 90 locations around the world. These checks not only spot when sites go down but also when sites are not deliverable all over the world. That regional outage might be due to the actions of national governments or problems with internet performance.
Key Features:
- Uptime Tests from 90 Locations: Includes response times
- Root Cause Analysis: Examines website performance issues
- Status Alerts: Sent by email or SMS
Why do we recommend it?
Site24x7 Website Performance Monitoring offers two types of systems from its cloud platform. The first of these is a basic monitor, which includes uptime testing with automated processes. The second is a transaction monitoring service that provides walkthroughs of website features to test that they respond correctly.
Websites stand at the top of a stack of services and the failure of one supporting layer will cause the website to go down. So, knowing that a site has gone down is not enough; website owners need to quickly identify why it went down. Site24x7 assists system administrators to prevent outages by identifying equipment and applications that are under pressure.
The ability to spot status issues on the network, server, and in-application performance gives systems administrators a chance to reallocate resources to head off disaster. Should there be no warning signs of an impending outage, the Site24x7 check can identify which internet service caused the failure. These checks include a Domain Expiry Monitor, SSL/TLS Certificate Monitor, a Ping Monitor, and a Web Transaction Monitor, among other automated monitoring tools.
Who is it recommended for?
The Site24x7 cloud platform provides its services in packages. So, when you choose a plan that provides the number of basic and Web transaction monitoring allowances that you want, you also get network, server, and application monitoring in the bundle. These are sized for small businesses and larger businesses can pay for extra capacity.
Pros:
- A Range of Tests: Basic Ping-based tests to walkthrough record and replay
- Services Monitoring: Includes SL and domain expiry tracking
- Real User Monitoring Available: Tracks the events that occur during user visits to a site
Cons:
- You Can’t Buy the Synthetic Monitoring Unit by Itself: Site24x7 provides full-stack packages
Site24x7 is a cloud-based service provider and is charged for by subscription. The service is available for free to small businesses that only need to monitor up to five websites or servers. Enterprises that need more advanced monitoring capacity than that can choose between four paid editions. Anyone of the paid versions of Site24/7 can be experienced on a 30-day free trial.
2. ManageEngine OpManager Uptime Monitoring (FREE TRIAL)

ManageEngine OpManager constantly monitors the availability of network devices and servers, recording the duration of each piece of equipment in service.
The OpManager system starts its service life by scanning the network and logging all attached devices, including servers, in an inventory. It then repeatedly checks on availability, showing statuses in the system dashboard.
Key Features:
- Network Device Availability and Uptime: Uses the Simple Network Monitoring Protocol
- Server Availability and Uptime: Also measured with SNMP
- Alerts and Notifications when Devices Go Offline: Get a notification by email, SMS, or Service Desk ticket
Why do we recommend it?
The ManageEngine OpManager Uptime Monitoring service is a similar package to SolarWinds Network Performance Monitor. This is a network device monitoring tool that constantly sweeps for status reports. Each response cycle enables the tool to update a network inventory and any changes to the network are noticed.
The statistics in the dashboard include uptime graphs that can be gathered on one screen or distributed on drill-down feature pages for each device – the OpManager dashboard screens are customizable.
Each metric that the OpManager system tracks is shadows by a performance expectation threshold. If problems arise, the system issues an alert. A device or server going down will also trigger an alert.
The settings screens of OpManager allow you to nominate email accounts and cell phone numbers that will receive notifications if an alert is raised. This allows your operations staff to get on with other tasks – they will be called back to the dashboard if a server, switch, or firewall appliance goes offline unexpectedly.
Who is it recommended for?
The lowest package for this tool is sized to make it suitable for small businesses. There are higher plans with more capacity for larger businesses. The base package will monitor 10 devices and there is a Free edition that will perform uptime monitoring for three devices.
Pros:
- Network Discovery: Creates a topology map and inventory
- Log Generation: Can feed data into a SIEM
- Deployment Options: You can run the software on your own server or on a cloud platform
Cons:
- Device Availability Only: You need the NetFlow Analyzer for device throughput examination
ManageEngine OpManager is delivered as on-premises software for installation on Windows Server or Linux. The package is available in four editions and the first of these is free to use. The Free edition, however, is limited to monitoring just three devices. The three paid editions are Standard, Professional, and Enterprise. Neither the Free nor the Standard editions include the ability to monitor virtual systems. The Professional and Enterprise editions are top-of-the-line with all features. The difference between them is that the Professional edition will monitor one site and the Enterprise version includes distributed monitoring for multi-site businesses. You can get started with a 30-day free trial.
3. ManageEngine Applications Manager (FREE TRIAL)

ManageEngine Applications Manager is an application performance monitor with a wide range of capabilities. This tool includes a section of website monitoring tools as well as including on-premises application monitoring and cloud services performance tracking.
Key Features:
- Availability Tests for Software and Services: Discovers all software
- Synthetic Monitoring: Check on remote service availability
- Distributed Tracing: Records Web application performance
Why do we recommend it?
ManageEngine Applications Manager focuses on software and middleware. This includes Web servers and essential services for websites, such as databases. The tool begins by looking at all of the applications that you know about and then drills through to discover all of the modules that contribute to the performance of those systems.
The uptime monitoring service in Applications Manager is called URL Monitoring. This service is also included in the ManageEngine OpManager package. The first benefit that you will get from this system is constant site availability checking. The URL monitor is able to check on the availability of a specific page and it can carry out ongoing availability tests on several Web pages simultaneously.
Factors that the URL monitor tracks include response time, DNS time, connection time, and page size. Each of these attributes can be linked to alerts and alerts can be set to trigger notifications to technicians via email or SMS. This alerting system ensures that operations team members don’t miss serious service outages but they don’t have to dedicate time to watching normal operations of the website.
Applications Manager has more functions that assist in the successful operations of a website. The tool includes extensive facilities for testing the performance of individual elements in a page. This is the synthetic monitoring service that will run an action script through a live web page, triggering interactive elements so that they can be tested.
The highest plan of Applications Manager, called the Enterprise edition also includes distributed tracing that tracks the actions of microservices. These modules operate behind APIs and mobile apps and could be running on hosts anywhere in the world.
Who is it recommended for?
This tool creates an application dependency map that identifies all of the modules that contribute towards an application and then also looks at the services that each application depends upon. This map is an ongoing uptime monitor for software and it provides instant root cause analysis if user-facing applications fail.
Pros:
- Deployment Options: Run this software on your servers or on the cloud
- Useful for Monitoring Microservices: Creates an application dependency map
- Monitor Network Action Performance: Logs the response times for DNS resolution and detail load times for Web page elements
Cons:
- Not a SaaS Package: Although it is available for AWS or Azure, you have to manage the software yourself
There are two other editions of Applications Manager: Free and Professional. The Free edition is limited to operating just five monitors, but there are no limits on the performance of the Professional package. ManageEngine offers Applications Manager on a 30-day free trial. The software for the package installs on Windows Server or Linux.
4. Better Stack Uptime (FREE TRIAL)

Better Stack Uptime is a website availability monitor that performs periodic checks on a site’s uptime from five locations. These locations are: the USA, Australia, South Africa, American Samoa, and the EU. Tests can be performed with Ping or through a Web browser. You get a choice of browser to run your tests through from Google Chrome, Mozilla Firefox, and Apple Safari.
Key Features:
- Five Test Locations: Confirms failed tests from three locations before reporting
- Free Plan Available: Checks every three minutes
- 60-Day Money-Back Guarantee: No free trial
Why do we recommend it?
Better Stack Uptime is a managed service that notifies you when your Web site is down. This is an uncomplicated service that launches availability tests against your sites from five locations. Test frequency depends on your plan. You get an email or a robo call if your system goes down and the service also provides a status page.
This system isn’t entirely automated. It is a managed service with human operators manning the testing system. If a target is found to be down, the system retests from two other locations before notifying the customer. This procedure is built into the service in order to prevent false-positive reporting and cut down the number of alerts that the client receives that could be due to a glitch in the Internet connection used for the test.
All tests are logged and a list of each availability check can be inspected in the user dashboard. The console also shows the sequence of test results in a color-coded bar.
A failed contact event gets documented with screenshots of the failure message appearing in a browser. Subscribers get notified when a test fails. These notifications can be implemented by phone call, SMS, email, or Slack message. The operators for the service can be contacted by the client around the clock. There are two operation centers for Better Stack Uptime, which are located in Alabama, USA, and Belgium in Europe.
The tests aren’t only concerned with checking on the availability of Web pages. The user can specify tests to check on the availability of APIs and services that get triggered within pages on a site.
Incidences can be sent straight through to Help Desk software. There is a range of integrations for Better Stack Uptime that enables it to interface with other applications. These include Zendesk, Datadog, New Relic, and Grafana.
Who is it recommended for?
This service is essential for anyone running a website – particularly for a money-generating site. The service is available in four plans and the first of these is Free. That plan launches checks every three minutes but the paid plans check every 30 seconds.
Pros:
- Web Browser Choice: Select different browser brands for your tests
- Reduces Alert Fatigue: Confirms a problem before alerting
- Monitors Email Servers: Also tests DNS servers
Cons:
- Doesn’t Provide a Free Trial: Offers a money-back guarantee instead
There is a Free plan of Better Stack Uptime, which launches tests against ten targets every three minutes. This plan includes notification by email. There are three paid plans, called Freelancer, Small Team, and Business. The tests in all of these plans are launched every 30 seconds. The Freelancer edition includes testing of 50 targets, Small Team has a limit of 100 targets, and the Business plan has no limit on the number of targets that can be nominated for testing. All plans include a 60-day money-back guarantee.
5. Paessler PRTG (FREE TRIAL)
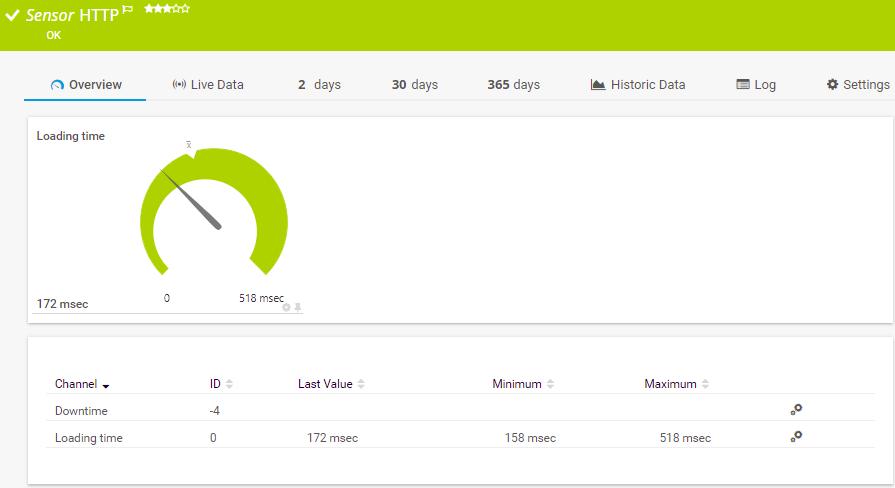
Paessler PRTG is a collection of network, server, and application monitors. This combination is ideal for monitoring the uptime of systems such as websites. Among the long list of monitors, which are called “sensors,” are the HTTP Sensor, the HTTP Transaction Sensor, and the HTTP Full Web Page Sensor.
Key Features:
- Page Speed Tests: Also offers stress testing
- Downtime Alerts: Writes to a log as well as showing statuses on the screen
- Transaction Monitoring: Tests interactive elements in a site
Why do we recommend it?
Paessler PRTG is a package of monitoring systems for networks, servers, middleware, cloud systems, and applications. The package includes SNMP-based network discovery services for on-premises systems and Ping monitors for checks on remote assets. There are also HTTP tests available. You can also get a Web server load stress test.
The HTTP Sensor is the most straightforward of these monitoring services. It checks that a site is available, so this is the basic uptime monitor of PRTG. The HTTP Transaction Sensor digs a little deeper. It is a web services tester that simulates a typical journey of a user through a website. This enables an administrator to check that all elements, such as drop-down lists and shopping carts are working correctly. The HTTP Full Web Page Sensor checks the load times of different elements in a web site by running checks through a browser.
You don’t have to manually monitor these sensors to stay in the loop either. PRTG sends you notifications by email and SMS once a parameter has been exceeded. These alerts are configurable and you can set the trigger conditions that need to be met before a notification is sent to you.
Who is it recommended for?
PRTG is available for installation run on Windows Server. You can also get it as a cloud-based SaaS package. The subscription charge gives you an allowance of sensors to activate. The minimum number you can buy is 500 but if you only activate 100, the system is free to use.
Pros:
- A Large Library of Sensors: Uses flexible sensors to monitor different aspects of your webpage and web server resources
- Free Edition: You can use 100 sensors for free
- Scalable Pricing: Pricing is based on bundles of sensors
Cons:
- Not Available for Linux: Offered for installation on Windows Server or as a SaaS platform
The least expensive version of PRTG is the freeware version which allows you to monitor up to 100 sensors without charge. Any larger enterprises will need to purchase PRTG 500 for $1,600 (£1,226). PRTG 1000 and PRTG 2500 can be purchased for $2,850 (£2,183) and $5,950 (£4,559) for 1000 and 2500 sensors. There are several other versions up to PRTG XL1 which supports unlimited sensors for $14,500 (£11,111). You can download a 30-day free trial.
6. Datadog Synthetic Monitoring
Datadog offers a range of cloud-based system monitoring services, including uptime monitoring tools. The company offers two types of website availability monitoring, which it groups under the category of Synthetic Monitoring. Both options test the availability of a website repeatedly from different monitoring locations around the world.
Key Features:
- Browser-Based Tests: Simple and complex
- API Feed Option: Instead of a browser-based launch
- Multiple External Test Locations: Test access from different points on the globe
- Root Cause Analysis: Displays results in the cloud-based console
- Downtime Alerts: Confirms test failure before alerting
Why do we recommend it?
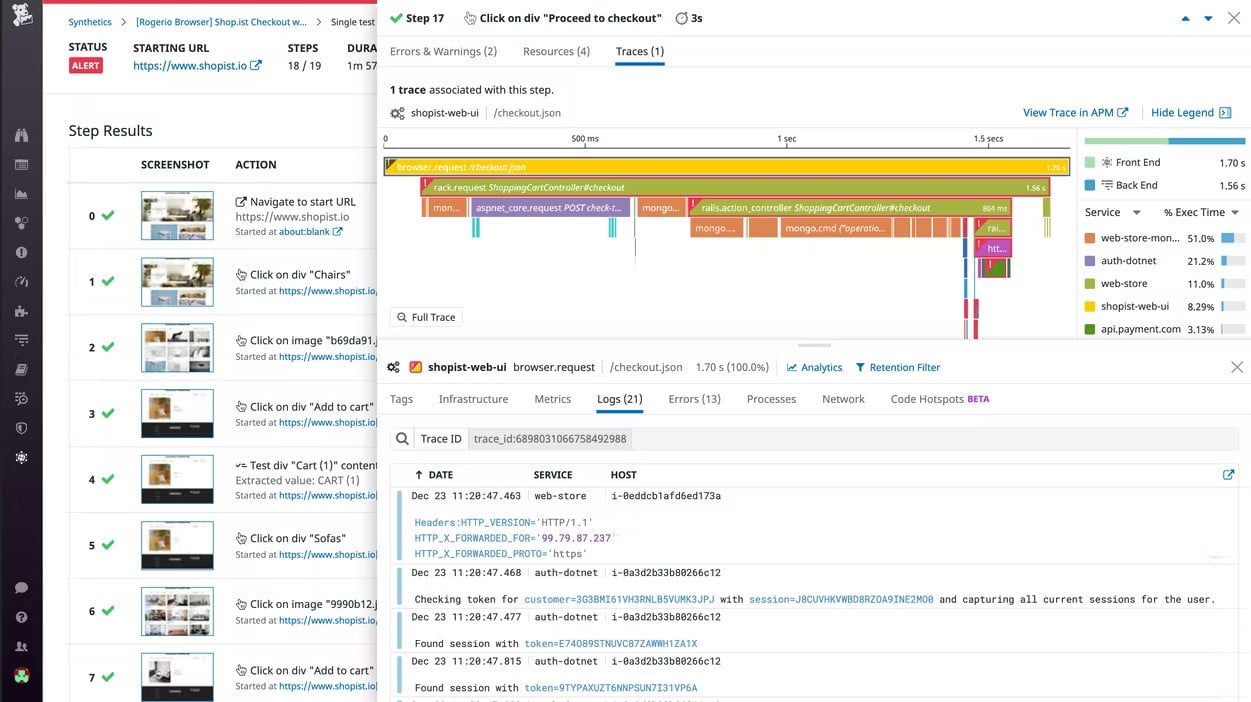
Datadog Synthetic Monitoring offers a range of tests that include the Ping-based availability tests through to more complicated page element load times and function activation walk-throughs. The more complicated tests that try interactive elements can be set up through a recorder, which will then replay your actions.
The uptime monitors make checks either through an API or through a browser. In each case, on a subscription basis, charged in units of 1,000 access attempts per month for browser access or 10,000 units per month for API access.
The browser tests are more comprehensive and deliver more detail. They include screenshots of failed access attempts. All tests for both methods are logged and timestamped. The website manager is also able to create custom tests and run them repeatedly through the remote Datadog test agents.
As well as checking the availability of a site and each of its pages, the uptime monitors record response times. The site manager can access the results of tests in a dashboard, which has great visualizations. Failures or poor responses trip performance thresholds, generating alerts. The threshold levels are adjusted through a machine learning process, which accounts for factors, such as internet connection reliability.
Errors can be traced to the cause, whether it is code-based or an infrastructure issue. Log analysis features in the Datadog tool assist in quick identification of the root cause of the problem.
Who is it recommended for?
Any Web developer or website owner needs to check that all of the elements in a page actually work and that they are accessible from all locations in the world. Thanks to content delivery networks and development frameworks, elements in your pages can be supplied by different servers in different locations, so testing that they all deliver is important.
Pros:
- Combines with Other Modules: Works well with the Datadog APM
- Can Monitor Both Internally and Externally: Testing networks as well as the internet
- Easy Test Script Creation: Record a site walkthrough and replay it
- Add Variables to Test Scripts: Cycle through a list of values to test interactive elements
- Test Different Protocols: HTTP, SSL, DNS, WebSocket, TCP, UDP, ICMP, gRPC
Cons:
- Works Best When Combined with Many Other Modules on the Platform: Can end up expensive
The API version of the uptime monitor from Datadog is considerably cheaper than the browser-based test. They cost $5 per 10,000 tests per month, whereas the browser-based service is priced at $12 per 1,000 tests per month.
7. Nagios XI
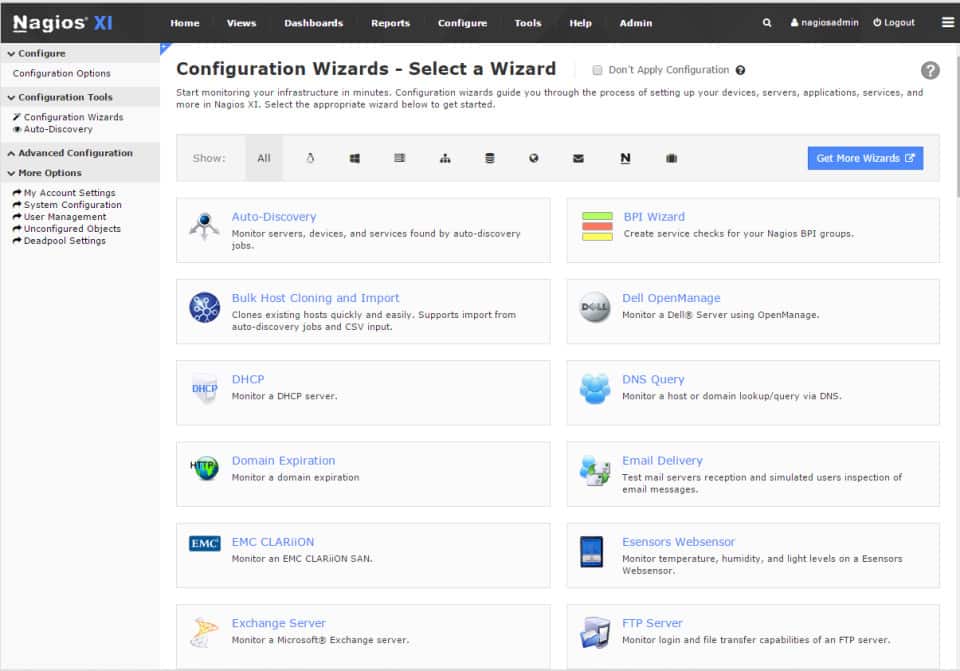
Nagios XI is a network monitoring platform that’s powered by the famous Nagios Core 4 monitoring engine. Nagios XI is one of the most compelling network monitoring tools on CentOS and Redhat Enterprise Linux. This tool provides a centralized perspective of your network and allows you to view whether a service is up or down. This can be seen most clearly in the Host Status Summary or Service Status Summary views where services are categorized and color-coded as Up, Down, Unreachable, and Pending.
Key Features:
- Website Monitoring Plugins: Available for free from Nagios Exchange
- Page Speed Reporting: Along with availability reports
- Transaction Monitoring: Offers tests for interactive Web page elements
- Why do We Recommend it?
Nagios XI is an impressive on-premises system monitoring package for networks, servers, cloud platforms, middleware, and applications. This tool includes an SNMP-based network discovery and monitoring system that checks the availability of devices on the network. It also includes a Ping utility and the system can be expanded by plug-ins to provide other functionality.
Among the many options available to customize the monitoring system, you will find three adaptation wizards that specifically address website monitoring. The Website Wizard gives statuses on a website, which includes its uptime and response times. The Website URL Wizard adds content load times to those details. The Web Transactions Wizard monitors interactive elements in a site and their activation.
However, this software is as much focused on helping you to prevent downtime as anything else. The sheer variety of visual displays allows you to keep tabs on your network health before devices go down. For example, there is a Top Alert Producers Last 24 hours view that shows you those devices that are flaring up with problematic activity.
One of the features that has made Nagios XI gain so much traction is its usage of add-ons. There are tons of different add-ons that you can use to expand the basic functionality of Nagios XI according to your needs. These add-ons are developed by the community giving you a range of options as far as customizing your monitoring architecture.
Who is it recommended for?
The Nagios system will maintain general system monitoring while operating the special website availability monitors that you set up with plug-ins. These website monitoring tools provide load times for different elements in the page and can also highlight components that consistently experience problems. This software runs on Linux, Hyper-V, or VMware.
Pros:
- Extensible Package: The plugin library can provide a large number of extra features
- Network Device Uptime: Monitor the availability of all network devices
- Ad-Hoc Troubleshooting: Run Ping in the console for manual checks
Cons:
- Doesn’t Install Directly on Windows: You can run it on top of a VM on Windows
Nagios XI is also the perfect entry-level tool with a free licensed version, although this is limited to seven hosts. If you require more hosts then you can buy the Standard Edition or Enterprise Edition. The Standard Edition can be purchased for $1,995 (£1,528) with custom dashboards, reporting, notifications, and configuration wizards. The Enterprise Edition can be purchased for $3,495 (£2,677) with scheduled reports. You can download the 30-day free trial of Nagios XI.
8. Zabbix
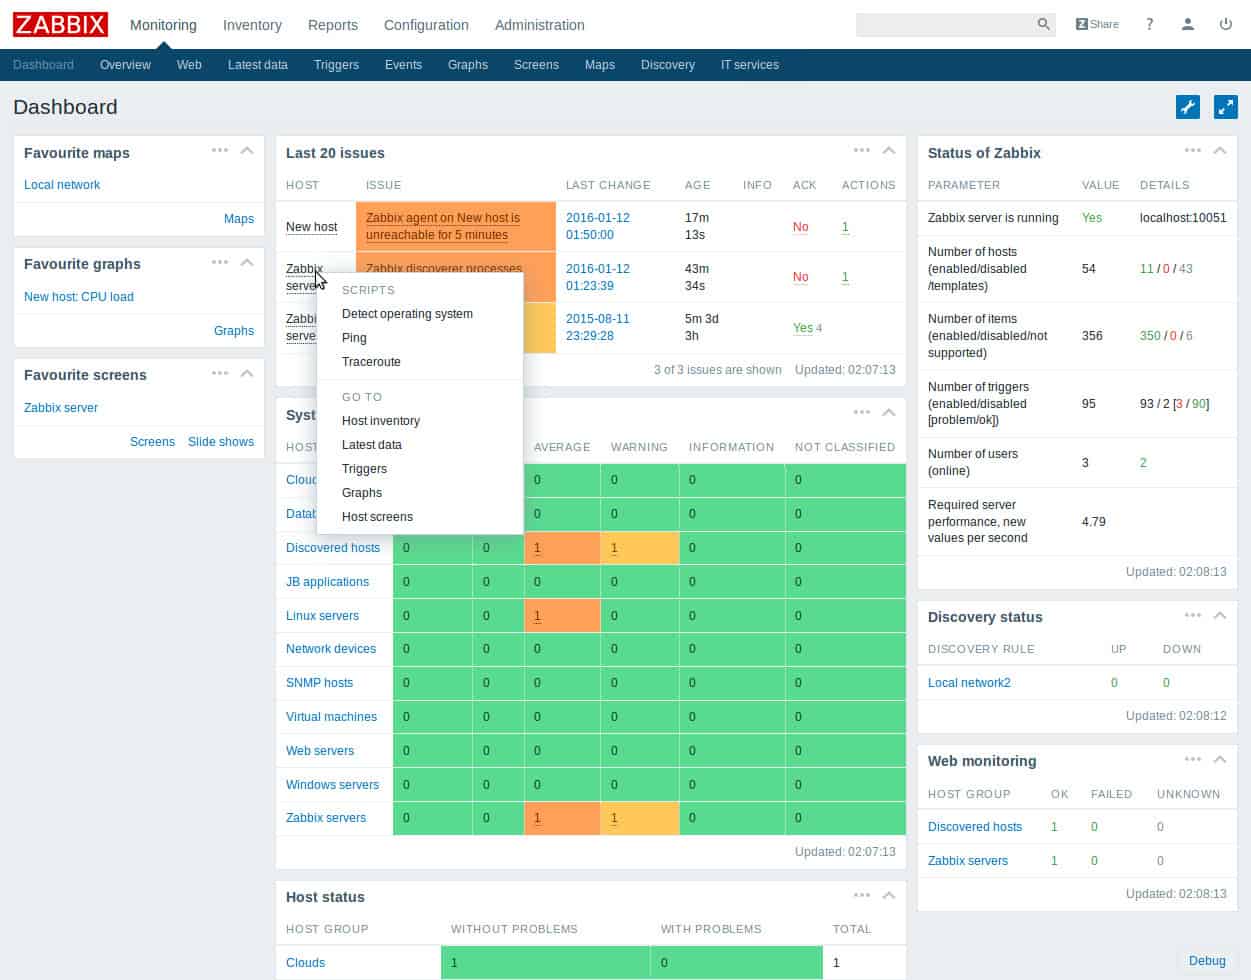
Zabbix is an open-source network, server, and application monitoring too that is ideal for watching your service uptime status. With Zabbix you can view when a service is in a warning or critical state, and when it is down completely.
Key Features:
- Completely Free to Use: There is no paid version
- Attractive Interface: Screens are also customizable
- Autodiscovery: Discovers virtual systems as well as physical devices
The interesting thing about Zabbix is the depth of its performance monitoring capabilities. You can monitor device temperature, power supply, disk space, and fan status. This provides you with a range of information that can help you to prevent a device from failing.
Why do we recommend it?
Zabbix is a free tool and it is similar to Nagios in that it provides system monitoring services that can be extended. The add-ons in the Zabbix package are called templates. The regular monitor includes SNMP for network device availability checks and extensions provide a method to set up website Ping tests.
Zabbix website uptime monitoring and any other web metric gathering, is set up through creating a “web scenario.” A scenario is a series of HTTP requests, which are called “steps.” The monitoring tool then periodically sends these requests to the host of the website and records responses. The user decides the cycle period of these requests.
Zabbix also uses a system of templates for monitoring services. Each template specifies a specific type of resource to monitor. A web scenario can be included in a template. This enables the same tests to be issued on several servers, more or less simultaneously. This tactic is ideal for those who have sites hosted on content delivery networks with cache servers in several different locations.
Each test’s results are logged and it is possible to specify alert notifications under certain conditions.
Who is it recommended for?
A big advantage of Zabbix is that it is free, which is great for small businesses. Large corporations also use Zabbix and subscribe to a professional support package. It takes a while to understand the method to create a customization through a template. The software runs on Linux, virtualizations, or containers.
Pros:
- Continuous Device Availability Tests: Uses both SNMP and ICMP
- Spots when Devices are Added, Moved, or Removed: Automatically updates the network inventory
- Alert Notification System: Get notified by SMS, email, custom script, and webhook
Cons:
- No Professional Support: A support package is available for a fee
Zabbix has all the features of a premium-priced application without the hefty price tag. Zabbix can be downloaded for free on CentOS, Debian, Oracle Linux, Red Hat Enterprise Linux, and Ubuntu. Zabbix is available for download.
9. SolarWinds Network Performance Monitor
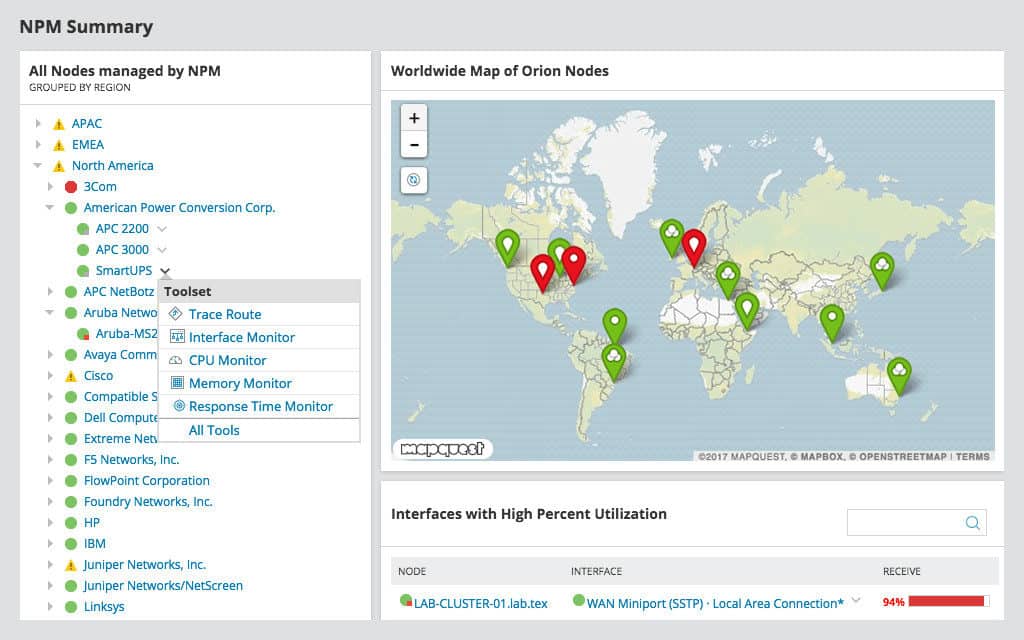
Although it doesn’t cover websites, SolarWinds Network Performance Monitor is an excellent tool for uptime monitoring on network devices. With this tool, you can view whether devices are classified as Up, Critical, Warning, or Undefined. SolarWinds Network Performance Monitor uses SNMP polling to verify the status of devices throughout your network.
Key Features:
- Network Uptime Monitoring: Device discovery and inventory management
- Automated Status Checks: Uses the Simple Network Management Protocol
- Alerting Mechanism: Notifications by SMS or email
Why do we recommend it?
The SolarWinds Network Performance Monitor is a tool for the automated monitoring of LANs. It scans a network and discovers all devices and constantly rescans to ensure that each device is still available and in the same location. Device agent warnings of component problems can predict when a device is about to fail.
However, you aren’t limited to managing your network through the dashboard display alone. You can also view a network topology map that shows the status of your devices from a geographical perspective. This is referred to as NetPath critical path visualization. NetPath is most useful in live environments where you want to develop a quick perspective of how many devices are up in both your legacy and virtual environments.
All of the status information you see is kept up-to-date by an autodiscovery feature. The autodiscovery feature scans for new devices on startup and adds them to the software automatically. Throughout the lifetime of the product, autodiscovery ensures that new devices are added to your monitoring environment. This is great because you don’t have to do anything extra to monitor it.
Overall, SolarWinds Network Performance Monitor uses SNMP polling to autodiscover and monitor the network devices and connections. The dashboard gives you a commanding view of the network and helps you identify network issues before they become critical.
Who is it recommended for?
The NPM and similar packages have transformed network management because they automatically detect device problems. This gives technicians time to take action to fix a gathering problem before the network performance gets bad enough for the users to notice. With this tool, your network manager avoids getting caught out by surprise device failure.
Pros:
- Network Topology Maps: Visually identify when devices go missing
- Customizable Dashboards: Provides drag-and-drop widgets
- Compliance Templates: Built into the reporting engine
Cons:
- Only Available for Windows Server: No option for Linux
SolarWinds Network Performance Monitor offers a scalable pricing structure that increases in price the more elements you want. This starts with NPM SL100 which allows you to monitor 100 elements for $2,955 (£2,265). The next version is NPM SL250 which supports up to 250 elements for $6,720 (£5,150). NPM SL500 supports 500 elements for $10,445 (£8,006). The next two versions are NPM SL2000 and NPM SLX. NPM SL2000 is available for $19,345 (£14,827) and supports 2000 elements whereas NPM SLX supports unlimited elements for $32,525 (£24,930). You can also download a 30-day fully functional free trial.
10. StatusCake
StatusCake is a cloud-based Web testing platform that is able to launch availability tests from 30 countries. The frequency of the tests is dictated by the plan you choose and it ranges from every five minutes to every 30 seconds.
Key Features:
- Uptime Tests: At 5 minute, 1 minute, or 30 second intervals, depending on the plan
- Page Speed Tests: Reports on load times for Web page elements
- Free Edition: Uptime checks every five minutes
Why do we recommend it?
StatusCake is a performance testing service for websites. The company is entirely committed to the world of the web because its team operates the business entirely from a website. Their marketing is all on a website and subscribers access the system dashboard and its tools on the same site. So, StatusCake really understands the priorities of all types of websites and integrates that knowledge into its service.
The results of each availability test are recorded and users can see time series graphs of recent uptime in the StatusCake dashboard. Those metrics are also stored for a month to provide historical analysis.
The StatusCake service isn’t just about presenting availability in attractive graphs and charts. The value of a service like this is that you want to know when a specific site or service ceases to become available. You need to know how long it was unavailable and you need to deal with the problems as quickly as possible.
The StatusCake service will send you a notification if your website is down. The service can also be pointed to the services that contribute to your site, such as CDN servers or APIs. The tests can be launched from 30 different locations and, while few businesses would activate all of those, the multiple views on performance let you know whether the problem lies with your site or a delivery path.
Live test results can be fed into monitoring systems, such as Datadog and you can also channel them into notifications in collaboration systems, such as Slack or Telegram, when failure occurs. That information management strategy also applies to the other services of StatusCake, which are a page load speed tester, an SSL certificate checker, and a domain defender.
New website owners and small business entrepreneurs also benefit from the Knowledge Base in the StatusCake package. These explain how to use uptime monitoring and what to do when a problem is detected.
Who is it recommended for?
There are two audiences for StatusCake. The tool addresses the problems of consumers of Web services, such as those who use Web hosting packages. These services usually have performance-level promises. These promises usually have compensation pledges but you have to prove that performance failed in order to get that. The other group that needs these tools is service providers.
Pros:
- Multiple Locations to Launch Tests: A choice of locations in 30 countries
- Measurements for SLA Enforcement: Suitable for both service providers and their clients
- Automated Channels for Alert Notifications: Sent through messaging tools
Cons:
- No Downloadable Self-Hosting Option: Only offered as a SaaS platform
Small businesses can get the StatusCake system for free. The Free plan doesn’t provide multiple test launch locations. However, it does include uptime monitoring, SSL monitoring, page speed testing, and domain defense. You get availability tests every five minutes with that plan. Higher plans offer tests every minute and every 30 seconds and also let you choose launch locations. You can get a free trial of any plan, so you might as well access the top plan, which is called the Business Edition.
11. Uptime.com
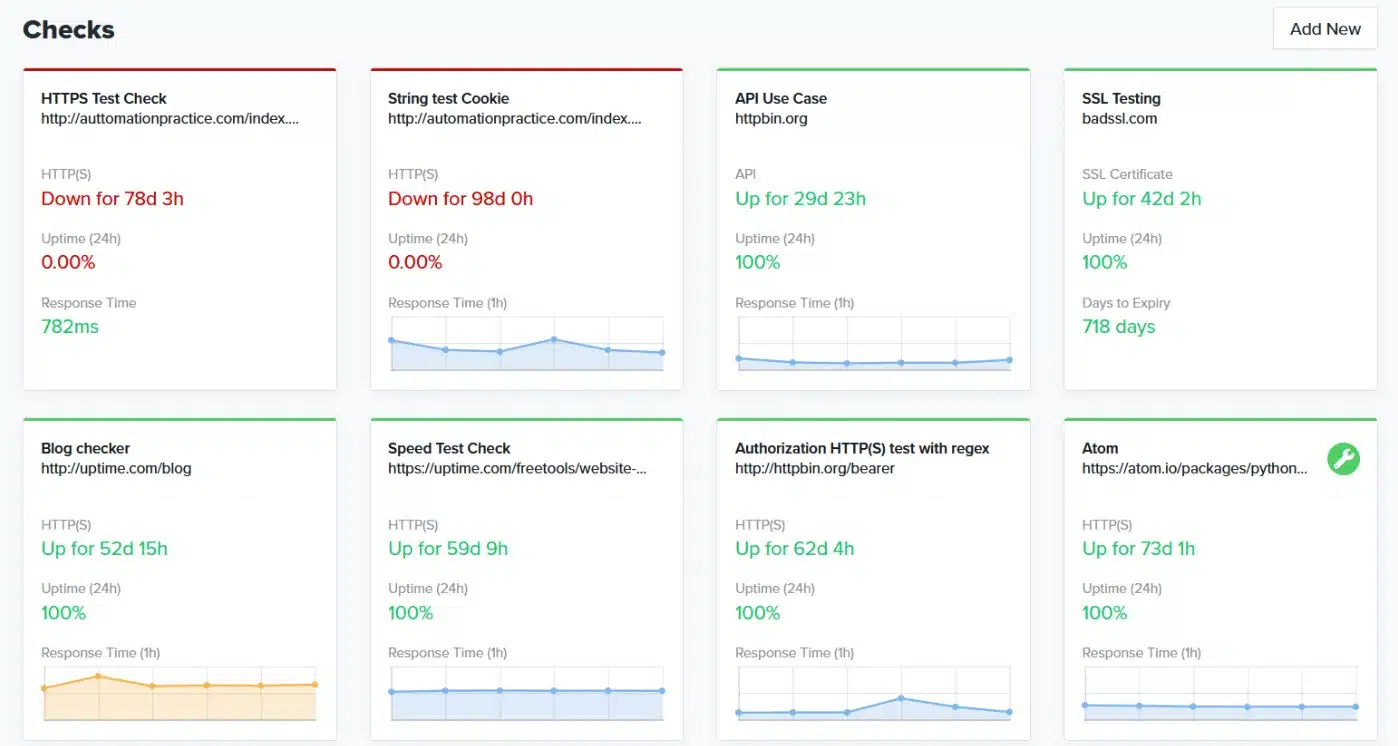
Uptime.com is a web-based service that offers regular uptime checks plus synthetic monitoring and real user monitoring systems. The package is delivered from a choice of 15 testing locations around the globe.
All of the tests performed by the Uptime.com system are automatically documented and its completion reports are visible in the system dashboard – they are also stored on the Uptime.com cloud servers. Summaries of reports are shown in time-series graphs that enable you to quickly see the ongoing availability of your Web assets.
Key Features:
- Automated Uptime Checking Cycle: A Free on-demand option is also available
- Choice of 15 Test Launch Locations: Get response times as well as availability
- Extensive Synthetic Testing: Also real user monitoring
- Performance Analysis: Time-series graphs
Why do we recommend it?
Uptime.com provides availability tests for a given website from 15 different locations – you choose which of the available locations you want to use, and you don’t have to use all of them. The tool also provides details on delivery speed and important load times for different elements in a page.
The Uptime.com system is a subscription service and it is offered in two plan levels: Essential and Premium. Both plans include credit for availability tests, synthetic transaction testing, and real user monitoring with the upper plan having a higher allowance. Both plans also have an SLA reporting feature. The Premium plan also has investigation tools included, such as TraceRoute.
Managed service providers (MSPs) would be interested in the Premium plan because it can have a multi-tenant architecture for managing tests on client accounts. The full list of 15 test launch locations is only available to the Premium edition – the Essentials plan offers five of those locations.
Who is it recommended for?
This service is good for system providers, such as Web hosting services. The consumers of these services would also benefit from using the tool. You can check on the delivery guarantees of hosting services, both as the provider and as the consumer. You would also use Uptime.com when trialing a new hosting service or plug-in feature.
Pros:
- Testing Integration into CI/CD Pipelines: Test the performance influence of changes
- Integrations with Third-Party Systems: Enables different notification channels for test failure
- Data Retention in Cloud Storage: Enables historical analysis
- Alerts for Issues: channel them into your Teams system
Cons:
- Not So Great for MSPs: Multitenant architecture is possible but the support team has to set up sub accounts manually
Uptime.com offers alerts for problems and these can be forwarded as notifications by SMS and voice call. It is also possible to Chanel alerts through team collaboration systems, such as Microsoft Teams and Slack.
The Uptime.com system will store monitoring statistics for six months on the Essentials plan and 2 years with the Premium plan. You can access the Premium plan with a 21-day free trial.
12. Dotcom-Monitor

Dotcom-Monitor provides a series of checks on availability from its cloud platform. The uptime availability plan from Dotcom-Monitor is called Web Services Monitoring. This is one of four plans available from the platform.
Key Features:
- Website Availability Tests: Straightforward Ping
- API Tests: Also browser-launched tests
- 30 Locations: Check on performance from different countries
Why do we recommend it?
Dotcom-Monitor is specifically designed to provide constant tests on website uptime and performance. This system has a plan for a straightforward availability test and also offers a package to monitor specific pages and the interactive elements in them with browser-based tests. The Infrastructure plan watches underlying resource availability.
The Web Services Monitoring plan is primarily an uptime monitor that uses Ping to issue repeated checks on the availability of internet-based assets. The tests are issued for HTTP, HTTPS availability – these are standard methods that make sure that a website is available.
Other tests look at the activities of SOAP and RESTful APIs. If one of these functions goes down, the operations of your key utilities within websites might not be working even though the pages that they are on still seem to be available. Examples of errors cause by API failure could be the shopping cart not working or a popup ad ceasing to function. JSON and XML-based Web services can also be tested by this system.
There might be problems with your SSL certificate that you don’t know about. A big issue with SSL services lies in the fact that Google Chrome will block the pages of your website from loading if there are problems with the certificate. So, making regular automated checks on that SSL certificate is a very important task.
Who is it recommended for?
This is a useful plan for businesses that have websites that are frequently extended or for Web development companies. The operators of stable websites that have been live for a while won’t need the browser-based tests of the Web Page plan but could just rely on the Web Services Monitoring plan’s availability tests.
Pros:
- Monitors Website Traffic: Also monitors supporting infrastructure
- Alert Templates: Set up the form of notification that gets sent
- Can Monitor Page Load Speeds: Alerts to SLA breaches
Cons:
No Free Plan: High price compared to other tools in the market
The Web Services Monitoring package is available for a monthly subscription at a base price. However, the frequency and number of tests that your account will perform depend on you, and the more tests that are launched in a month, the higher the price of the subscription. You can decide to launch tests every minute to five minutes and you have a choice of 30 locations around the world from which the tests will run. You can get a 30-day free trial of Dotcom-Monitor’s services.
13. ITRS Uptrends Synthetic Monitoring
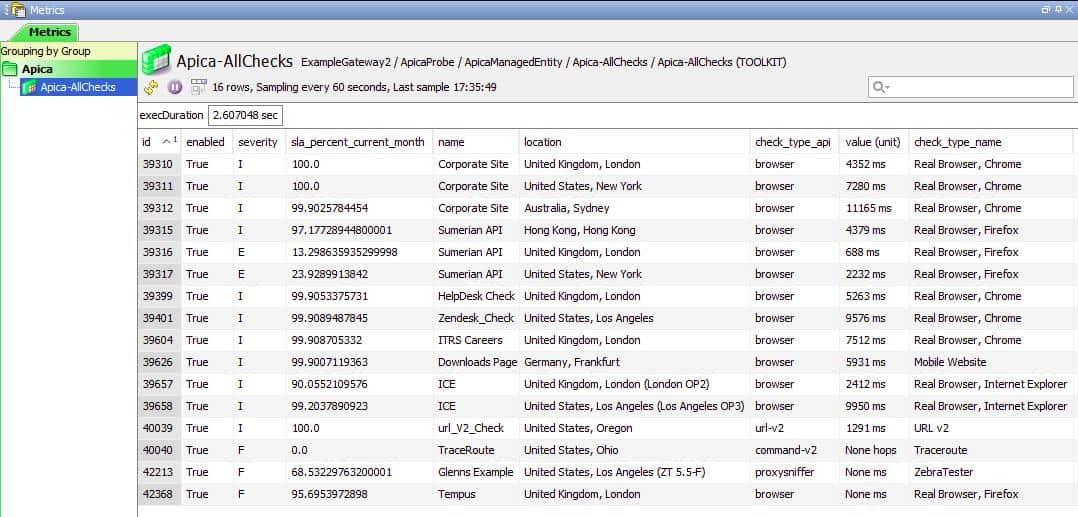
ITRS Synthetic Monitoring is a cloud-based service that launches tests on websites from several different geographical locations. As well as offering automated uptime, load time, and response time checks on a site, the service includes transaction testing features that mimic user journeys through the site. As well as websites, this tool can be used to monitor and test applications and APIs under development.
Key Features:
- Run Tests from Browsers and Mobile Devices: Check on the response times to different equipment
- Alerts for Failed Tests: Sent by voice/phone, SMS, email, or push notifications
- Page Speed Tests: Load time for important elements in a Web page or mobile app
Why do we recommend it?
ITRS Uptrends Synthetic Monitoring has a bigger list of test launch locations than the other services on this list. Possibly its choice of servers is greater than any other uptrends monitor in the industry. You can select from 180 locations in 60 countries. As each Ping costs money, you would need to select carefully and avoid overspending.
The test locations of ITRS Synthetic Monitoring number 180 and are located in 60 countries. The service offers an alerting mechanism that is based on performance thresholds set by the user. These could be set to warn of deteriorating performance that ties in with a service level agreement.
ITRS Synthetic Monitoring doesn’t have a very sophisticated front end. Instead, the company offers integrations with application performance monitors provided by other companies. These include New Relic, AppDynamics, and Dynatrace.
Who is it recommended for?
The ITRS system doesn’t just provide availability tests. You can also get load-time metrics from this system and there are utilities to record and replay site walk-throughs to test interactive components and ensure that the buyer’s journey is properly facilitated. Results displays are very well presented.
Pros:
- Easy to Get Running: Tracks load times, response times, and uptime by default
- Alternative Alert Routes: Notifications can be sent by chat apps, such as Slack, and popular ticketing platforms
- Interactive Tests: Can be run by API
Cons:
- No Price List: No plan details
The alerts issued by ITRS Synthetic Monitoring can be fed through Slack, PagerDuty, or ServiceNow. Another option is to feed performance data through an API into data analysis tools including Splunk and Grafana.
14. Icinga 2
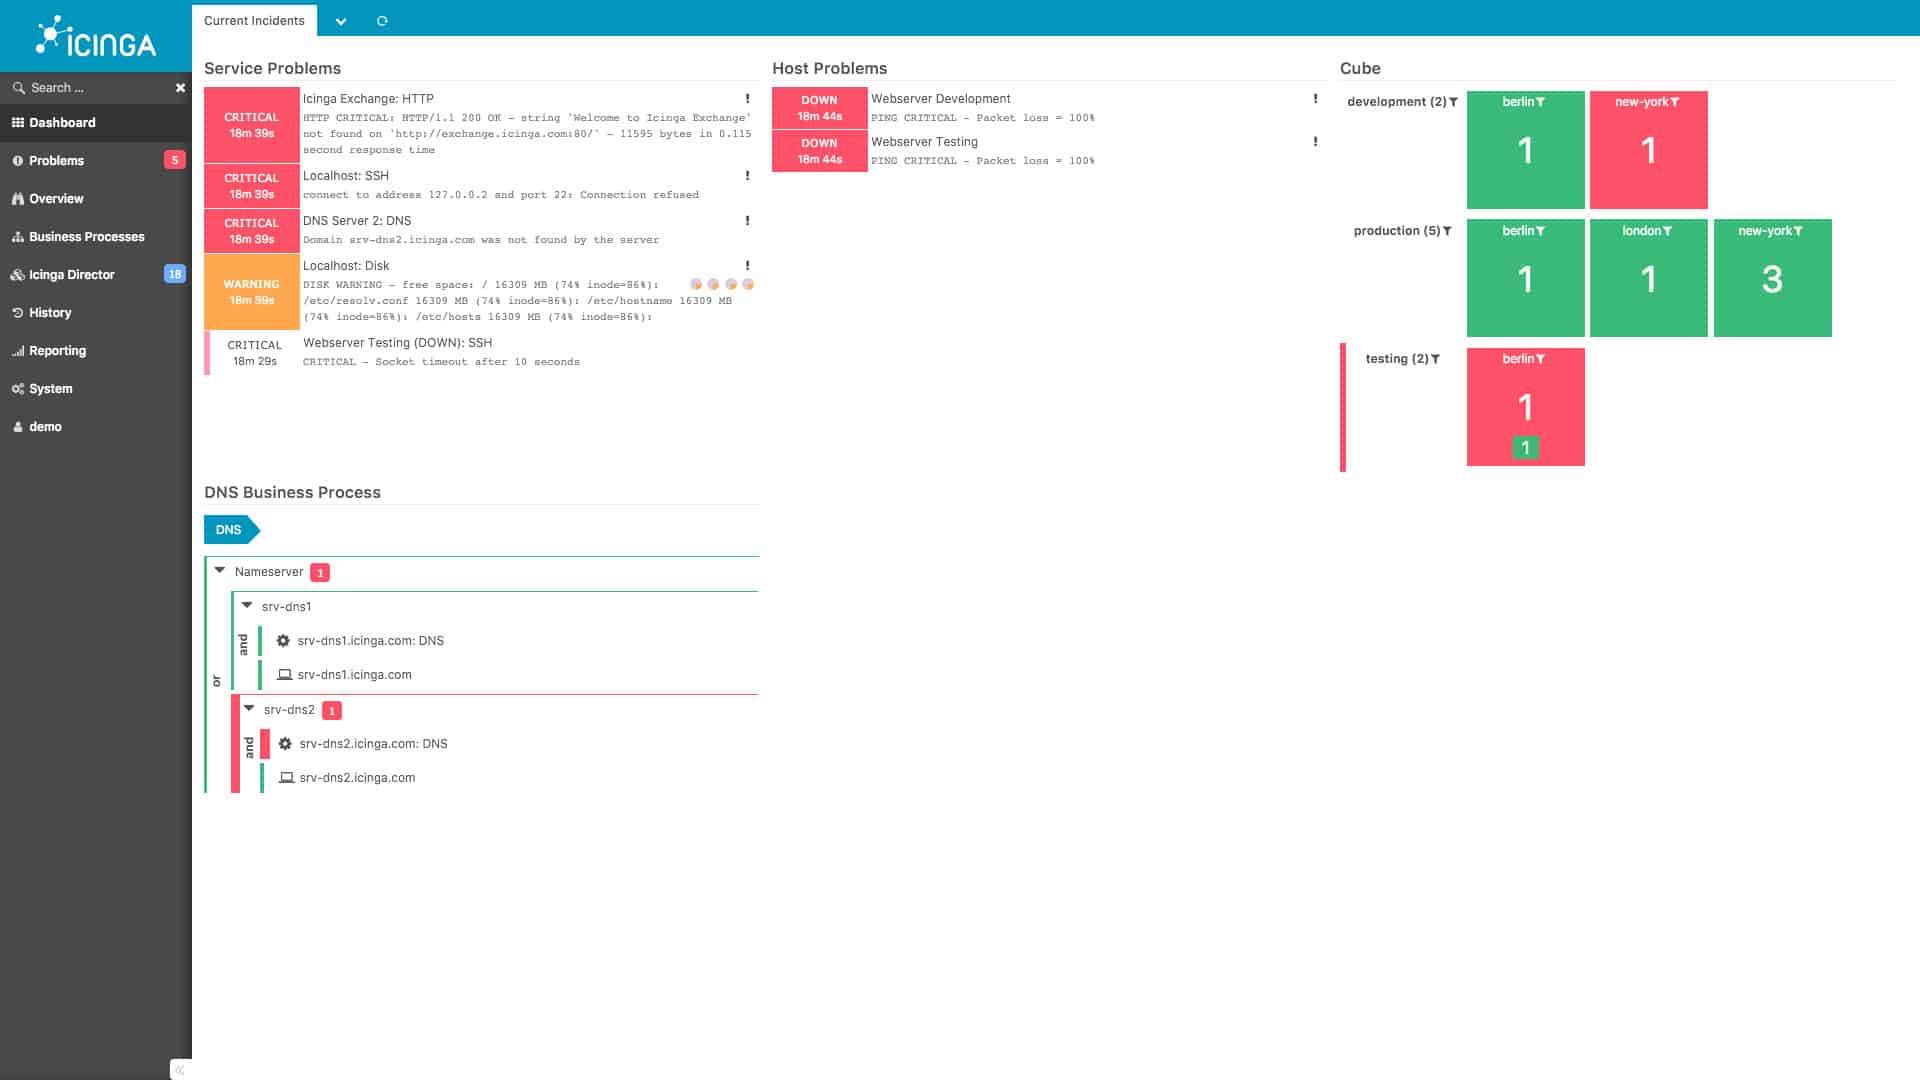
Icinga 2 is a free system monitoring tool that covers networks, servers, and applications. The free tool is actually just the backend of a monitoring system. The group that produces Icinga 2 also offers a browser-based frontend that can be used with Icinga 2 – this is called Icinga Web.
Key Features:
- Free to Use: Based on Nagios
- Tests Based on Ping: Tests connection speeds to endpoints and remote locations
- Community Support: Paid support packages are available
Why do we recommend it?
Icinga 2 is based on Nagios. While Nagios Core is free, its interface is not very good. Nagios XI has a good interface but it is not free. Icinga 2 has a good interface and it is free. This tool gives you live network device availability tests and it takes Nagios plug-ins.
As an open-source system, Icinga 2 is very flexible. However, getting the best out of the monitoring software requires a steep learning curve because you need to become familiar with the system’s coding conventions. The standard reporting screens interface to the analytical engine of Icinga 2 through templates. It is possible to add on screens by locating a template interface command and, if necessary, adapting it.
An example of this process adds on server monitoring through a template that puts uptime service periods on the screen. By editing the Icinga 2 hosts file, that server could be in a remote location. One more piece of code will give you a monitor that focuses on gathering metrics, including uptime reports, on a website. All monitored metrics can have warning thresholds set on them, which generate alerts when tripped.
With the alerts system, you receive notifications by email and text message if any of your systems go down. You also have the option to configure alerts via user or group so that certain members of staff receive certain alerts. This is a useful feature because it allows you to respond to threats promptly when they emerge.
There is also a command-line interface for Icinga 2, called icingacli and the interfaces to Incinga 2’s data-gathering services can be accessed by developers through a RESTful API.
Who is it recommended for?
Anything that you can do with Nagios, you can also do with Icinga 2. Large businesses can subscribe to a professional support package, to make this system insurable. The system’s zero cost will appeal to small businesses and those who can master customizations through templates will get the most out of the full-stack monitoring that this system provides.
Pros:
- Network Discovery: Provides a device inventory
- Continuous Device Availability Tests: Run automatically
- Troubleshooting Tools: Facilities for manual availability tests
Cons:
- Small Businesses Could Find the System Difficult to Set up: The tool isn’t free if you have to pay for a support package in order to get it working
Icinga 2 is available on Debian, Windows, Red Hat Enterprise Linux, SLES, Ubuntu, Fedora, and OpenSUSE. Icinga 2 can be downloaded for free.
Choosing network uptime monitoring software
That concludes our list of the best uptime monitoring tools and software. If you’re operating on a Windows environment then we highly recommend that you purchase Site24x7 Website Monitoring or ManageEngine OpManager Uptime Monitoring. Both of these tools offer a perfect mix of accessibility and in-depth infrastructure monitoring. If you’re on Linux then we recommend you try out Zabbix or Icinga 2 based on their configurability!
Uptime Monitoring Software FAQs
What is the best interval for website monitoring?
The issue of website monitoring testing frequency is a difficult one. Some website owners settle for a check every four hours, while others set the test frequency at 15 seconds. Most testing services increase their price with the requested frequency. So, rapidly repeated tests can end up costing a lot of money. Each test also puts a little load on the host of the website, so a high frequency of tests can impair the performance of the site. As a compromise, aim for a frequency of 5 to 15 minutes. However, if you have a high value site, increase that to a test every minute.
What factors affect the downtime of a website?
The causes of downtime indicate the length of time each outage will last. Four types of system downtime leading to a website becoming unavailable are planned downtime for maintenance, an unexpected system error, a hacker attack or an environmental disaster.
Can I check the uptime of my DNS server?
Yes. Many dedicated uptime monitors include a range of uptime statistics, which includes DNS server availability.

