

A hardware monitoring tool is necessary to catch problems early on and reduce the likelihood of a node or server platform going down.
Here’s our list of the best Hardware Monitoring software (Includes PC):
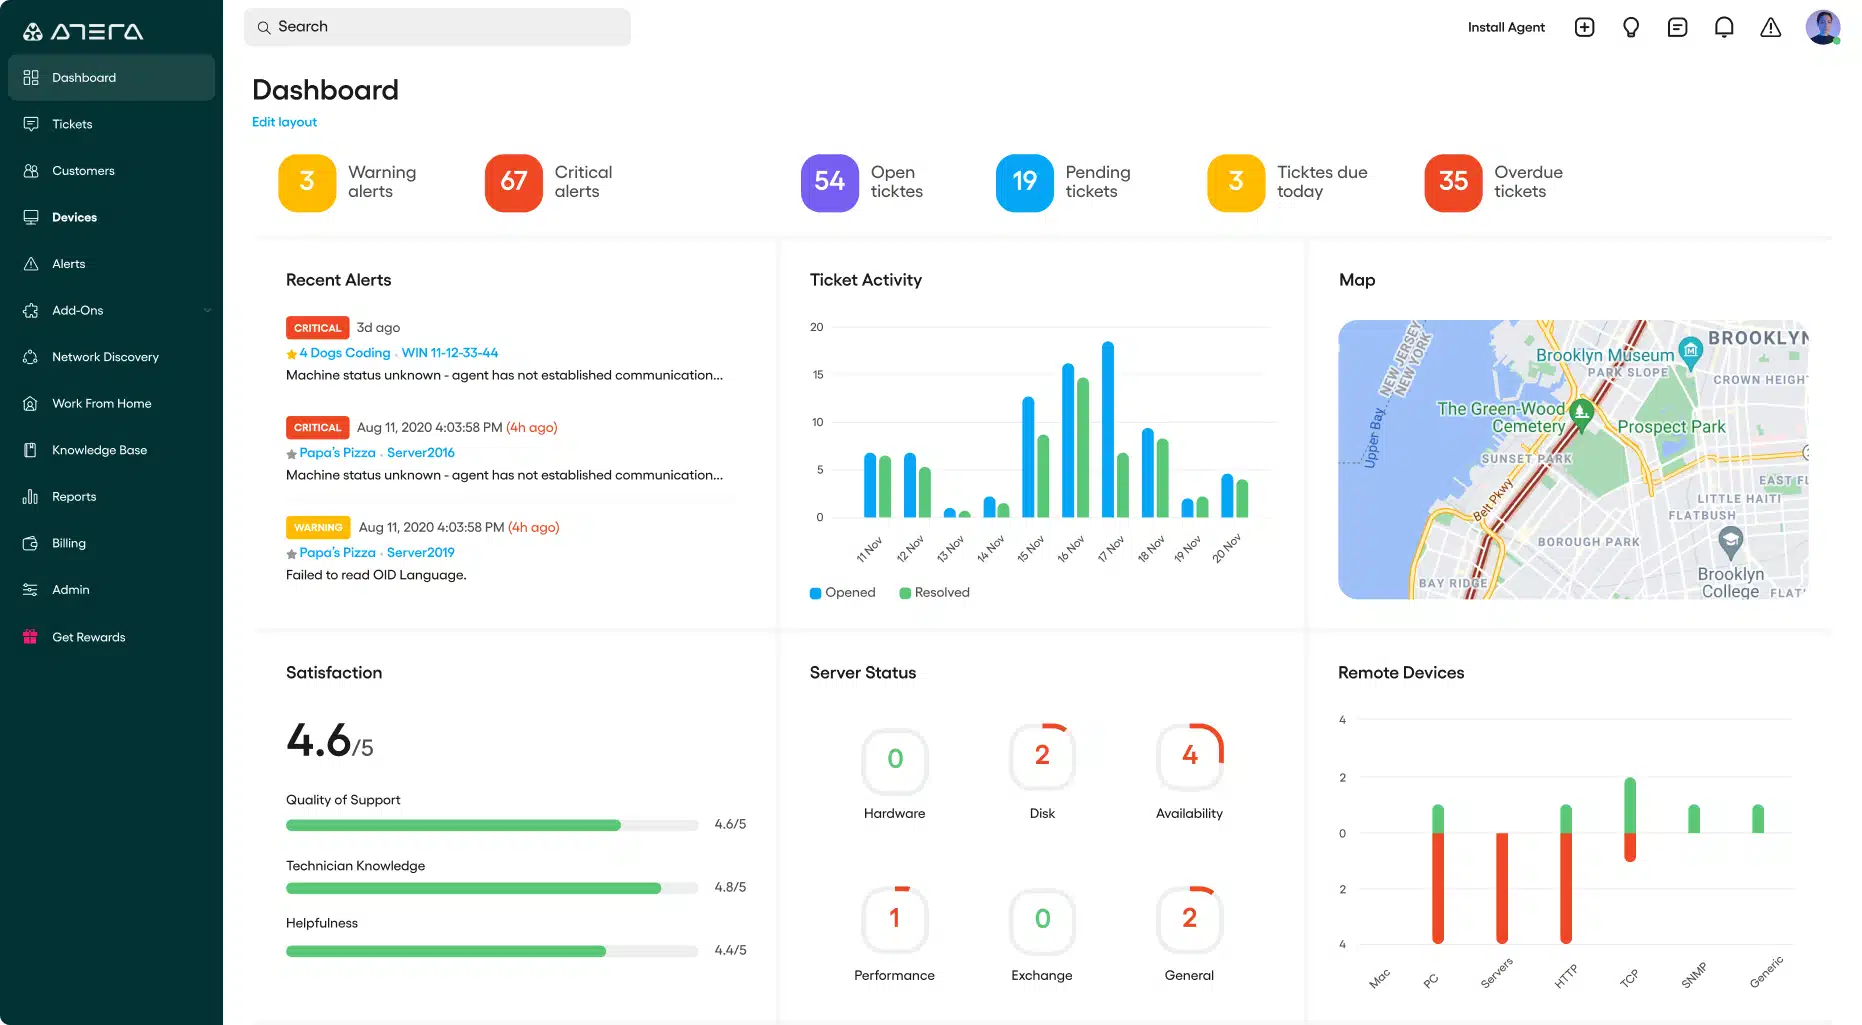
- Atera EDITOR’S CHOICE This all-in-one system monitoring package provides real-time performance tracking for PC and hardware, automated alerts, and comprehensive IT management. It monitors system resources, detects issues, and ensures optimal performance for PCs and servers. Start a 30-day free trial.
- NinjaOne (FREE TRIAL) – formerly NinjaRMM – a remote monitoring and management package that covers all hardware on a business site from the network devices through to desktops and servers. This package also includes processes for managing software and it is a SaaS platform. Get a 14-day free trial.
- Paessler PRTG Network Monitor (FREE TRIAL) A unified network, server, and application monitoring tool that can be fine-tuned by selecting which hardware monitoring sensors to turn on. Start a 30-day free trial.
- FirstWave Open-AudIT (FREE TRIAL) The basis of this system management tool is the automated asset discovery and auditing of all devices on your network. Installs on Windows Server and Linux.
- ManageEngine Endpoint Central (FREE TRIAL) A unified endpoint management system that provides automated onboarding and asset management for desktops, mobile devices, and removable storage. Available as a SaaS platform or for installation on Windows Server.
- Site24x7 Server Monitoring (FREE TRIAL) This cloud service uses the hardware status reporting features of the Simple Network Management Protocol to track all of the equipment connected to the network. Start a 30-day free trial.
- ManageEngine OpManager (FREE TRIAL) The system hardware monitor focuses on the network devices and endpoint equipment in your offices, reporting on a range of physical properties. Runs on Windows Server, Linux, AWS, and Azure. Start a 30-day free trial.
- Datadog Infrastructure Monitoring A cloud-based infrastructure management and monitoring package that includes infrastructure monitoring plus other useful system monitoring utilities.
- TeamViewer Remote Management This cloud-based package offers monitoring of systems no matter where they are located.
- SolarWinds Server & Application Monitor The industry leader from a provider of a suite of infrastructure monitoring tools.
- Zabbix A free, open-source infrastructure monitor with an attractive interface. Installs on Linux.
- CPUID HWMonitor A basic hardware monitoring program. Available in free and paid versions.
- HWiNFO A real-time network hardware monitor that focuses on device statuses. Runs on Windows.
- Open Hardware Monitor Free, open-source hardware monitor software that installs on Windows and Linux.
- AIDA64 A hardware and application monitor packaged in four editions that is aimed at SMEs. Installs on Windows.
- SysGauge Reports on the statuses of all equipment that is connected to the network. Available in free and paid versions. Runs on Windows.
Causes of hardware failure range from malware to old age. Implementing hardware monitoring software is essential for gaining visibility over device performance.
The challenge is that it’s not always easy to spot when any hardware is failing either. Using hardware monitoring software to spot problems early on is critical for staying online.
Server hardware monitoring
The term “server” is used both for a physical computer and for applications. Examples of software systems that are often called “servers” are a “webserver” and an “FTP server.” When looking for server software, it is important to be very clear in your mind exactly what you are hoping to monitor. Virtual servers complicate the concept of a server even further. Virtualization creates a “virtual machine” (VM), which is supported by a server – in this case a software-defined server. Both the VM and the virtual server run on a physical server.
When examining application servers and physical servers, you will be watching different sets of metrics. For a physical server, for example, you will need to watch the power supply, fan speed, internal temperature, and environmental temperature – these might be factors that need to be monitored on the rack rather than the server itself.
Monitoring physical, virtual, and software-created servers requires watching CPU, memory, and disk capacity and usage. In each case, these same titles might be referring to different things. It is possible to reserve memory and disk space for specific applications, so if a virtual server is running out of memory, that doesn’t mean that the physical server that it runs on has no memory to spare.
The best hardware monitoring software – includes PC
Hardware monitoring software provides you with a centralized platform to monitor the health and performance of connected devices. These tools offer visual displays that highlight faults with notifications and alarms.
Our methodology for selecting PC and hardware monitoring software
We reviewed the market for PC and hardware monitoring software and analyzed the options based on the following criteria:
- A system that includes device discovery routines that relaunch constantly
- A software scanning tool that creates an inventory
- Constant availability checks for all devices connected to a network
- Options for remote management across the internet
- Event logging features for data protection standards compliance
- A free trial period or money-back guarantee for assessment
- A good mix of tools that reduces costs and justifies its price
1. Atera (FREE TRIAL)

Atera is a system monitoring platform created especially for managed service providers (MSPs). The service is delivered from the cloud, removing almost all hardware requirements from the MSP’s own site. Access to the console of the system, both for MSP managers and their technicians is made through any standard web browser. Atera also produces free apps to enable customers to get to its system from mobile devices.
Key Features:
- Remote Access: Each subscription includes a license for AnyDesk and/or Splashtop.
- Atera AI: Atera AI is a super-smart assistant that monitors everything across the system to ensure productivity.
- Network Discovery: Performs real-time security scans of your network to detect potential attacks or vulnerabilities.
- Remote Monitoring and Management: Monitor and manage an unlimited number of devices for a fixed rate, anytime, anywhere.
- Per Technician Pricing: Suitable for all sizes of businesses.
Why do we recommend it?
Atera offers remote monitoring and management systems for multiple sites and it includes an autodiscovery function and a hardware inventory service. It provides automated performance monitoring that includes hardware status tracking. The Atera system will raise an alert if endpoint resources start to run short, which enables technicians to get on with other tasks, knowing that no news is good news.
The service checks on the statuses of network devices, endpoints, and physical or virtual servers. In addition to hardware monitoring, Atera is also able to track and improve the performance of applications, such as databases and web and email servers.
As a cloud-based service that supports remote access, Atera can deliver connections to any customer resource, including cloud-based AWS or Azure servers – The Atera system is actually resident on Azure servers. The monitored system just needs an agent installed on it.
Atera includes a Help Desk portal, which gives technicians remote access to endpoints for investigation and problem solutions. The package also includes a remote desktop service that lets the endpoint user watch the actions of the technician.
Who is it recommended for?
The Atera system is offered in two versions – for IT departments and for MSPs. As such, it is a competitor for Endpoint Central and NinjaOne. As with most system-wide monitoring packages, Atera focuses more on software activity than hardware statuses.
Pros:
- Scripting: Users can automate tasks using scripts and make their repetitive tasks easier and faster to complete.
- Device Management: Allows you to efficiently manage and monitor all of your devices from one single platform.
- Service Desk: Users can manage customer requests, track issues, and give timely responses to this service desk function.
- Ticket Prioritization: Users can choose to prioritize tickets based on their level of urgency, such as low, high, or critical, and solve the critical problems first.
- Hosted System: No need to download or manage the Atera software.
Cons:
- Less Menus: Some users say that Atera’s interface offers fewer menus or options than other similar platforms and find sophisticated functionality.
Customers of Atera don’t need to pay for the software upfront, which is a big advantage for independent freelance support specialists and is very appealing to startup MSPs. Instead, the MSP pays a subscription per technician. This pricing model makes Atera suitable for MSPs of all sizes, and it is particularly interesting for rapidly expanding service providers. When an MSP gets to full capacity and hires new staff, it just needs to add on the appropriate number of Atera subscriptions to get those new technicians fully tooled up. The Atera subscription also includes processing power and storage on cloud servers, so it is a very cost-efficient deal. Annual pricing starts at $129 a month per technician. You can try out the Atera system on a 30-day free trial.
EDITOR'S CHOICE
Atera is our top pick for a PC and hardware monitoring tool because it combines comprehensive functionality with ease of use, and per-technician pricing, making it ideal for IT professionals and managed service providers (MSPs). Atera provides a unified platform that simplifies the monitoring and management of PCs, servers, and hardware across multiple locations, ensuring that IT environments remain efficient and secure. One of Atera’s standout features is its remote monitoring and management (RMM) capabilities. It continuously tracks the health and performance of hardware, including CPU usage, memory, disk space, and temperature. These metrics are displayed in intuitive dashboards that provide real-time visibility into system health, enabling proactive problem-solving. With automated alerts, administrators can address potential issues, such as overheating or low storage, before they impact end users. Atera is also known for its all-in-one design, integrating tools for patch management, software deployment, and ticketing. This holistic approach reduces the need for multiple software solutions, streamlining IT operations. Its cloud-based architecture ensures that users can access monitoring tools from anywhere, making it particularly effective for distributed teams and remote work setups. Atera offers integrations with popular third-party tools, enhancing its flexibility.
Download: Get a 30-day FREE Trial
Official Site: https://www.atera.com/signup/
OS: Cloud-based
2. NinjaOne (FREE TRIAL)

NinjaOne – formerly NinjaRMM – is a SaaS package of system monitoring and management tools. This platform is designed for use by the technicians of managed service providers (MSPs). However, the package can also be used by the It Operation departments of multi-site businesses. This bundle includes manual and automated tools that can manage network hardware, desktops, and servers. It also includes procedures to manage software.
Key Features:
- Unify Device Management: You can monitor Windows, Mac, Linux, servers, virtual machines, or networking gadgets and control them all from a single interface.
- Automate Time-Consuming Tasks: Due to its speedy patching process, users can get the things done quickly with the help of automation and instant fixes to problems.
- Drive Radical Efficiency: It helps technicians provide support and fix problems more quickly.
- Support Any Device, Anywhere: You can manage any internet-connected device securely, whether it’s in the office, at home, or somewhere in between.
Why do we recommend it?
NinjaOne is able to monitor and manage remote systems. This includes its service for monitoring the hardware of endpoints and also the software that runs on it. The tool provides alerts for issues such as overloaded CPUs or memory exhaustion, which enables support technicians to take action in order to lower the load on each device.
The NinjaRMM service includes a discovery routine that identifies all devices connected to the network and logs them in a hardware inventory. This service operates continuously, so any new hardware added to the network will immediately be recognized.
The hardware monitor works on an alerting mechanism. This is particularly focused on resource utilization and operates through a series of thresholds on specific indicators. Examples of the types of attributes that thresholds monitor are CPU utilization, available disk space, and switch memory availability. If a threshold is tripped, the NinjaOne service will generate an alert in the form of a notification that is routed to a technical team member through the integrated ticketing system.

Who is it recommended for?
NinjaOne is an RMM system for managed service providers (MSPs). Its selling point is that it enables the MSP to squeeze the maximum value out of each technician. This enables an MSP to bid competitively for contracts. While the system would also work well for the central IT departments of multi-site organizations, the multi-tenant architecture of NinjaOne would only be of use to MSPs.
Pros:
- Built-in Ticketing System: Its built-in ticketing system helps to assign and manage multiple tasks without any manual work and help you stay organized.
- Automatic System Performance Monitoring: Automatically keeps an eye on system performance to prevent technical glitches.
- Adjustable Notification Service: The NinjaOne notification service allows you to set custom resource usage criteria. As a result, you are only notified when anything urgently requires your immediate attention.
- Comprehensive Monitoring Package: It manages your network, endpoints, and software in one location; hence, you don’t need any other tools for different activities.
Cons:
- Not Ideal for Linux Monitoring: It is not as well suited for monitoring Linux as it is for other systems. So, if Linux is your thing, then this tool might not suit your monitoring requirements.
As a SaaS package, NinjaOne doesn’t require any software to e installed on your site. However, the monitored location needs agents installed. The dashboard is accessed through any standard web browser from anywhere. The company doesn’t publish a price list, so you need to request a quote. NinjaOne is available on a 14-day free trial.
3. Paessler PRTG Network Monitor (FREE TRIAL)
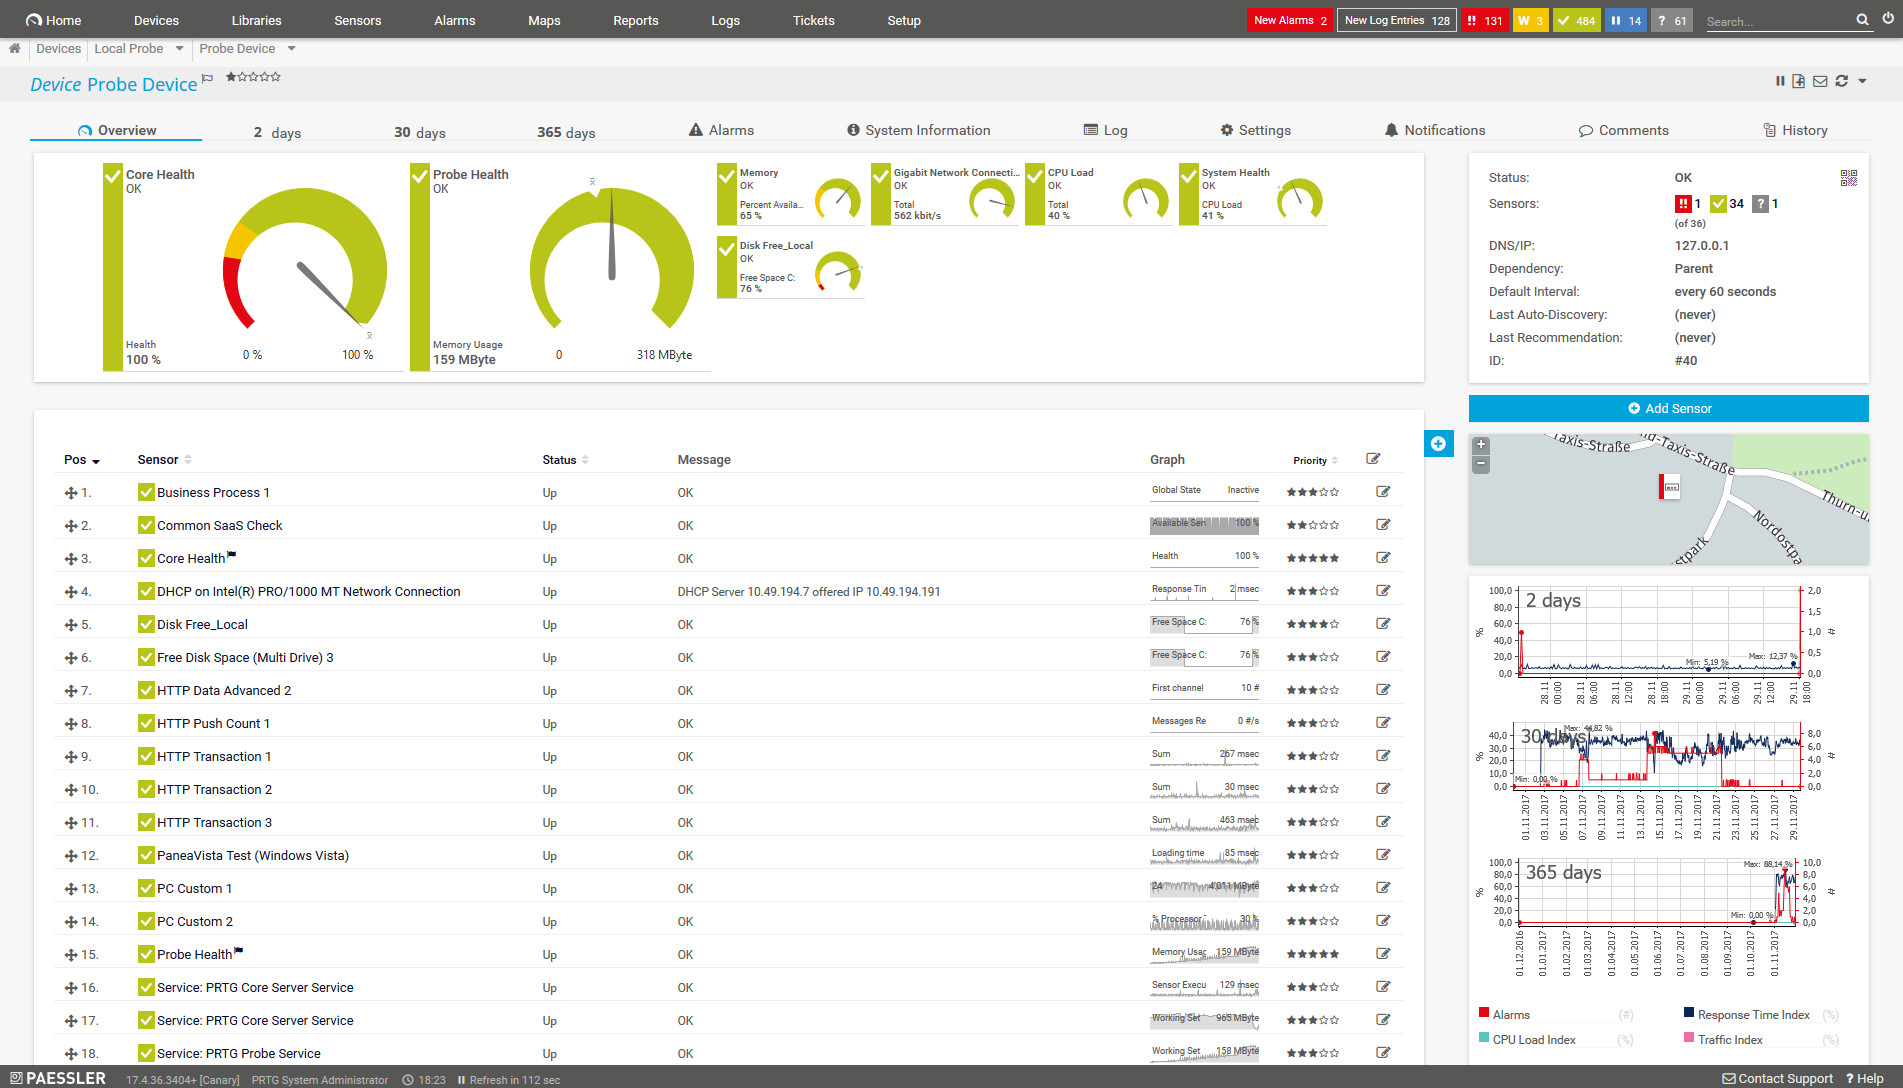
Paessler PRTG Network Monitor is another hardware monitoring tool that strikes the balance between depth and accessibility. With PRTG Network Monitor you can monitor the CPU, RAM, and hard drives of network devices. The software supports products from vendors including IBM, Cisco, Dell, Synology, and Linksys. All performance data can be viewed instantly through the on-screen dashboard.
Key Features:
- Real-Time Hardware Monitoring: Monitors your network’s hardware in real-time, ensuring every server and computer is up and running smoothly.
- Diverse Hardware Compatibility: Supports hardware from top manufacturers like IBM, Dell, HPE, Cisco, Synology, Fortinet, and Linksys; hence, it will work fine on almost every device.
- Proactive Performance Management: It alerts you about issues like memory leaks or disk space shortages before they turn into major headaches to make sure you have optimal performance.
- Hardware Reporting and Analytics: Monitors and reports on critical hardware indicators such as CPU load, memory capacity, and disk space consumption.
Why do we recommend it?
Paessler PRTG is a very flexible system because you decide which of the many monitoring tools in the package you want to turn on. There is an autodiscovery cycle in PRTG that forms the core of the service and creates hardware and software inventories. Sensors in the bundle include hardware monitors.
However, you don’t have to stay glued to the computer just to know what is going on. PRTG Network Monitor has an alerts system that sends you a notification via email or SMS if there is a problem in your environment. For example, you can configure critical alerts to be sent if disk space drops too low.

The setup process with this tool is also quite straightforward. You can set the program to ping IP ranges to find devices connected to your network. You can also build maps of your network with a drag-and-drop editor if you want to troubleshoot from a geographical perspective.
Who is it recommended for?
The PRTG package is almost a self-assembly system and you pay for the number of sensors that you want to turn on. The smallest unit you can buy is for 500 sensors. If you only use 100 sensors, you never have to pay. This makes the tool very suitable for businesses of any size.
Pros:
- Maintenance for Server Stability: Keep your server’s hardware components in excellent shape. This reduces network disturbances and keeps your servers working smoothly.
- Diagnose Network Issues: It continuously monitors hardware like servers, printers, routers, and switches and shows visual data through maps and dashboards.
- Prevents Hardware Issues: The software is ideal for keeping hardware concerns under control. You don’t need continuous IT management.
- Automate Routine Tasks: PRTG automates repetitive operations, allowing IT workers to concentrate on more important topics rather than continually monitoring hardware status.
Cons:
- Limited Vendor-Specific Sensors: While PRTG offers monitoring for various hardware brands, some users may find the selection of vendor-specific sensors lacking.
PRTG Network Monitor operates a flexible pricing scale depending on the number of hardware sensors you want to use. The tool is free for less than 100 sensors but beyond that point, you will have to pay. Paid versions of PRTG Network Monitor start at $1,750 (£1,321) for 500 sensors and 1 server installation. There is also a 30-day trial.
Related: CPU Temperature Monitoring Tools
4. FirstWave Open-AudIT (FREE TRIAL)

FirstWave produces a range of IT system monitoring and management tools and Open-AudIT is the hardware and software inventory management module in the suite. The first task that this auditing tool will perform is a network sweep, automatically discovering and auditing each device for hardware, software, services, and operating systems.
Key Features:
- Automated Configuration Change Tracking: Track and monitor any modifications to your IT asset setup. It tracks everything, from software licensing to device warranties.
- Controlled Role-Based Access: Works well with LDAP-based systems such as Active Directory. You can grant specific permissions to various individuals based on their roles.
- Configuration Baselines: The user can evaluate software, hardware, user data, and even netstat information to your predefined standards.
- Software Licensing Management: You don’t have to worry about your software license because it keeps historical snapshots for easy comparison.
Why do we recommend it?
FirstWave Open-AudIT provides device discovery, hardware warranty management, capacity logging, and utilization tracking for hardware as well as many services for monitoring and managing software. The discovery process in the package rescans the network constantly, so your hardware inventory is kept constantly up to date.
The Open-AudIT service operates as a configuration manager. It takes an image of each device’s settings and then stores it. The asset discovery sweep can be scheduled to suit any cadence, with each device audit, the service resamples the device’s configuration and reports on any changes. Another security benefit of Open-AudIT is that it can spot unauthorized devices connected to the network.
![]()
All results of system scans are stored in a database, so they can be referenced at any time. As well as creating and managing a hardware and software inventory, the Open-AudIT system produces scheduled audit reports. The dashboard for the system shows live scan results and offers historical data analysis tools.
Who is it recommended for?
This tool is a good option for IT departments. Other tools on this list that compete well with Open-AudIT are mainly designed for use by MSPs. The closest alternatives to Open-AudIT for use by IT departments are Endpoint Central, Paessler PRTG, and Zabbix. However, of those other IT department systems, only Endpoint Central includes a configuration management tool that matches the functionality in Open-AudIT. A Free edition to manage up to 20 devices makes this system attractive to small businesses.
Pros:
- Tailored Email Reports: You can decide what email reports you want to see by filtering so you only get reports that are relevant to you.
- Role-Based Access Control: You are able to customize permissions for individual users and even create specific business hours rules.
- Comprehensive Device Tracking: It monitors every device on your network and activities like modifications, additions, and removals.
- Capacity Tracking for Smart Decisions: Sysadmins can take smart decisions with the help of this tool. It helps to track inventory and make network changes based on actual usage.
Cons:
- Learning Curve: You may take some time to understand all of its features and functionalities.
FirstWave markets the software for Open-AudIT on an annual license. The package is available in versions to run on Windows Server and Linux and it can also be run as a virtual appliance over a hypervisor. The service is available in two editions: Professional and Enterprise. Each package is priced according to ranges of node numbers to be scanned. Open-AudIT is offered for free to manage up to 20 nodes which is ideal for evaluating the product.
5. ManageEngine Endpoint Central (FREE TRIAL)
ManageEngine Endpoint Central is a unified endpoint management (UEM) for corporate fleets of desktops and mobile devices. This system also looks after removable storage and will watch over the hardware and software assets of your business.
You can start your device management automation with Endpoint Central by defining and storing a standard setup per device type. This can be achieved by selecting an example device, cleaning up its configuration, and taking an image of it. From then on, you onboard devices of the same type by applying the image. This can be implemented in bulk, saving a lot of time.
Key Features:
- Automatic Patching: Automatic patching helps save resources and time and prevents downtime due to the deployment of faulty patches.
- Threat Detection and Remediation: It identifies vulnerabilities based on their seriousness and risk factors; users can check for vulnerabilities via the dashboard and isolate active threats.
- Ransomware Protection: Users can check unauthorized modification of files and analyze the complete incident to get an idea of whether it is real or false.
- Unauthorized Device Restriction: The tool actively keeps monitoring files and prevents unauthorized access inside the network.
Why do we recommend it?
ManageEngine Endpoint Central is a comprehensive bundle of monitoring and management tools. It is a good package for local system monitoring and for multi-site management. The hardware monitoring services in the package include a recursive discovery system that creates hardware and software inventories. An alerting system provides automated monitoring and there are also system management tools in the package.
During ongoing service, the tool manages your software inventory and lets you create profiles that specify which software should be made available for which user groups. This software package installation can be implemented automatically as part of the onboarding process. Constant checks on the availability of updates trigger a patch manager that is part of the package.

Hardware warranty tracking and software license management are part of Endpoint Entral’s services. So, are asset tracking and configuration management. The tools in the service provide remote access with a remote control function. This is able to access devices that are in sleep mode or turned off and it can also shut down or restart devices.
Who is it recommended for?
Like Atera, Endpoint Central is available in versions for use by IT departments and managed service providers. The marketing of the two systems is a little different because Atera targets MSPs and then offers a version for IT departments, while ManageEngine markets its package first for IT departments. A Free Edition of Endpoint Central will appeal to small businesses that have up to 25 endpoints to manage.
Pros:
- Endpoint Privilege Management: It secures your sensitive data from end to end point to prevent insider threats by continuously monitoring apps and ensuring privileges.
- Remote Troubleshooting: You can remotely fix issues by easily connecting to the end user via advanced tools.
- Configuration Management: This involves making sure that configuration is updated as per policies and industry standards.
- Secures your Browser: Browsers are easy to attack, so you need advanced security to secure them. This tool monitors browser add-ons, extensions, and plugins installed across your infrastructure.
Cons:
- Delayed Support: Many users find that the help and support are delayed because of various time zone differences.
There are four versions of Endpoint Central: Free, Professional, Enterprise, and UEM. The Free edition allows you to manage 25 devices. The Professional edition has all of the features of the Free editions – some of them are paid extras – but it can manage more devices. Move up to the Enterprise edition for WAN coverage, and you need the UEM version to get OS deployment and a unified approach to desktop and mobile management/ This system is offered as a SaaS platform but you can download it onto Windows Server. Assess the system on a 14-day free trial.
6. Site24x7 Server Monitoring (FREE TRIAL)
Site24x7 Server Monitoring is part of a cloud platform of services that provides packages of tools that include network server, and application monitoring. The system uses the Simple Network Management Protocol (SNMP) to monitor network devices. However, PCs and servers also have SNMP agents pre-installed on them. If you activate these agents on your endpoints, every SNMP sweep by the network device monitor will also pick up status reports from those computers.
Key Features:
- Website Monitoring: You can ensure zero complaints for your website downtime because this tool will actively monitor IPv4/IPv6-enabled websites from relevant customer locations to ensure your server is always up.
- Synthetic Monitoring: The user can record the necessary transactions and activities to analyze the performance and work on critical functionality.
- Digital Experience Monitoring: The user can create specific rules for application performance to make sure it is performing well on all channels.
- Uptime Monitoring: it does not give false alerts, this tool monitors your website 24*7 to have uninterrupted and smooth network performance.
Why do we recommend it?
The Site24x7 Server Monitoring system provides tracking of capacity and utilization of all of the resources provided by endpoints. Simultaneously, through its companion network monitoring service, this package receives alerts if any hardware component of the computers on the network develops faults. The package also monitors the applications running on the endpoints.
The Site24x7 console allows users to compose their own screens. This will let you put both server resource graphs and SNMP hardware status reports on the same page. The package also includes a system of alerts, which are triggered by a series of performance thresholds. You can activate and adjust existing alert triggers or create your own. Alerts appear in the dashboard and you can elect to get them forwarded to technicians by email, SMS, voice call, or Slack message.
Who is it recommended for?
This platform groups network, server, and monitoring services in subscription plans. All of the plans include server monitoring and SNMP data collection, so you can easily monitor PCs and hardware with the service. Plans are sized for small businesses with expansion supplements for larger companies.
Pros:
- Measures Critical KPIs and CPU Usage: It monitors all input and output traffic of the network to make sure the health of the server is updated.
- Detects Specific Processes and Attributes: This tool identifies hogging resources to pinpoint the particular process or attributes causing issues across the server.
- Web Page Speed Monitoring: It includes analyzing all components of the webpage such as AJAX requests, CSS, images, third-party websites.
- Location Monitoring: Site24x7 has its own global network monitoring system that supports servers in 130 geographical locations. The system monitors visitors’ IP addresses and unauthorized access.
Cons:
- Lacks in Some Configurations: The user finds that it lacks in multiple configurations for monitors and requires more integrations for incident management.
The Server Monitoring system is included in all the plans offered on the Site24x7 platform. There is also a version for managed service providers to use in monitoring the equipment of their clients. You can assess any Site24x7 plan with a 30-day free trial.
7. ManageEngine OpManager (FREE TRIAL)

ManageEngine OpManager is designed to help IT professionals maintain and optimize their network and hardware infrastructure. It provides real-time monitoring of critical hardware components, including servers, routers, switches, and other network devices, allowing IT teams to track the health and performance of all devices in their network. The hardware metrics that the package tracks CPU usage, memory, disk health, and temperature, preventing downtime and ensuring optimal performance across your infrastructure.
Key Features:
- Automated Network Discovery: Identifies devices and network components as they are added to the infrastructure.
- Network Topology Mapping: Visually represents the entire network infrastructure, including hardware and devices.
- Real-Time Hardware Monitoring: Watches critical hardware components, including such as CPU usage, memory, disk health, and temperature, in servers, workstations, routers, and switches.
- Customizable Alerts & Notifications: When a component, such as a hard drive or CPU, exceeds predefined limits, the tool sends automatic notifications via email or SMS.
Why do we recommend it?
ManageEngine OpManager is a fully automated system – it sets itself up and n then continuously scans all of the hardware that is connected to the network. It checks the performance of each device as a whole and also records the activities and statuses of each component of the device.
The tool includes customizable alerting and notifications, ensuring that IT teams are immediately informed when hardware components reach critical thresholds. Whether it’s a failing hard drive, high CPU utilization, or overheating, OpManager sends automated alerts via email or SMS to ensure a swift response. These alerts help prevent unplanned downtime by enabling IT administrators to address potential problems proactively.
Who is it recommended for?
This tool is recommended for IT administrators, network engineers, enterprise IT teams, and managed service providers (MSPs). Its scalable architecture, real-time hardware monitoring, automated alerts, and customizable reporting make it ideal for businesses of all sizes looking to optimize network performance, minimize downtime, and improve system reliability.
Pros:
- Scalability and Integration: Suitable for both small businesses and large enterprises. It can be integrated with other ManageEngine products as well as third-party applications.
- Customizable Dashboards: The tool provides users with highly customizable dashboards for personalized views of the network and hardware status.
- Advanced Fault and Performance Management: Tracks network performance in real-time, offering in-depth diagnostics for potential hardware failures.
- Comprehensive Reporting and Analytics: Help IT teams analyze historical performance data, identify trends, and generate reports on hardware health, usage patterns, and network performance.
Cons:
- No SaaS Option: This is an on-premises package and you can upload it on a cloud account.
OpManager is available in three plans: Standard, Professional, and Enterprise. The Standard edition includes all of the hardware monitoring features, so you don’t need to go up to the higher plans if you are only interested in PC component monitoring. The system is available for installation on Windows Server, Linux, AWS, and Azure. The package is offered for a 30-day free trial.
8. Datadog Infrastructure Monitoring

Datadog is a system monitoring and management service that is based in the cloud. The base package of Datadog is called Infrastructure and it monitors hardware as well as service performance. The Datadog system is packaged into modules and the more modules you get, the more control you have over your system. The modules link together to produce better visibility of what is going on in your IT resources. Other modules offered by Datadog include Security Monitoring, Network Performance Monitoring, Application Performance Monitoring, and Log Management.
Key Features:
- Comprehensive Metric Tracking: Keep eyes on tens of thousands of infrastructure metrics effortlessly with pre-built monitoring capabilities.
- Continuous Historical Records: Even if infrastructure components are no longer in use, you can still access continuous historical records. This means you can analyze past performance even for assets that are no longer active.
- Limitless Metrics: Choose which metrics are critical to your queries and modify indexing as necessary. You can change your mind at any time, ensuring that you record the most important data.
- Cloud Infrastructure Monitoring: Conduct continuous configuration checks across your cloud accounts, hosts, and containers to improve security across your cloud infrastructure.
- Advanced Collection Capabilities: Live process monitoring allows you to collect insights into every process running within your stack.
Why do we recommend it?
Datadog Infrastructure Monitoring is a cloud-based package that watches over all of the services that a business uses between user-facing systems and the network. That remit includes server resources. As it is based in the cloud, the Datadog platform isn’t tied to a specific site, so you can monitor servers on many sites within the same account.

Features in the infrastructure module include autodiscovery, so you don’t have to spend time setting up the monitor with a list of your hardware. The tool will also monitor your system’s performance, enabling you the option of remapping your resources to make better use of existing hardware.
Who is it recommended for?
The Datadog system is very scaleable because it is priced per host. The ability to track servers on multiple sites is another advantage for the business when marketing to a wide audience. A Free edition allows the monitoring of up to five hosts, which is an attractive offer for small businesses.
Pros:
- Streamlined Cloud Deployment: It has a fast cloud deployment process hence you can quickly use it without paying for any hardware costs.
- Supports Individual and Total Device Monitoring: The main concern is infrastructure’s health and performance, this tool supports both individuals and total device monitoring.
- Intuitive User Interface: Datadog has an easy-to-use platform; hence, it is easy for users to navigate the platform, configure monitoring settings, and interpret data effectively.
- Live Network Mapping: Allows users to visualize intricate networks of devices, understand the relationships between different components, and identify potential issues.
Cons:
- Scalability and Performance Challenges: It is found that Datadog can be inaccurate when the amount of data is extremely large while maintaining high-performance standards.
The Infrastructure module of Datadog is available in three plan levels, the cheapest of which is the Free plan. The two paid plans are called Pro and Enterprise. The Enterprise plan has more features and is more expensive than the Pro plan. Utilities in the Enterprise plan include machine learning for the creation of alert threshold levels and the examination of live processes. The Enterprise tool also includes security monitoring and forecasting features. Both the Pro and Enterprise plans of Datadog Infrastructure are available for free trials.
Related: CPU Monitoring Guide & Tools
9. TeamViewer Remote Management
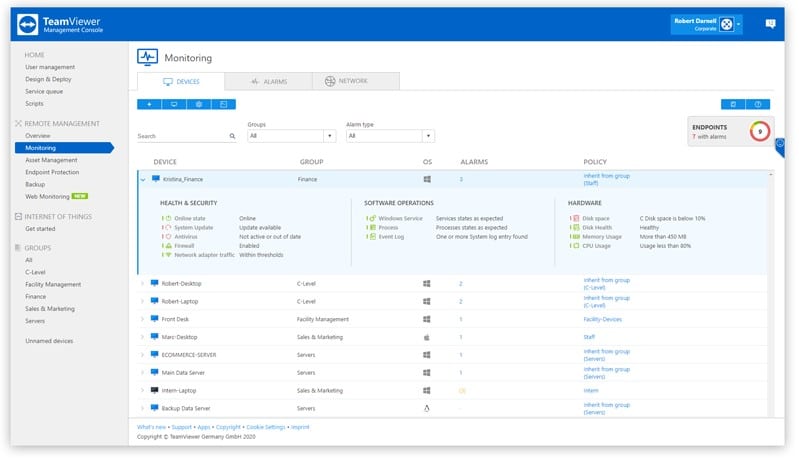
TeamViewer is a widely-used remote desktop system and its providers have expanded their stable of services in recent years. TeamViewer Remote Management is one of those new packages. This package includes monitoring services for endpoints and networks devices plus asset management functions.
Key Features:
- Asset Management: With the help of comprehensive visibility into your infrastructure, you can manage and monitor your assets efficiently.
- Mobile Device Management: Onboard, manage, and monitor mobile devices seamlessly, ensuring security and compliance across your mobile fleet.
- Remote Device Monitoring: You can detect your issues at an early stage in your IT infrastructure so that you can take immediate action to resolve issues before they impact productivity.
- Remote and Cloud Backup: It also supports cloud and remote backup to keep sensitive data safe with secure storage of files and folders.
Why do we recommend it?
TeamViewer is primarily known as a remote access system and the company has expanded its services through to full system monitoring with its Remote Management package. The Device Monitoring module is where you will encounter the hardware monitoring part of TeamViewer Remote Management. This system focuses on CPU, memory, and interface capacity and utilization rather than physical hardware statuses.
As a remote monitoring system, this package is able to track the performance of remote sites and the individual devices used by work-from-home staff. The first line of monitoring tests device availability and then tracks through activity statistics. All of this information is shown live in the console for TeamViewer Remote Management and the data is also stored for historical analysis. You will see performance overviews for all of your infrastructure and get paths to drill down and see the activity on each individual device.

Who is it recommended for?
Many businesses use TeamViewer for remote access to endpoints and the adoption of this remote monitoring and management package would be an easy step for those enterprises. There are versions for IT departments and for managed service providers.
Pros:
- Patch Management: It includes automated patch management so you can evaluate, test, and apply OS and third-party application patches automatically.
- Behavioral Pattern Checks with Machine Learning: Identify potential threats by analyzing patterns and behaviors using machine learning.
- Malware Protection: This tool will identify and block malware attempts to prevent your organization from security breaches.
- Quick Deployment: The best part is No installation is required, just follow screen instruction and you can use this tool within a few minutes.
Cons:
- Challenges with Large File Transfers: Many users find difficulties when they tried to send big size data files.
The original TeamViewer remote access system is the anchor software for all TeamViewer services. If you want to use TeamViewer for IT support, it makes sense to extend your subscription to include this remote monitoring and management package. You can get a 14-day free trial of TeamViewer Remote Management. The price for this package works out at $2.16 (£1.63) per month per endpoint.
10. SolarWinds Server & Application Monitor

SolarWinds Server & Application Monitor (SAM) is a hardware monitoring tool that can identify performance issues throughout a network. The tool can monitor CPU, memory, physical disk space, fan speed, and power supply. All of this information is shown to you in the form of a dashboard that provides you complete visibility over your network status and the usage of Windows applications, Linux applications and server resources whether they are located on-premises or in the cloud. You can monitor Azure, AWS IaaS, PaaS and SaaS services.
Key Features:
- Custom Monitoring Using Rest API: Allows monitoring of various custom applications using built-in 200 templates
- Domain Controller Monitoring: Allows domain controller monitoring like account creation, deletion, user account changes , password change and more.
- Application Discovery: Users can create polls to get ideas and create maps to understand where incoming traffic is coming from.
- Azure IaaS Monitoring: It includes monitoring virtual machines and containers to monitor system health and stay informed about Azure IaaS services.
Why do we recommend it?
SolarWinds Server & Application Monitor tracks important server hardware statistics while also recording all software activity. This is an important link that pure hardware monitors lack because the tool can immediately show which applications are placing a heavy load on a server. By correlating the statuses of both hardware and software, a technician can immediately see a way to lower the strain on CPU and combat any overheating problems.
The installation process offered by SolarWinds Server & Application Monitor is incredibly lightweight. You can start the installation and automatically discover devices connected to your network. It takes less than an hour to be up and running to monitor your local environment.
Once the installation is complete you can start to customize the monitors you deploy to manage your environment. The Component Monitor Wizard helps you to choose what service or application you want to monitor. Having this level of control makes sure that you have complete visibility throughout your hardware stack.

SolarWinds Server & Application Monitor is one of the most powerful tools for monitoring & preventing performance issues that stem from hardware malfunctions and failures. It has an intuitive and customizable dashboard that makes it seamless for you to optimize your resources and prevent server outages.
Who is it recommended for?
This tool is aimed at businesses that rely heavily on their own servers so small businesses and companies that use cloud services more than on-premises systems probably wouldn’t get the most value out of the Server & Application Monitor. Although this package has an excellent application performance monitor that can track cloud-based operations in it, its competitive advantage over pure APM systems lessens when applied to off-site applications.
Pros:
- Checks for Hardware Failure: It gives you complete visibility of hardware health and keeps you updated on issues like fan failure, increased temperature, voltage drop, and more.
- Optimize Resource: It provides you with a detailed view of how server resources are used to prevent overuse and prevent server issues.
- See Everything from a Single Screen: You can see hardware, software configuration, and everything through a single customizable dashboard.
Cons:
- Unable to Customize UI: Some users feel that the UI interface is very cluttered and wish if it was customizable for ease of access.
SolarWinds SAM is a natural choice for those SMEs searching for low-maintenance but highly effective hardware monitoring software. The price starts at $1,622 (£1,224). You can download the free trial version.
Read more: Step-By-Step CPU Benchmark Test
11. Zabbix
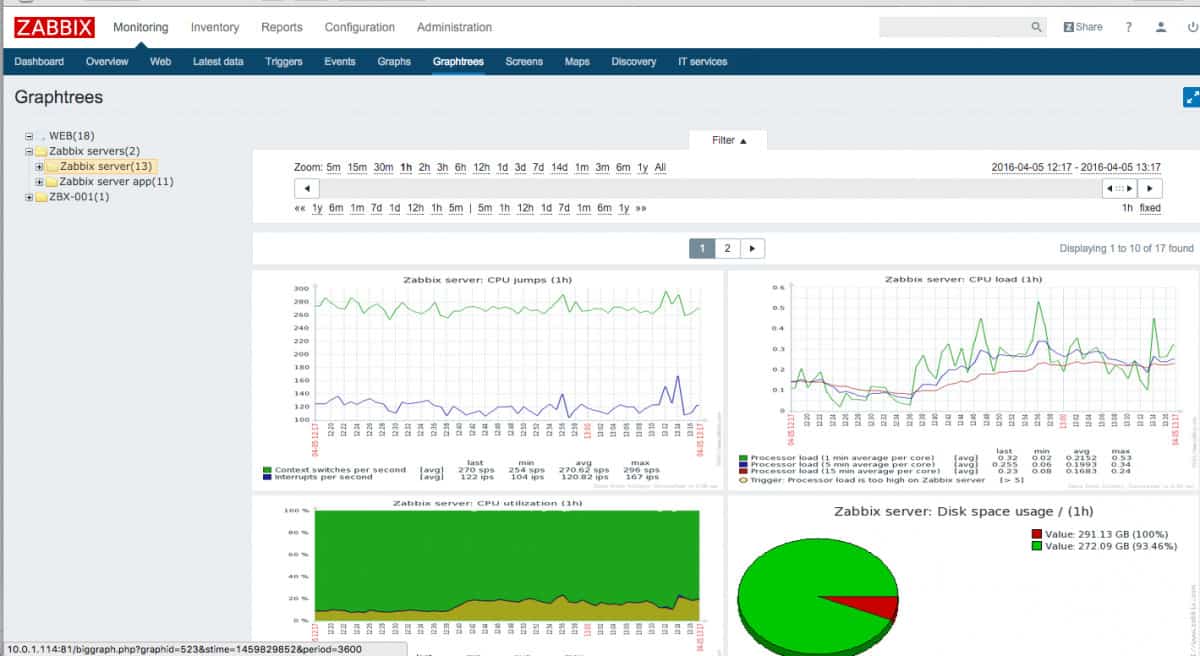
Zabbix is a network monitoring tool that can track hardware availability. Zabbix automatically discovers devices on setup and recognizes when devices have been connected or disconnected. Once tools are connected, you can monitor system status, disk space, device temperature, power supply, and fan state of network hardware. There are also out-of-the-box templates for monitoring popular servers from manufacturers like IBM, Lenovo, Dell, Linux, Solaris, and Hewlett Packard Enterprise.
Key Features:
- Smart Problem Thresholds Detection: It has highly flexible options. Users can differentiate between causes and symptoms of events.
- Trend Prediction: With Zabbix’s predictive functions, you can forecast values for early alerting.
- Anomaly Detection and Baseline Monitoring: Provides powerful insights into deviations from expected patterns to identify abnormal behaviors in your IT infrastructure.
Why do we recommend it?
Zabbix is a full-stack monitoring system that offers network, server, and application monitoring. It includes a discovery service that automatically compiles hardware and software inventories. This is a major competitor to the remote monitoring services of NinjaOne and Atera but it is an on-premises package rather than a cloud platform.
To keep you updated you can look at alerts through email, SMS, jabber, custom scripts or messenger. Alert messages can be customized based on the recipient. For instance, you can customize date and time, hostname, item value, trigger values, host profile, user macros and escalation history.
The visualization offered in Zabbix is also top-notch. You can view graphs of hardware that automatically refresh. For example, you can view graphs of CPU load and CPU utilization monitoring to see how devices are performing. You can also generate availability reports to show other members of your team.

Who is it recommended for?
Zabbix is a completely free service but you host it yourself and the package doesn’t come with professional support. The company makes money by offering support contracts for the system. So, Zabbix is great for businesses of any size. The Zabbix package has become more of a competitor to NinjaOne and Atera recently by creating a multi-tenant edition for MSPs, which is a paid package.
Pros:
- Receive Problem Alerts: Zabbix provides alerts for various events in your environment through multiple messaging channels.
- Customize Alert Messages: You can tailor alert messages to suit your needs by defining different messages for different messaging channels.
- Infrastructure Maps: These maps show real-time data with element statuses, giving you a full picture of your environment for improved monitoring and control.
- Custom Dashboard Widgets: With frontend modules tailored to your individual needs, you can create specific views of collected data and events.
Cons:
- Limited Compatibility: Zabbix is primarily developed for Linux machines, which limits its usefulness for enterprises that use other operating systems.
One of the key selling points of Zabbix is that it is free and open-source. You can download Zabbix for Red Hat Enterprise Linux, CentOS, Oracle Linux, Ubuntu, Debian, SUSE Linux Enterprise Server, and Raspbian. You can download Zabbix for free.
Related post: Nagios vs Zabbix
12. CPUID HWMonitor
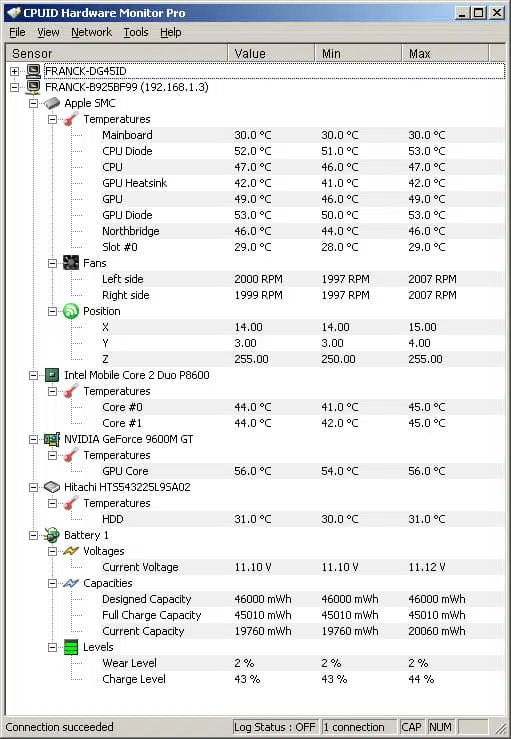
CPUID HWMonitor is one of the most widely-used hardware monitoring tools on this list. HWMonitor monitors the health status, voltages, temperatures and fan status of connected devices. Information is shown to you in a list format that breaks down the performance of connected devices. All data readings are shown in real-time so you can stay up to date with the performance of devices within your network.
Key Features:
- CPU and GPU-Level Hardware Monitoring: You get detailed monitoring of your CPU and GPU (Graphics Processing Unit),to track various metrics such as temperature, voltage, and fan speed in real-time.
- LPCIO Chips Monitoring: You can monitor LPCIO (Low Pin Count Input/Output) chips to understand other hardware monitoring features for components such as motherboard sensors, voltage regulators, and temperature sensors.
- SSD/Hard Disks Monitoring via SMART: Monitor the health and performance of your SSDs (Solid State Drives) .This feature enables you to track important metrics like temperature, operating hours, and error rates.
Why do we recommend it?
CPUID HWMonitor tracks actual hardware statuses, such as temperature and fan activity. This is a free, onboard tool that is only accessible on the device it is installed on. The Pro edition is a paid tool that can be accessed remotely and that can also deliver log files that can be fed into an automated centralized monitoring tool or a SIEM.
One advantage of HWMonitor is that it is easy to use. After completing a startup it will automatically start monitoring your network for performance issues. Once the program is up and running, you can use features like reports to gather further information on your hardware and troubleshoot.
If you’re looking for a straightforward hardware monitoring experience without some of the more advanced features and visualization of other platforms, HWMonitor is a good choice.
Who is it recommended for?
The free edition is a good choice for home use and for small businesses. HWMonitor Pro is worth paying for because it can be accessed remotely, so it can be used by large enterprises that have too many endpoints for technicians to visit each in person. HWiNFO, Open Hardware Monitor, and the free edition of SysGauge are very similar to the free version of HWMonitor and SysGauge has a paid version that offers similar capabilities to those of HWMonitor Pro.
Pros:
- Simple and Lightweight: CPUID HWMonitor can be easily installed and used on your system without consuming excessive resources.
- Real-Time Data: It provides accurate and up-to-date information about your system’s performance hence users can view hardware metrics almost immediately as they occur.
- Suitable for Single Machines or Home Use: Offers basic yet effective monitoring capabilities for individual users without the need for complex setups or configurations.
- Long-Term Testing: Long-term testing means tracking hardware performance over extended periods and analyzing trends or patterns over time.
Cons:
- Occasional Screen Blankness: Some users may see blank screens when using HWMonitor, necessitating a reload of the application or a reset of their PC.
The program is available as a free version or a paid full version (the pro version offers additional logging capabilities and remote operation). You can download HWMonitor for free.
13. HWiNFO
HWiNFO is a network monitoring tool that is used for hardware and system monitoring. HWiNFO offers real-time hardware monitoring for your computer’s CPUs, GPUs, mainboards, drives, and peripherals. The tool is geared towards identifying if your device is overheating or failing. While the user interface is a bit outdated it makes it easy to find the information you need.
Key Features:
- In-Depth Hardware Information: It keeps your latest technologies up to date and provides detailed information about hardware components.
- Real-Time System Monitoring: It monitors all the active components of the system to ensure good status and check for active failure.
- Extensive Reporting: With the help of various tools and other add-ons, it provides multiple types of reports and status logging of hardware.
- Frequent Updates: It offers the most reliable information as the tool gets frequently updated to support latest technologies and standards.
Why do we recommend it?
HWiNFO is an on-device hardware monitor for Windows PCs. It provides live readouts of various hardware statuses but you can minimize the interface and rely on a system of alerts that will warn you if the device is overheating or running out of CPU, memory, or disk capacity.
The information collected by the tool is categorized into different segments; memory, CPU, motherboard, bus, drives, monitor, ports, network, audio, and video adapter. The sheer range of categories gives your monitoring activities visibility throughout your entire network.

Even though HWiNFO’s experience is a little more basic than some of the other tools on this list, it still has its own alerts system. Alerts are customizable and can be updated with extensions. You can also collect more information with XML, CSV, and HTML reports complete with customizable graphs and tables.
Who is it recommended for?
Home users and small businesses would benefit most from this hardware monitor and its alerts system means that you don’t have to watch the monitor’s screen to spot system problems. However, the tool can only be accessed by the user of the device on which it is hosted, so it is not a good option for businesses that have many endpoints. Also, there aren’t any versions of this free tool for macOS or Linux.
Pros:
- Clean and Secure: You don’t have to worry about your data because this tool does not collect any data or transfer it over the network.
- Reliable and Trusted: It is one of the more reliable choices, and used by the majority of hardware vendors and components manufacturers.
- Shows Data in the Hierarchy: It shows detailed hardware information and inventory in the hierarchical form to check various hardware-related factors.
- Real-Time System Monitoring: It monitors CPU,GPU,various drives, mainboards and various other peripherals in real-time.
Cons:
- Only Shows MAC Address: Recently, users find that it only displays the MAC address hence they were unable to get other details of sections.
For smaller enterprises that require a simple hardware monitor, HWiNFO is an ideal choice. HWiNFO works on Windows 10, 8, 7, Vista, and XP. Learn more and download it at this link.
14. Open Hardware Monitor
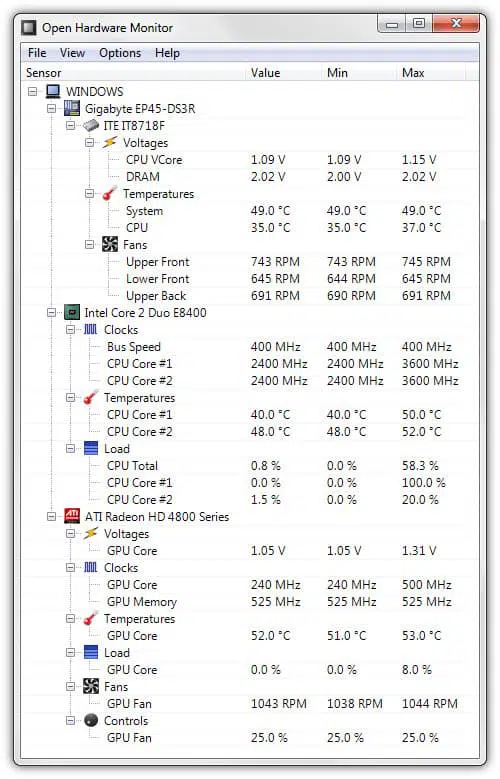
Open Hardware Monitor is an open-source hardware monitoring solution that monitors CPU load, temperature, fan speed, voltage, and clock speed. You can view the system performance of these elements in list format. The last update for Open Hardware Monitor was released in 2016.
Key Features:
- Free and Open Source: It is the best option as it is free and allows monitoring fan speeds, temperature sensors,voltage, load and various other critical factors.
- Customizable Values: Users can customize the monitored value in the main window.
- ATI Sensors and Nvidia Video Cards: Users can also check hard drive temperature, sensors of ATI and Nvidia video cards
- Live Reporting: This hardware monitor comes with the latest hardware monitoring chip that shows live reports on the display.
Why do we recommend it?
Open Hardware Monitor is a lightweight on-device package for Windows. This is a very similar system to HWiNFO. The layout of the Open Hardware Monitor interface mimics the hierarchy structure of typical Windows utilities, such as Windows Explorer.
As an open-source product, Open Hardware Monitor is cost-free and easy to install. You can download the program as a file or source code.
Who is it recommended for?
Although this is a competent hardware monitor, its interface is starting to look a little dated. It is suitable for use on PCs only because there aren’t versions available for macOS or Linux. The system can’t be accessed remotely, so it is only suitable for home use and small businesses.
Pros:
- Cross-Platform: It is supported on almost all 32-bit and 64-bit Windows and Linux platforms (x86).
- It Supports Multiple Processors: It supports multi-processors that display data from core CPUs like AMD.
- Read Temperature Sensors: Users can synchronize the PCI buses to access AMD temperature sensors.
Cons:
- Lacks Alerting and Reporting Functionality: This tool is free to use and suitable for measuring hardware temperatures and other details, but it does not have alerting and reporting functionality.
The program is available for Windows XP, Vista, 7, 8, 10 and Linux (x86 based operating systems). You can download Open Hardware Monitor for free.
15. AIDA64
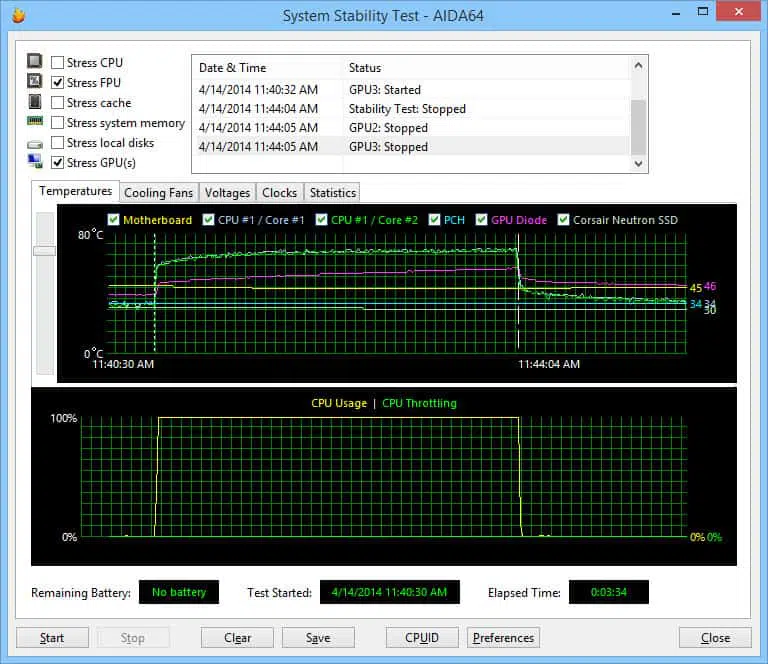
AIDA64 is a hardware and software monitoring solution designed specifically for SMEs. The tool has a hardware detection engine that can discover connected devices from a database including over 208,000 entries. The hardware monitoring capabilities offered by AIDA64 include CPU, disk, and temperature monitoring tools. Once data and information has been collected from devices it can be saved as CSV, XML or an SQL database.
Key Features:
- Hardware Detection Engine: It helps discover devices connected to the database.
- Network Activity Monitoring: It monitors and shows the network activity and hardware status in graphical representation.
- Effective Data Storage: The tools collect data for analyzing and it can be also saved in XML,CSV and SQL database format.
- Alert Notification: It sends alerts to the user in case part of hardware or software is modified.
Why do we recommend it?
AIDA64 is a mini system monitoring tool that is like a scaled-down version of Zabbix. However, as Zabbix is free to use and a lot better than AIDA64, it is difficult to see what marketing advantage the AIDA64 system has. The tool shows rudimentary performance graphs and can monitor network activity as well as hardware statuses. AIDA64 can monitor a network full of endpoints from one console.
The alerts system of AIDA64 can send notifications to the user once there is an issue or a piece of hardware or software is changed. For example, you can receive a notification if the system drive free space is below a certain percentage or there is a system memory size change. Notifications are sent by email so that you don’t miss anything important.
One of the exciting features included with AIDA64 is the ability to monitor devices remotely. You can launch, restart and shutdown applications and services remotely. The remote management capabilities of this tool allow you to monitor remote PCs seamlessly.

Who is it recommended for?
AIDA64 is suitable for small businesses. However, there are free versions of Datadog, Endpoint Central, and PRTG that offer a better service, as does the completely free Zabbix.
Pros:
- Scalability for Large Companies and Enterprises: AIDA64 is the best choice for big companies as it detects and monitors devices at large scale.
- Database Format for Information Storage: It offers the capability to save collected information in a database format, allowing for easy organization, retrieval, and analysis of data.
- Simple Alert System: AIDA64 features a straightforward alert system that is easy to use, providing notifications for important events or issues detected within the IT environment.
- Remote Management Options: It serves as a lightweight Remote Monitoring and Management (RMM) tool, offering options to remotely restart machines as needed, enhancing IT management capabilities.
Cons:
- Graphs Can Be Hard to Read: The graphical representations of data within AIDA64 may be difficult to interpret for some users, posing challenges when trying to analyze trends or performance metrics visually.
The software for AIDA64 runs on Windows. There are four different versions of AIDA64 available for purchase: Extreme, Engineer, Network Audit, and Business. The Extreme version starts at $49.95 (£37.74) for home users. The Engineer version starts at $199.90 (£150.91) with command-line automation. The Network Audit version costs $119.90 (£90.51) to cover 10 computers and includes command-line automation, network inventory, and change management. The Business edition is available for a minimum of 10 endpoints at a price of $199.90 (£150.91). That package supports remote management, command-line automation, network inventory, and change management. You can download the free trial.
16. SysGauge
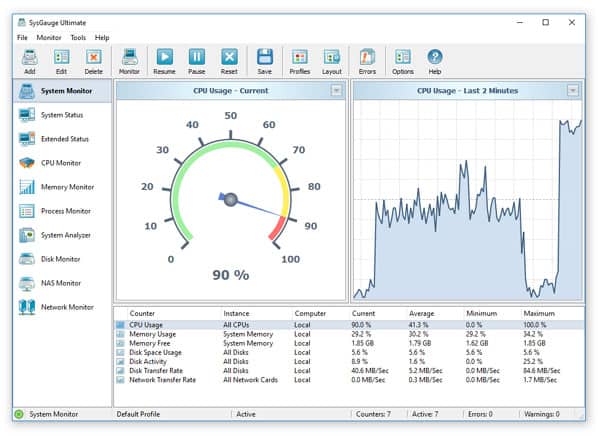
Although technically a ‘system monitor’ and not a true ‘hardware monitor’, SysGauge made it to our list because it can cover the hardware monitoring needs of most network administrators. SysGauge is a network performance monitor that provides an overview of connected devices. The tool monitors CPU usage, memory usage, resource usage, disk space usage, and disk read/disk write for all logical and physical disks installed within a computer. For hardware monitoring, the System Status Monitor will be where you spend most of your time.
Key Features:
- Automated Disk Space Analysis: Users can monitor and analyze disk space usage on their systems. This feature provides valuable insights into disk usage patterns, helping users identify and address potential storage issues proactively.
- File Classification: SysGauge allows you to classify files according to file type, size, and age. This will help you to organize your file and locate it easily.
- File Synchronization: File synchronization helps you to synchronize your files and folders at different locations or devices. This feature ensures that data remains consistent across multiple platforms, enhancing data availability and accessibility.
- Rule-Based File Management: Users can define rules and policies for file operations such as copying, moving, or deleting files.
Why do we recommend it?
SysGauge is a nice little tool that shows a dial and a time-series of graph for each of the system metrics that it covers. You switch between statistics categories in the menu to look at one device at a time. This tool can monitor multiple endpoints, including their hardware statuses.
The System Status Monitor shows you graphs and dials displaying CPU usage and memory allocation data. These are relatively basic but they do a great job of visualizing the raw data. In the CPU usage chart display, you can view usage data from the last minute, last two minutes, or last five minutes.
To deliver notifications, SysGauge has system monitoring rules. These rules allow you to configure notification conditions. For example, you can add an option like’ If Memory Usage Current Value is More than 90% Show Error’ or ‘If Disk Space Usage Current Value is More Than 90% Show Warning’.
Who is it recommended for?
SysGauge is suitable for use by small businesses and it is free to use for up to 10 endpoints. While that allowance is more than the limit on the Free edition of Datadog Infrastructure Monitoring, it provides less capacity than the free versions of PRTG or Endpoint Central. SysGauge also struggles to compete with the permanently free Zabbix monitoring system.
Pros:
- Simple Monitor: It shows all the details like CPU usage, memory usage, disk space, and much more in a simple layout.
- Network Transfer Rate: Users can fix various bugs by monitoring GUI, network transmit rate and other system status information.
- Expert System Monitor: Its latest updated version comes with improved command line utility to fix complex hardware bugs.
Cons:
- Works Only on Windows: This tool can only be operated on Windows machines.
SysGauge is available on Windows as a 32-bit or 64-bit package. There is a free version of SysGauge that supports up to 10 monitors and profiles. The paid versions of the program are as follows: SysGauge Pro$50 (£39.52), SysGuage Ultimate $125 (£98.80), and SysGauge Server $125 (£98.90). These support 50, 100, and 200 monitors/profiles each. You can download SysGauge.
Choosing Hardware Monitoring Software
Hardware monitoring is the only way to safeguard against the failure of a device. Using a proactive hardware monitoring solution like Atera, NinjaOne, and Paessler can help to minimize the rise of a node failing and halting productivity.
These tools each have their own dashboards to oversee hardware performance metrics and an alerts system to compliment real-time monitoring efforts. Whether you are an SME or a large organization, both tools have the bandwidth to manage hardware performance at scale.
PC & Hardware Monitoring Software FAQs
Is Open Hardware Monitor safe?
Open Hardware Monitor is safe. The program doesn’t communicate with a remote control center and so it is not vulnerable to message hijacking over the internet. The purpose of the software only checks the physical statuses of the monitored device and does not tough data files or interact with software services. As an open-source project, the source code for the utility can be read through, enabling the user to check that the program isn’t doing anything untoward.
What is the best hardware monitor you have found?
We really like the SolarWinds Server and Application Monitor. It is very rare that any business will only want to monitor its server’s physical statuses. Server performance problems can be caused by faults with applications, services, and software as well as physical issues. Using an integrated monitor covering all aspects of a server’s performance is better than just focusing on physical properties.
How do I monitor my CPU temp?
CPU temp is a typical hardware status that most server monitors will cover. When looking into different server monitoring packages, make sure the tool you are interested in is specifically a hardware monitor rather than an application monitor. If it is a server hardware monitor, it should monitor CPU temp. Standard PC monitoring tools also typically cover CPU temp.

