
Two of the most popular open-source network and systems monitoring solutions on the market today are Nagios and Zabbix. Both tools offer comprehensive monitoring capabilities, allowing administrators to track the health and performance of networks, servers, applications, and services. However, despite their shared purpose, Nagios and Zabbix differ significantly in their architecture, functionality, and ease of use, which can influence an organization’s choice between the two.
Nagios is a veteran in the monitoring space, known for its flexibility and extensibility. It provides an expandable framework for monitoring a wide variety of infrastructure components, including network devices, servers, and applications. Nagios operates with a plugin-based system, enabling users to extend its capabilities by adding custom plugins for specific use cases. Its modular nature allows for deep customization, but it can require more manual configuration and setup compared to newer monitoring solutions.
Zabbix, on the other hand, is a more modern and integrated monitoring platform. It offers built-in features for monitoring, alerting, visualization, and reporting, with a more user-friendly interface. Zabbix uses a centralized approach, making it easier to deploy and configure, particularly for organizations looking for an all-in-one solution. With out-of-the-box support for a wide range of devices and services, Zabbix is often praised for its scalability and automatic discovery features.
The Nagios Exchange library of plug-ins is a strong attraction for Nagios, which is available in the form of the free open-source Nagios Core and the more feature-laden paid Nagios XI. Up until recently, Zabbix was only available for free. However, the organization has now created a paid, cloud-hosted edition – an industry move that Nagios is yet to follow.
We’re going to examine key features like dashboards, configurability, alerts, protocol support, autodiscovery, and plugins. The aim is to take a thorough look at what each product has to offer and which delivers a better overall monitoring experience. Below is a brief summary of how these two products stack up:
| Category | Nagios Core | Zabbix | Winner |
|---|---|---|---|
| Dashboard and User Interface | High-quality dashboard. The Nagios Core dashboard provides basic information such as the status of devices but it doesn’t offer the same level of clarity and display quality as Zabbix. | High-quality dashboard. Zabbix has the edge based on its production value. The Zabbix dashboard can be customized and offers a cleaner experience than Nagios Core. | Zabbix |
| Configuration | Nagios forces the user to enter configurations as text files. | Configuration is another feature that leans heavily towards Zabbix. Zabbix allows you to change your configurations through a web-based interface. | Zabbix (based on convenience and ease of use) |
| Visualization | Nagios Core doesn’t offer graphs by default. However, if you download the NagVis plugin then you can monitor your network through the use of graphs. | Zabbix has its own premium graphs available out-of-the-box. | Zabbix (based on convenience) |
| Web Interface | Has its own web-based interface. Convenient to deploy but your interaction with Nagios Core is quite limited. For example, you can do the basics like view network health and generate reports but you can’t do much more. The user interface is also considerably outdated. | Has its own web-based interface. Convenient to deploy. Zabbix allows you to configure your monitoring environment through the use of a modern user interface. | Zabbix |
| Autodiscovery | Includes an autodiscovery feature. With the NagiosQL plugin, you can run autodiscovery to find connected devices. This is one of the few areas where Nagios Core has a distinct advantage over Zabbix. | Includes an autodiscovery feature that can scan for devices by IP range. | Zabbix |
| Protocol Support | Offers support for HTTP, FTP, SMTP, SNMP, POP3, SSH and MySQL. | Offers support for HTTP, FTP, SMTP, SNMP, POP3, SSH and MySQL. | Evenly matched |
| Alerts and Notifications | Alerts and notifications are offered out-of-the-box. You can opt to receive Alerts through email and SMS. Nagios Core offers multiple alert levels but it simply doesn’t match Zabbix’s customization. | Alerts and notifications are offered out-of-the-box. You can opt to receive Alerts through email and SMS. Zabbix also allows You to customize messages and to determine an escalation chain. | Zabbix |
| Monitoring Templates | No | Zabbix offers templates for FTP, HTTP, HTTPS, IMAP, LDAP, MySQL, NNTP, SMTP, SSH, POP and Telnet. | Zabbix |
| Plugins | Nagios Core offers an extensive range of additional plugins. | No | Nagios Core |
| Community | 67,000 members | 80,000 members | Zabbix |
| Price | Free Nagios Core has the advantage of acting as a stepping stone into Nagios XI. This allows the user to upscale their needs. | Free | Nagios Core |
Zabbix Key Features
- Real-Time Monitoring: Instantly observes and reports on network performance and health.
- Flexible Alerting: Customizable alerts for diverse scenarios ensure timely notifications.
- Auto-Discovery: Automatically identifies network devices and systems for monitoring.
- Visual Mapping: Creates graphical representations of network architecture for easy comprehension.
- Open-Source Solution: Offers a free, modifiable platform for tailored network monitoring.
Nagios Key Features
- Extensive Plugins: Leverages a vast library of plugins for monitoring specific services.
- Proactive Alerting: Sends early warnings to prevent issues before they become critical.
- Comprehensive Dashboard: Centralizes monitoring data for at-a-glance insights.
- Auto-Discovery: Efficiently detects and adds new nodes to the monitoring network.
- Customizable Reports: Generates detailed reports tailored to user specifications.
Dashboard and User Interface
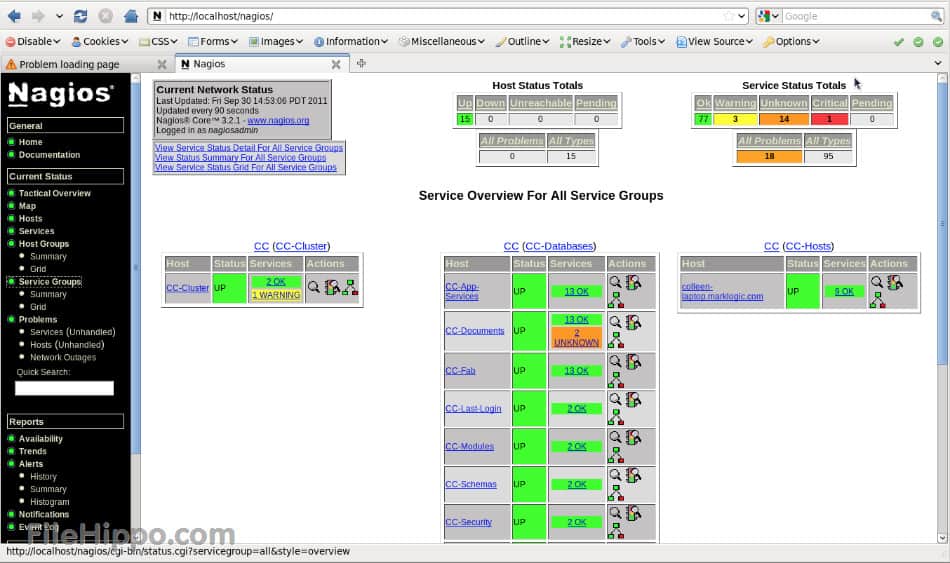
The first comparison we’re going to look at between these two products is their user interfaces. Crucially this means the dashboard. On both programs, the dashboard is going to be where you spend most of your time, so it is important that you have the ability to monitor your network effectively. Nagios Core offers a user experience that keeps things simple. There is a visual display of infrastructure health and various color-coded displays to show how well your network is functioning.
Services and network devices are categorized with a variety of statuses such as: Ok, Warning, Unknown, Critical, and Pending. This provides you with all you need to monitor an enterprise-grade network. A navigation tree is shown on the left-hand side of the page so that you can easily see where key pages like trends, alerts, and notifications are located.
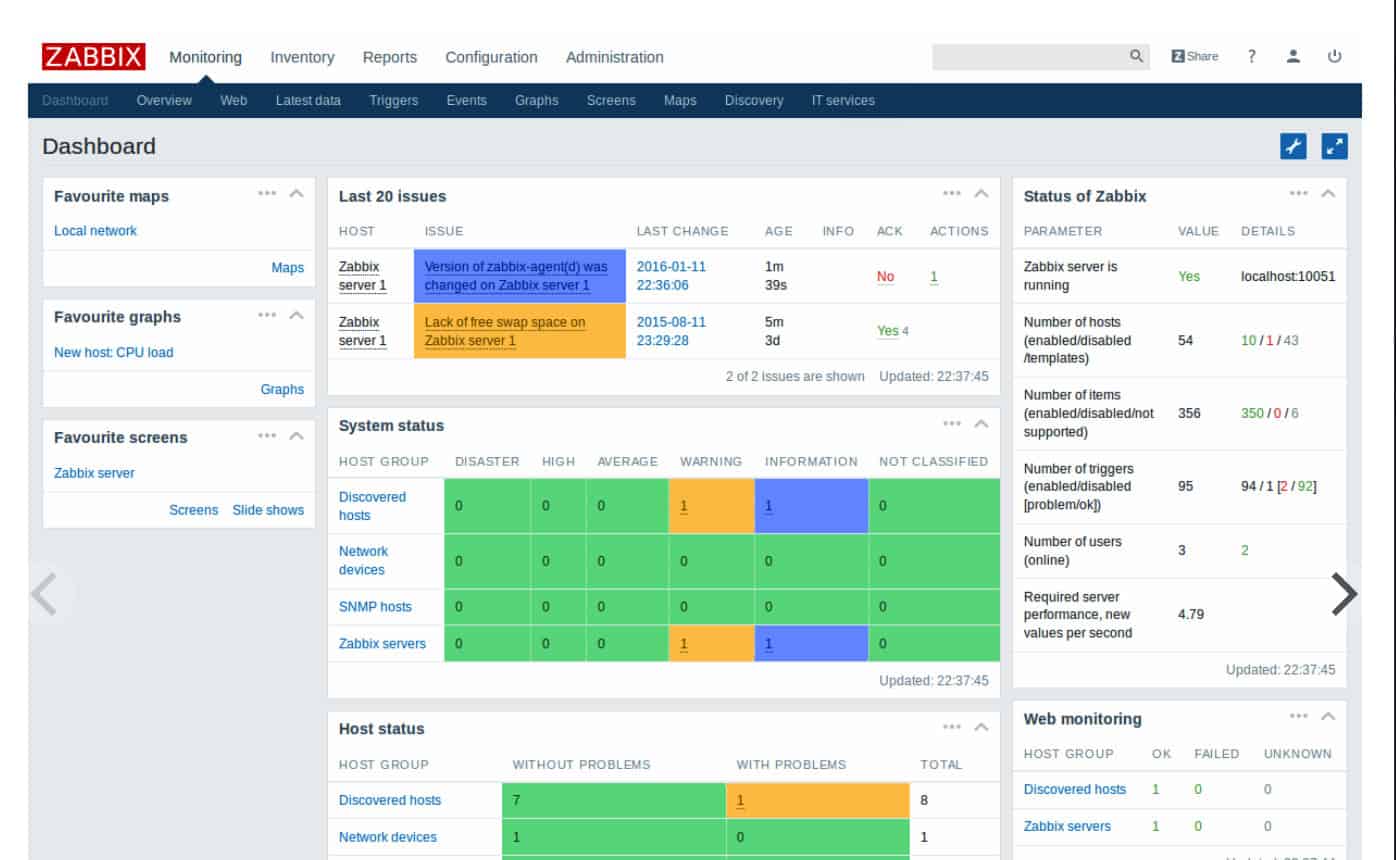
On the other hand, Zabbix’s dashboard maintains a very high-quality appearance. The management interface is crisp and the color-coded displays come out of the screen well-defined. The Zabbix dashboard is completely customizable. While you may need some knowledge of coding to get the most out of its design, it offers you a more personalized experience than Nagios Core. For example, you can have tables detailing host and system statuses on the front page so that you know immediately if there are any problems.
In terms of overall user experience, usability, and design, Zabbix has a distinct advantage. The mix of modernity and a customizable design makes for a truly personalized monitoring experience. While Nagios Core certainly has the foundations for you to monitor your network it just isn’t as satisfying to use.
Configuration
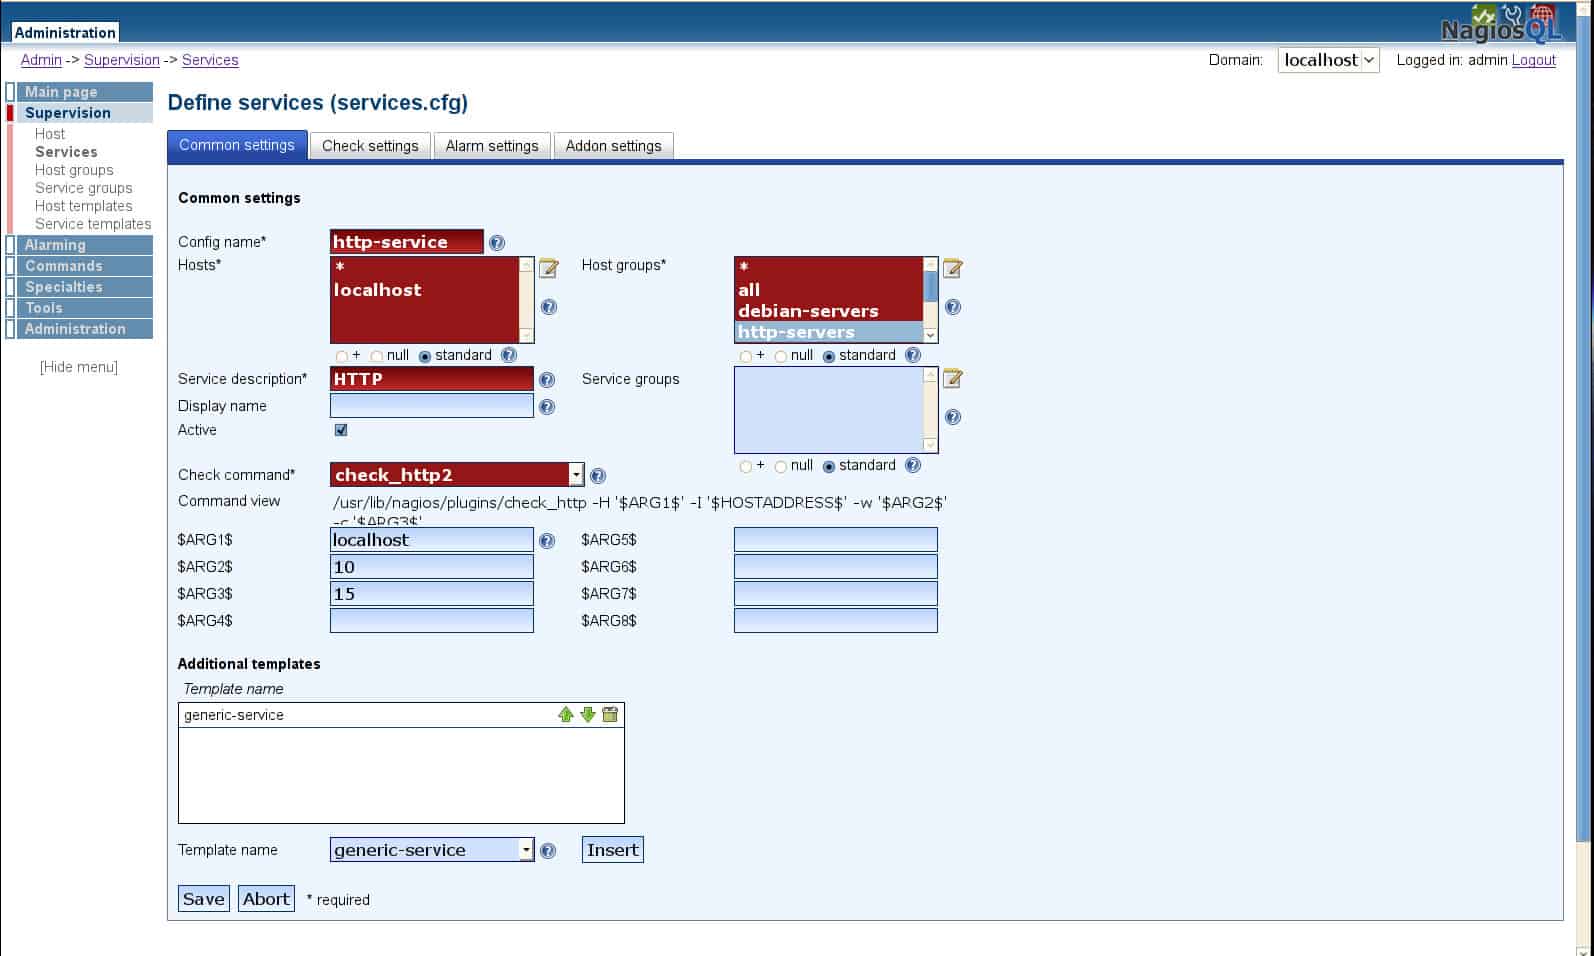
Configuration is a comparison aspect that is going to come up a lot in this discussion because it is so important to structuring the monitoring experience. Zabbix has a massive advantage in this respect because you can change configurations via the web-based interface. One of the main issues with Nagios Core is that all configurations must be entered as text files. Rather than interacting with the user interface, the user has to create text files.
The result is configurations that are inconvenient to establish. Zabbix gets the nod in this area based on how easy it is to create configurations. While text file-based configurations aren’t the end of the world, newer users would be much more comfortable interacting with Zabbix’s GUI.
Visualization
One of the features that all the best network monitoring tools have in common is visualization. Programs that display your network data in graphs and charts that are easy to read are undoubtedly the most popular. Being able to refer to a graph to view trends on your network is key to understanding what’s going on under the hood. Of the two products, only Zabbix comes equipped with graphs out-of-the-box.
To view graphs on Nagios Core you need to use the NagVis plugin. This isn’t a difficult process but the lack of this feature is definitely a missed opportunity. Zabbix’s visualization is clearly the better of the two. Once you’ve raised a graph on Zabbix the design stands up to almost any other network monitoring product you can think of, making it our number one pick here.
Web Interface
Both Nagios and Zabbix have a web-used interface but this is an area where Zabbix has a clear advantage. Nagios Core offers you a basic user interface but aside from the outdated online experience you can only view network health and generate reports. While this is enough for most users it doesn’t allow you to create any custom configurations. Zabbix can be configured according to your requirements by default whereas with Nagios you need to configure via text files or deploy additional plugins.
If you’re looking for a platform that is easy to deploy and accessible online then Zabbix should be your choice. Nagios Core offers a web-GUI that feels ten years out of date. While Nagios Core’s design still gets the job done Zabbix’s configuration and lean web interface make it much more adept at handling large enterprise workloads.
Autodiscovery
Both Nagios Core and Zabbix can run autodiscovery. With Zabbix the user can determine an IP range to scan and the software will periodically search for new devices. Nagios Core comes with a plugin called NagiosQL you can autodiscover devices throughout your network. This means that when you launch Nagios it will start to look for devices automatically. In other words, you won’t have to manually add them.
By visiting the Nagios exchange site you can activate that NagiosQL plugin. Based on the simplicity of the system, Zabbix has the edge here as it makes it easy for users to configure scan settings of their choice.
Protocol Support
A large part of a systems monitoring ability is linked to its use of protocols. Without the right protocols, your visibility on a network is severely limited. Luckily both Zabbix and Nagios have a decent range of protocols for you to work with. Both products support HTTP, FTP, SMTP, SNMP, POP3, SSH, and MySQL. With regards to protocol support, Nagios Core and Zabbix are evenly matched.
Alerts and Notifications
Alerts and notifications have become one of the most important aspects of network monitoring systems. Manual monitoring is deeply flawed and even if you were at your desk 24 hours a day you wouldn’t be able to spot every little event that takes place on your network. Alerts allow you to rely on your network monitoring system to flag problematic activity for you to resolve.
Both Zabbix and Nagios Core have their own alerts system. Each product alerts you via email and SMS when something problematic is detected. Nagios has multiple alert levels, designating events with an error, warning, or okay message. This helps you to prioritize which events are the most important. Zabbix’s alerts and notifications are good because they allow you to customize your message content.
For instance, you can make messages include information such as date and time, hostname, item value, trigger value, host profile, user macros, and escalation history. This is very useful for making sure that all the relevant information is included. However, what really gives Zabbix’s alerts system the edge is its escalation abilities. If your initial message receives no response then it will be sent to another recipient. In the event that there is no response at the end of the chain it can execute a command automatically to act.
This cluster of alerting configurations allows you to customize an alerts system according to the needs of your team. You can designate who is the first point of contact and make sure that other team members are ready to step in if there is no response. Based on customized messages and the ability to determine escalation chains, Zabbix has a clear advantage.
Monitoring Templates
Templates are an area that often gets overlooked in favor of grander features like customizable dashboards and visualization. This is unfortunate because monitoring templates eliminate lots of manual configuration needs. Zabbix has a range of templates for FTP, HTTP, HTTPS, IMAP, LDAP, MySQL, NNTP, SMTP, SSH, POP, and Telnet. These templates allow you to hit the ground running and start monitoring straight away from template settings.
Nagios Core has no monitoring templates. While you can find information on monitoring setups from the wider Nagios community, it still requires more investment than the default templates offered by Zabbix. Zabbix’s templates make a massive difference to the overall network monitoring experience and give this product the upper hand here.
Plugins
In many other sections, you’ve heard us talk about plugins on Nagios. The availability of plugins is something that sets Nagios Core apart from Zabbix. There are hundreds of plugins available to be used with Nagios Core. While not all of these are useful, there are many that are. Even though Zabbix is a formidable tool the lack of plugins is somewhat of a missed opportunity. Nagios Core offers the better value of the two in terms of plugins.
Community
Having a diverse and active community behind a tool is often just as useful as any core features themselves. The community surrounding a network monitoring platform stands as a source of valuable information and insight. If you have a problem with your product or you need guidance on how to get the most out of your monitoring environment, then the community forums of your respective product should be one of your first ports of call.
Both Nagios and Zabbix are known for having active support communities. Zabbix currently has a list of members totaling over 80,000 and a substantial number of active users. Surprisingly Nagios has significantly less with roughly 67,000 users. The substantial following of both communities provides you with a reliable resource of information on each product.
The user communities of both tools provide rich sources of extensions to these products. In the case of Nagios, you can get hundreds of add-ons from the community for free. Zabbix can actually employ Nagios add-ons with a little manual scripting to adapt the output of functions from the Nagios architecture to the more simplistic information flow procedures of Zabbix. However, the Zabbix community is a great source of templates, which is the main method available to customize Zabbix.
Adaptability
As both Nagios Core and Zabbix are open source projects, you are perfectly entitled to access the code, rewrite parts of it, and create a customized implementation that fits your needs exactly. However, in most cases, users of Nagios Core tend to rely on add-ons to customize the system and Zabbix users rely on templates as a method of customization.
Services
Both Nagios Core and Zabbix have built-in agents that extend the capabilities of the tools. Zabbix has one agent that manages all services. This is called the Zabbix Agent. You can make the Zabbix agent perform similar monitoring tasks to the services provided by different agents in Nagios Core.
Those Nagios Core agents are the Nagios Remote Plugin Executor (NRPE), which facilitates remote monitoring, the Nagios Remote Data Processor (NRDP), which is a data transport mechanism, NSClient++, which enables Nagios Core to monitor Windows devices, and Nagios Cross-Platform Agent for Windows, Linux and Mac, which is an API to feed monitoring data into other applications.
In the services, the modular approach of Nagios is a clear winner over the Zabbix Agent.
Zabbix Pros & Cons
Pros:
- Comprehensive Coverage: Monitors a wide array of devices, offering thorough network oversight.
- Highly Customizable: Adapts to various monitoring needs through extensive configuration options.
- Strong Community Support: Benefits from a robust community offering help and custom scripts.
Cons:
- Complex Setup: Configuration and initial setup may be challenging for new users.
- Resource Intensive: Can consume significant system resources, affecting performance on underpowered servers.
Nagios Pros & Cons
Pros:
- Versatile Monitoring: Capable of tracking a wide range of network services and resources.
- Strong Documentation: Well-documented setup and usage guides facilitate easier implementation.
- Active Community Support: Gains from a dedicated community providing insights and plugins.
Cons:
- Steep Learning Curve: The complexity of features and configurations can overwhelm newcomers.
- Manual Configuration: Requires significant manual effort to configure and manage monitoring tasks.
Price
It is no secret that network monitoring tools can be pricey, particularly with regards to the most popular tools on the market. However, both Zabbix and Nagios buck this trend by being available for free. The difference between the two is that you can upgrade Nagios Core to the paid version – Nagios XI. While these aren’t the same product, it is worth including because it does provide users with a path through which to upscale. Nagios XI starts from $1,995 (£1,519). This price allows you to use infrastructure monitoring, capacity planning graphs, alongside thousands of addons and multi–tenant capabilities.
While these two are neck and neck in price, we have to give the edge to Nagios because you have the ability to upgrade if needed. The features offered by upgrading to Nagios XI are substantial enough to outperform Zabbix in many key areas. One area, in particular, would be that of configuration wizards which take you through the process of using various features on Nagios.
The Verdict: Zabbix – Premium Network Monitoring for Free
After comparing the two it is clear that Zabbix is the winner. While Nagios Core has the basics in place to run effective network monitoring it simply doesn’t have the experience and configurability that Zabbix does. Zabbix is a free network monitor that performs like a product situated in the very top price bracket. Besides the lack of an autodiscovery feature, Zabbix is a very well-rounded product.
While it doesn’t have the autodiscovery ability of Nagios Core it performs highly across the board. In most key differentiators, Zabbix simply outperforms Nagios Core. With an alerts system with automatic escalation to clear graph generation, this product has everything.
Zabbix’s features come together to build a very simple and fulfilling monitoring experience. Monitoring templates reduce the amount of manual configuration that needs to be completed to view your network. Once a problem has been spotted customized messages and the escalation chain makes event response extraordinarily efficient. The program responds to key events by passing information straight to key members automatically.
Even though Nagios Core offers a quality monitoring experience, it isn’t on Zabbix’s level. The user interface looks outdated, and the lack of convenient configuration and default visualization really lets it down. In spite of this Nagios Core does have the distinct advantage of a web-based GUI, and additional plugins.
In most enterprise environments Zabbix is the better tool to use. If you’re considering implementing a network monitoring tool in your organization we strongly recommend you consider Zabbix. Though it can be easy to overlook in a market this saturated, it is definitely one you should consider if you value lightweight deployment and premium configuration.
Nagios Core vs Zabbix FAQs
Is Zabbix safe?
You will find comments on the internet stating that communications between the agent and the system manager are not encrypted. This would be a particular problem for implementations that monitor remote sites. However, it isn’t true. It is possible to apply SSL encryption to all Zabbix communications, so the system is safe.
How can I detect a failed process on my server with Nagios?
Nagios includes complete server monitoring for both Linux and Windows and this service shows processes and their statuses. In both instances, a monitoring agent needs to be installed on the server to be monitored.
What are Zabbix macros?
A Zabbix macro is a variable. The notation of the Zabbix system requires these macros/variables to be enclosed in curly brackets ({}).
Which ports does Nagios use?
Nagios uses the following ports:
- Port 80 For access to the web-based console if SSL has not been turned on
- Port 443 For access to the web-based console if SSL has been turned on
- Port 161 For SNMP request/response
- Port 162 For SNMP traps
- Port 22 For protected SSH command-line access
See also:
10 Best network monitoring tools
12 Best APM tools
11 Best free TFTP servers for Windows, Linux, and Mac
The 10 Best Free SFTP and FTPS Servers for Windows & Linux


Why Zabbix auto discovery is not a winner?
Zabbix 5.0 comes with auto discovery and its able to do with few clicks and active and passive method.
We’ve changed the table to reflect this now. Thanks for the heads-up!