

SolarWinds Network Performance Monitor is a product that many consider being the best network monitoring product on the market. However, this doesn’t mean that it is the best at everything. Each tool has its specialty, and there are many tools that challenge Network Performance Monitor in a number of key areas.
Here is our list of the best SolarWinds alternatives:
- Auvik EDITOR’S CHOICE Cloud-based platform offers network discovery and SaaS package monitoring options. The network monitor will generate a device inventory, create a network map, and provide constant status checks through SNMP. Get a 14-day free trial.
- NinjaOne (FREE TRIAL) Cloud-hosted remote monitoring and management package includes SNMP-based network monitoring and it is particularly interesting for managed service providers. Get a 14-day free trial.
- Atera (FREE TRIAL) Cloud-based system that includes a Help Desk ticketing system and provides remote monitoring and management for networks, servers, applications, and cloud systems. Start a 30-day free trial.
- Site24x7 (FREE TRIAL) Cloud platform that provides full-stack monitoring packages with network device monitoring included in every edition. Start a 30-day free trial.
- Paessler PRTG (FREE TRIAL) Large bundle of system monitoring tools that is centered on an SNMP-based network monitoring service. Available for download onto Windows Server or as a SaaS platform. Get a 30-day free trial.
- ManageEngine OpManager Robust feature set and user-friendly interface.
- SevOne Both network device and traffic monitoring are implemented by a hardware appliance for the network.
- NetBrain Network device monitoring, traffic analysis, and troubleshooting tools. Requires two servers; one running Windows Server and the other running Linux.
- Splunk Data processor that offers both performance and security monitoring for all IT assets. Available as a cloud platform or for installation on Windows Server or Linux.
- Extrahop Network and security monitoring for networks. Delivered as a SaaS platform.
Our methodology for selecting SolarWinds alternatives
We reviewed the market for network monitoring systems like SolarWinds Network Performance Monitor and analyzed the options based on the following criteria:
- Network discovery service that can identify network devices and also endpoints
- Automatically maintained hardware inventory
- Network topology mapping service
- SNMP-based device status polling
- Alerts for SNMP Traps and signals calculated from performance metrics
- Free trial or a demo account that enables the package to be assessed before buying
- Value for money from a competent network device monitor that is offered at a reasonable price
SolarWinds vs Auvik
Features Comparison Table
| Feature | SolarWinds Network Performance Monitor | Auvik |
|---|---|---|
| Real time monitoring | Yes | Yes |
| Historic monitoring | Yes | Yes |
| Dashboard | Yes | Yes |
| Topology Map | Yes | Yes |
| Alerts | Yes | Yes |
| IPAM | No (needs SolarWinds IP Address Manager) | Yes |
| Operating System | Windows, web-based | Windows, Mac, Web |
| Pricing | Starts at $2,892 (£2,245) | $30-40 (£23-31) per month for unlimited users |

There are few network monitoring tools as well-designed as Auvik. Auvik has one of the most fresh-faced network monitoring experiences on the market that meshed well with its wide-ranging support for integration with other platforms. Auvik can integrate with other well-known platforms such as ConnectWise Automate and Continuum to provide complete network management.
Key Features:
- SNMP-Based Tracking: Continuous polling for device statuses
- Network Discovery: Rescans periodically to look for network changes
- Network Inventory: Generated from the autodiscovery cycle
- Network Map: Built from data in the network inventory
- Alerts for Performance Issues: Also triggered by SNMP Traps
Why do we recommend it?
Auvik is a monitoring platform that provides two divisions of service; Network Monitoring and SaaS Monitoring. When assessing the service in comparison to the Network Performance Monitor, you need to look at the Network Monitoring service. There are two plan levels for Auvik Network Monitoring and the Essentials package equates very well with the Network Performance Monitor.
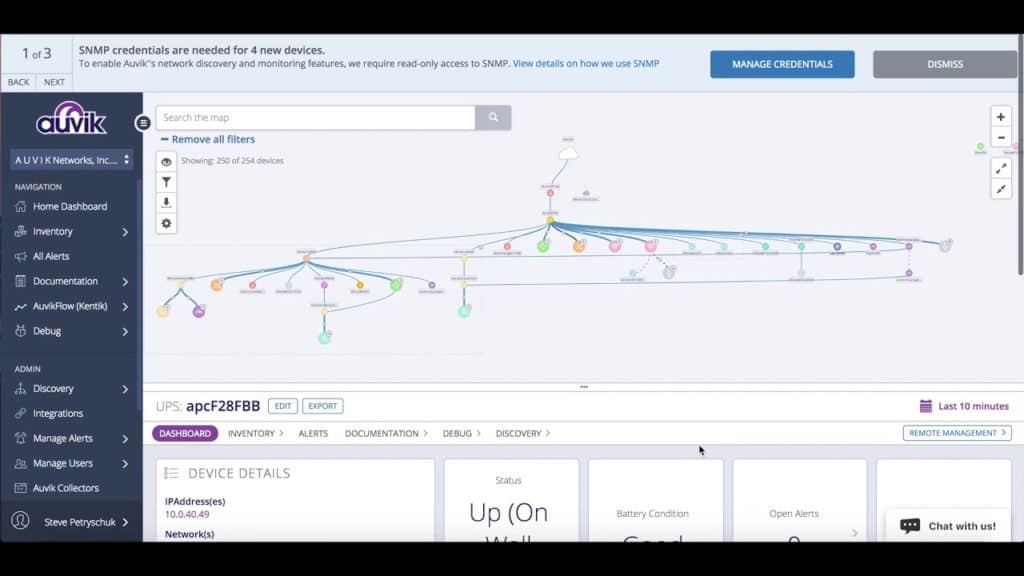
Auvik is a high-performance network monitor in many ways, but nowhere is this more clearly displayed than in its real-time network inventory and mapping features. It can register when new devices are connected to your device and add them to a topology map for further analysis. On the topology map, you can click on individual devices to view more information. For instance, you can click on a PC to view its device bandwidth.
The compelling user experience doesn’t stop there either. Auvik also offers the user automated device configuration backups and restorations. This means that you’re not at risk of losing everything in the event that a device goes down. This adds a level of security that rivals the limited approach to security that can be seen by SolarWinds Network Performance Monitor.
Extra Features: IPAM and Password Management
The features that really makes Auvik standout from SolarWinds Network Performance Monitor are its IPAM and its password management. With IPAM, Auvik enables the user to view which devices are using which subnets on your network. This is great because it allows you to see which IP’s have been defined to what. There is no equivalent function on SolarWinds Network Performance Monitor, and SolarWinds users have to purchase SolarWinds IP Address Manager in order to make use of this feature.
SMBs should look at the Small Business Network Management Bundle to get an IPAM along with network monitoring services.
Auvik’s password manager is another area where Auvik really stands out as well. Auvik allows you to encrypt and store passwords within your monitoring environment so they are always within reach. In effect, you only need to remember one password to monitor your entire network (your Auvik password). Again there is no such feature on SolarWinds Network Performance Monitor which helps Auvik to really stand out.
Who is it recommended for?
Auvik is a very competent service and any business that is looking for a network device monitoring service should assess both the SolarWinds Network Performance Monitor and the Auvik Essentials Network Monitoring service. Auvik is a cloud platform, while the Network Performance Monitor is an on-premises software package.
Pros:
- Attractive Console: Includes graphs for quick status comprehension
- Cloud-Hosted Dashboard: Access it through any standard web browser
- Server Statuses: Can easily monitor CPU and set threshold-based alerts
- SaaS platform: No need to host
- MSP Edition: Multi-tenant accounts for managed service providers
Cons:
- No Price List: Encourages customers to get started without asking about the price
You can register for a 14-day free trial.
EDITOR'S CHOICE
Auvik is our top pick for a SolarWinds alternative because it provides all of the network device monitoring services of SolarWinds but from the cloud. The SaaS model of Auvik has many advantages over the on-premises system of the Network Performance Monitor. The cloud-based tool requires no server space or maintenance tasks, which makes it a great deal easier to manage. SolarWinds has fallen behind the market a little by failing to port its products to the cloud and Auvik gives an insight into what the SolarWinds Network Performance Monitor might have become if it had been converted to SaaS delivery. Another advantage of the Auvik Essentials plan is that it includes a network configuration manager, which is an extra purchase on the SolarWinds product list.
Download: Download a 14-Day Free Trial
Official Site: https://www.auvik.com/
OS: Cloud-Based
SolarWinds vs NinjaOne
Feature Comparison Table:
Feature | SolarWinds NPM | |
|---|---|---|
Network Discovery | Yes (autodiscovery) | Yes (autodiscovery) |
Network Monitoring | SNMP, ICMP, WMI. You can purchase SolarWinds NetFlow Traffic Analyzer to use NetFlow, jFlow, sFlow, IPFIX and NetStream | SNMP, NetFlow, J-Flow, sflow, IPFIX, WMI, and ICMP |
IPv6 Support | Yes | Yes |
Topology Map | Yes | Yes |
Syslog | Yes | Yes |
Virtual Interface and device monitoring report | Yes | Yes |
Active Directory | Yes | Yes |
Pricing | Starts at $2,892 (£2,245) | Contact the sales team |

NinjaOne, (formerly NinjaRMM), is a package of system monitoring and management tools so the fundamental strategy behind NinjaOne is different from that of SolarWinds, which produces separate modules for each task. While SolarWinds provides all of the functionality contained in NinjaOne, that service is spread out over several units. You would have to buy many SolarWinds products to get the services offered by NinjaOne.
Key Features:
- Network Discovery: Regularly repeats for updates
- Creates a Hardware Inventory: Generates a network topology map
- Software Management: Includes license usage tracking
- Help Desk Ticketing System: Manages technician teams and tasks
Why do we recommend it?
NinjaOne is designed for use by managed service providers. So, it competes with the MSP tools division of SolarWinds, which is called N-able. The SolarWinds platform provides automated system monitoring tools in one bundle. It also includes asset management services, such as a patch manager.
Another fundamental difference between these two systems is that NinjaOne is specifically written for managed service providers (MSPs). SolarWinds has a division that caters to this market, which is marketed under the N-Able brand. MSPs would need to look at the N-Able systems in order to get a closer comparison with NinjaOne. The MSP-first structure of NinjaOne gives it a multi-tenant capability that gives users the ability to keep the data of different clients completely separate. NinjaOne is also set up to enable credential management that prevents the technician from knowing the account passwords for the remote systems.

Despite its structure that is built for MSPs, NinjaOne can also be used by IT Operations departments to support several sites. In this type of implementation, there is a closer comparison between the two systems. NinjaOne is organized to monitor remote sites. This doesn’t prevent it from monitoring the same site that the technician is connected to. However, as NinjaOne is cloud-based, that “local” network is actually remote to the monitoring software.
SolarWinds is an on-premises package and so its great strength is monitoring the local system. The SolarWinds product range is also able to monitor multiple sites and cloud resources. In this configuration, there is a closer implementation comparison with the operations of NinjaOne.

The basis of NinjaOne is its network monitoring service. This is because, as a remote service, this tool needs to be able to navigate around the network and so will map that system first as a matter of course, if only for its own access needs. The Network Performance Monitor (NPM) of SolarWinds is that company’s star product and it is the most widely-sold network monitoring package in the world.
The NPM checks on network device statuses through SNMP and NinjaOne does that, too. NinjaOne also includes network traffic analysis, which SolarWinds offers in the NetFlow Traffic Analyzer. Both systems use NetFlow, J-Flow, and sFlow to communicate with devices. Both are able to implement traffic shaping and both can watch over virtual systems, including VLANs and VMs. SolarWinds offers a package deal of the Network Performance Monitor and the NetFlow Traffic Analyzer with the Network Bandwidth Analyzer Pack.
Both of these services will monitor endpoints running Windows, macOS, and Linux. This includes server monitoring. Both also have application monitoring capabilities, although the SolarWinds Server & Application Monitor is much stronger in this division than the NinjaRMM system.
NinjaOne includes an automated patch manager and a configuration manager. These functions are available from SolarWinds in specialist packages, which have to be bought separately and added to the network and endpoint monitoring packages. The SolarWinds tools are all built on a common platform, called Orion. The tools will all be accessible from a single dashboard, so technicians don’t need to switch between interfaces, even though many of the modules required would have been bought separately. SolarWinds has put together a bundle that provides the Server & Application Monitor, the Server Configuration Monitor, the Log Analyzer, and the Virtualization Manager in a package called the Hybrid Systems Monitoring Bundle. However, there is no patch manager in the SolarWinds menu of services.
Key Feature Comparison: Alerts
As you can see from the other comparisons in this guide, just about every system monitoring tool includes an alerting mechanism. This is an industry-standard feature and so, it is no surprise that NinjaRMM has this service and it operates in a very similar way to the alters mechanism in all SolarWinds products.
In both cases, the monitoring service offers a series of thresholds. These usually relate to capacity utilization, but they can also be set for performance issues, such as device response times. Fundamentally, performance problems are caused by resource capacity shortages, which is why both of these systems focus on capacity utilization for their alerting service.
With NinjaOne, as with SolarWinds products, alerts are generated when a capacity limit is crossed. These threshold levels are not at full capacity because they are intended to give the technician enough time to take action. So, for example, a CPU threshold might be set at 75 percent utilization. With both services, thresholds need to be turned on and their levels are pre-set but can be adjusted easily. With both systems, it is also possible to create custom alerts, particularly by combining conditions.
The big difference between the SolarWinds and NinjaOne systems is that NinjaOne includes a ticketing system, which is central to its services. The philosophy of NinjaOne system management is to channel all tasks through the ticketing system for allocation and scheduling. So, this is where NinjaOne alerts go by default, although it is also possible to send alerts out as emails and SMS. SolarWinds doesn’t have that ticketing mechanism and so email and SMS notification – as well as an alert in the dashboard – are the main channel for alerts.
Who is it recommended for?
NinjaOne is designed with a multi-tenant architecture, which means that buyers can create subaccounts and store the data for each client in a separate space. This shows that the package is intended for use by managed service providers. However, IT departments could use the platform and just not implement subaccounts.
Pros:
- Manages Software on Endpoints that are in use: Operates software installations and patches in the background
- Automated Maintenance Task and Patch Scheduling: Give the tool a maintenance calendar
- Multi-Tenant Architecture: For managed service providers
- Platform Agnostic Web-Based Management: Access it through a web browser
Cons:
- IT Departments Won’t Need the MSP-Related Features: Sub-accounts aren’t compulsory
NinjaOne is available on a 14-day free trial. For detailed pricing, you can reach out to them for a free quote.
SolarWinds vs Atera
Feature Comparison Table:
Feature | SolarWinds Network Performance Monitor | Atera |
|---|---|---|
Autodiscovery | Yes | Yes |
Real-time monitoring | Yes | Yes |
Historic monitoring | Yes | Yes |
Dashboards | Yes | Yes |
Mobile App | No | Yes |
Automation | No | Yes |
Rest API | No | Yes |
Technician activity logging | No | Yes |
Pricing | Starts at $2,892 (£2,245) | Starts at $99 per month (£82.84) |
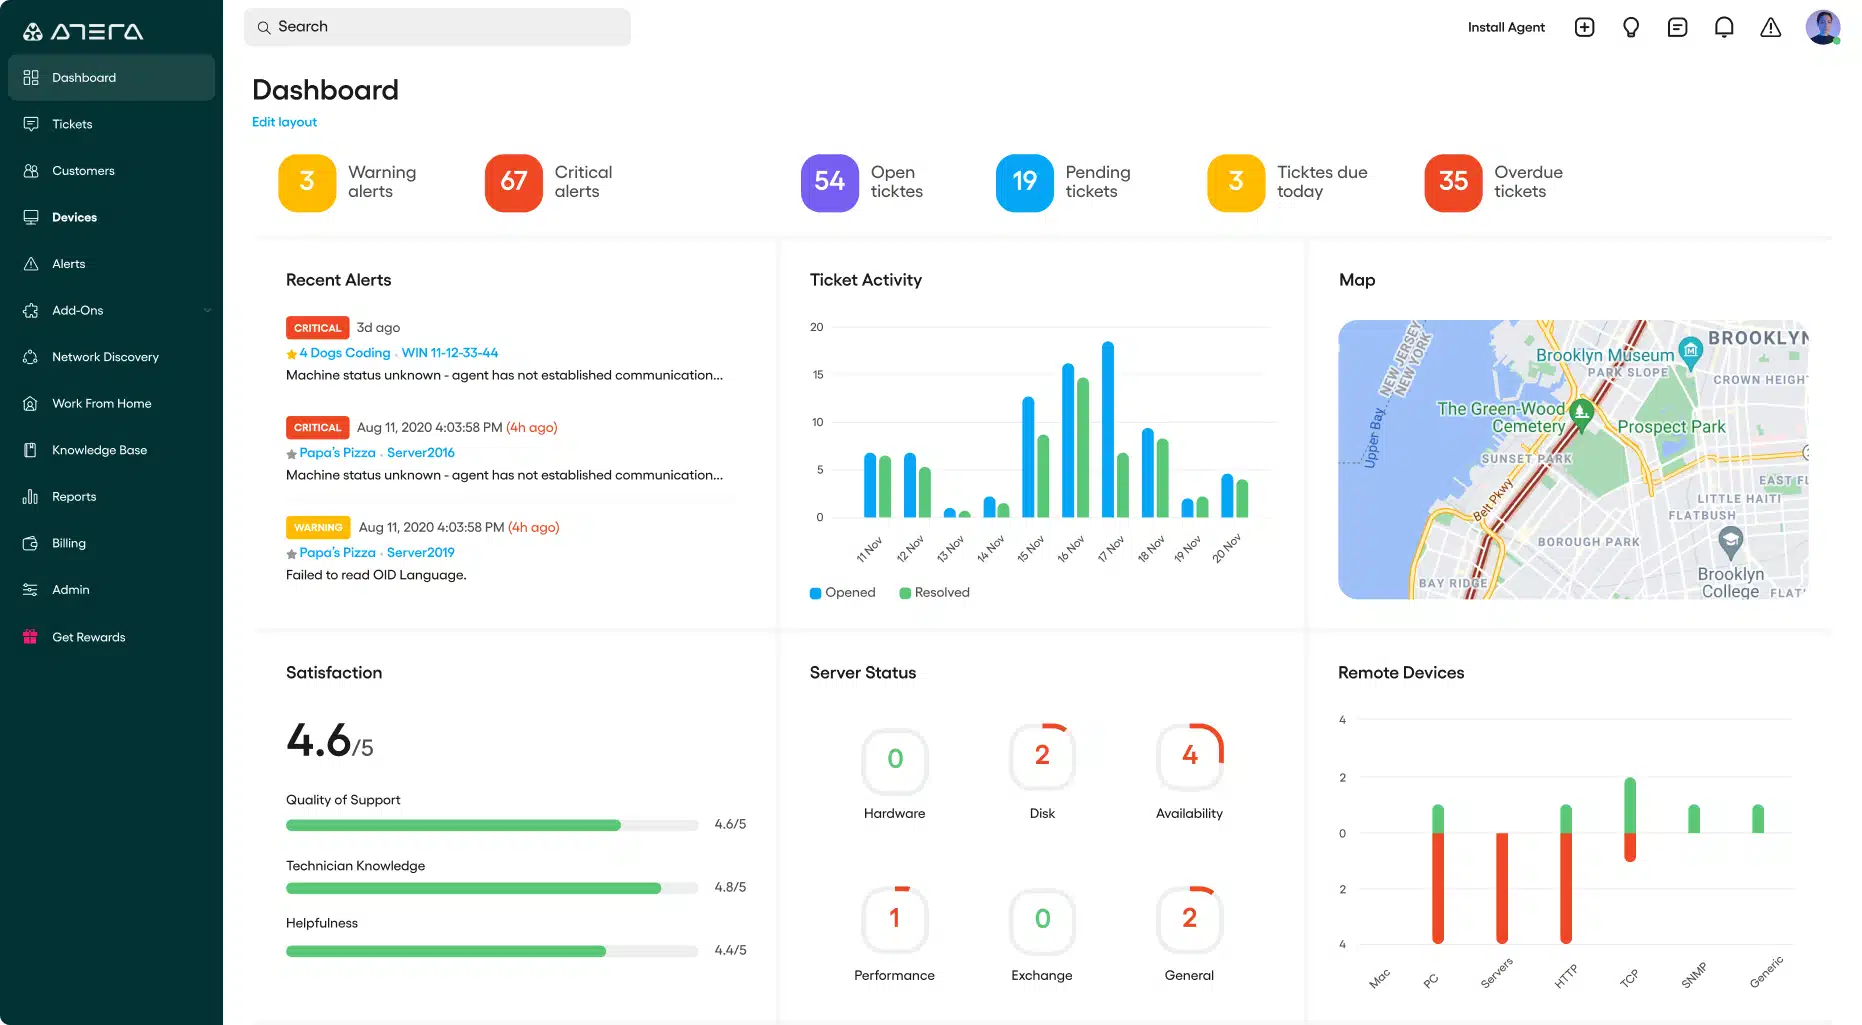
Atera is a little different from the other SolarWinds Network Performance Monitor alternatives on this list because it is a support package for managed service providers (MSPs). The platform is a cloud-based service and it includes remote monitoring and management (RMM) functions and professional services automation (PSA) modules. RMM is the software that a technician needs in order to service the client’s network and PSA features assist in the monitoring of the MSP’s own team of technicians.
Key Features:
- Remote Monitoring and Management Package: Looks after network servers, and applications
- Automated Monitoring: Scans the network with SNMP
- Alerts for Performance Issues: Also alerts for SNMP Traps
Why do we recommend it?
Atera is a cloud-based tool and it performs endpoint monitoring and management as well as network performance monitoring, so there are some big differences between these two packages. The Atera system also includes team management and even business management tools. Strangely, the network discovery service is a paid extra in the Atera price list.
As a complete remote system monitoring package, Atera is able to monitor servers and applications as well as networks. It includes system management functions, such as patch management and software license management. As such, Atera has much more functionality than the SolarWinds Network Performance Monitor. For the sake of this comparison, we will focus just on the network monitoring functions of the Atera RMM service.
The underlying technology that drives the network monitoring functions of both the SolarWinds Network Performance Monitor and Atera is exactly the same. Both use Simple Network Management Protocol (SNMP) processes. The SNMP method provides network discovery, live network equipment statuses, and performance alerts.
The main configuration difference between SolarWinds NPM and Atera is that SolarWinds installs on-site but Atera is an online service. There is no need to maintain servers to host the Atera software. As such, Atera is more suitable for small MSPs because the full functionality of a network monitoring suite is available to those companies with small budgets. The Atera service is charged for by subscription on a per technician basis, so companies that use Atera don’t have to pay the full cost of acquiring the software upfront. Customers of Atera can choose to pay monthly or annually. Paying by the year gets a lower rate. However, the service is charged for in advance, so there are budgeting advantages to opting for the monthly payment plan.
Feature Comparison: Alerts
System alerts are vitally important in any network monitor and both SolarWinds NPM and Atera employ the same methodology for highlighting status problems: the SNMP trap. In both systems, the central monitor software makes periodic requests to device agents for reports on the various statuses of the monitored equipment.
The SNMP trap enables the device agent to send a status report without waiting for a request. Both SolarWinds and Atera recognize the importance of these trap messages and display them prominently as interpreted alerts in the dashboard. In both cases, the alert can be forwarded on to a nominated technician via email. This feature means that you don’t need to allocate a member of staff to sit and watch the network monitoring dashboard in order to catch an alert as soon as it arises. Alerts are categorized by severity and shown in the system dashboard as color-coded events.
The alert events also feed through to system monitoring visualizations, which include graphs and color-coded charts. Both of these systems simplify network administration by logging all statuses and making performance data available for later analysis as well as grabbing the attention of administrators as soon as things start to go wrong.
Who is it recommended for?
Atera is a broad system monitoring and management package that is designed in versions for managed service providers and IT departments. The business services included in each version differ but the core system monitoring services are common to both. This package has more similarities with the NinjaOne platform and the services offered by N-able that it does to the Network Performance Monitor.
Pros:
- Cloud-Based System: Access the console through a web browser
- Versions for MSPs and IT Departments: Four plans in each set
- Scalable Pricing: A rate per technician
Cons:
- Network Discovery is an Add-On: Requires an extra payment
Start a 30-day free trial.
SolarWinds vs Site24X7
Feature Comparison Table:
| Feature | SolarWinds Network Performance Monitor | Site24x7 Network Monitoring |
|---|---|---|
| Network Discovery | Yes | Yes |
| Network Monitoring | SNMP, ICMP, WMI. You can purchase SolarWinds NetFlow Traffic Analyzer to use NetFlow, jFlow, sFlow, IPFIX and NetStream | SNMP, NetFlow, IPFIX, sFlow, J-Flow, cFlow, AppFlow, NetStream, WMI, DNS, ICMP, IP SLA |
| IPv6 Support | Yes | Yes |
| Topology Map | Yes | Yes |
| Windows Events logs | Yes | Yes |
| Syslog | Yes | Yes |
| Ping and Traceroute | No | Yes |
| Virtual Interface and device monitoring report | Yes | Yes |
| Network configuration management | No -- this is a seperate package | Yes |
| Active Directory | Yes | Yes (in the Application Monitoring unit) |
| Pricing | Starts at $2,892 (£2,245) | From $9 per month |
There are two fundamental differences between the SolarWinds menu of services and the Site24x7 platform. SolarWinds sells its modules individually on a perpetual license while Site24x7 provides plans that include many modules for a monthly subscription fee. Thus, you would buy SolarWinds Network Performance Monitor but subscribe to a package of many tools from Site24x7 that includes the Network Monitoring package. The other big difference between the two is that SolarWinds software is an on-premises package for Windows Server but Site24x7 is a cloud platform.
Key Features:
- Cloud-Based System: A SaaS package
- Network Discovery: Creates a hardware inventory
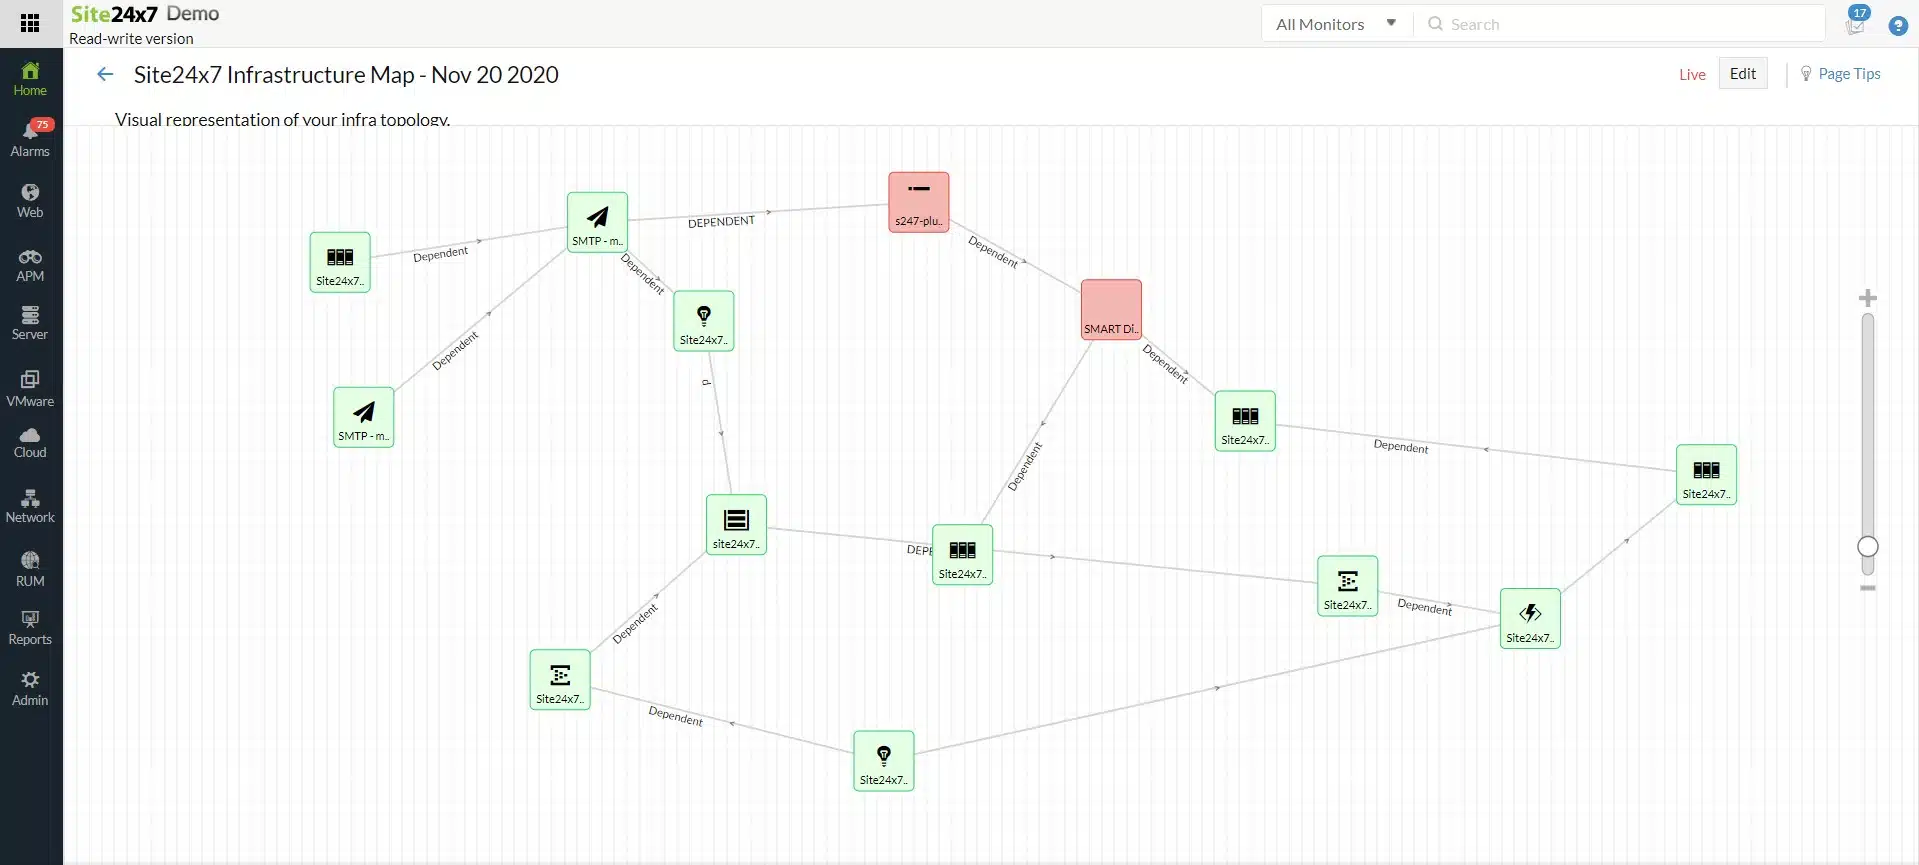
- Network Topology Map: Generated from data in the inventory
Why do we recommend it?
Site24x7 Network Monitoring is part of a platform of many system monitoring and management modules. The full package competes with multiple SolarWinds tools, not just the Network Performance Monitor. The Network Monitoring service of Site24x7 maps to the Network Performance Monitor and the Netflow Traffic Analyzer.
One of the most impressive features of most modern network performance monitoring systems is its ability to populate all of its tables with site data by itself. Both the SolarWinds Network Performance Monitor and the Site24x7 Network Monitoring system have this feature. Both use the Simple Network Management Protocol (SNMP) to poll devices for status reports and this system enables device discovery.
Under the SNMP system, the SNMP Manager doesn’t need to know what equipment is on a network in order to gather reports on statuses because it just broadcasts a request across the entire network. All network devices have device agents installed on them and then constantly listen for a request and respond. Those responses tell the SNMP Manager what devices are on the network and how they connect together.
So, by using SNMP, the Site24x7 Network Monitoring service and the SolarWinds Network Performance Monitor create network inventories. Each tool draws up a network topology map from the information in the inventory. Both tools also use the data in SNMP responses to track the statuses of network devices.
As the inventory data is available with every SNMP request-response cycle, both tools update their inventories if any changes have occurred on the network. This change automatically ripples through to the network topology maps that each maintains.
For a fair comparison between SolarWinds and Site24x7, it would be better to examine the SolarWinds NetFlow Traffic Analyzer as well. This module is a companion to the SolarWinds Network Performance Monitor and it relies on the presence of the NPM, so it can’t be used as a standalone module. This package is also implemented as software for Windows Server.
Both the SolarWinds and Site24x7 systems communicate with switches to extract the traffic statistics that those devices accumulate as part of their working procedures. Unfortunately, each network device producer chooses its own statistics protocol – some use industry standard protocols. This means that a network traffic scanner would only be able to get traffic data from devices that use the protocols that are loaded into the monitor. Thus, the more protocols that a traffic monitor has, the more likelihood that it will be able to communicate with any device. SolarWinds NetFlow Traffic Analyzer uses NetFlow, IPFIX, sFlow, J-Flow, and Netstream. Site24x7 is loaded with NetFlow, IPFIX, sFlow, J-Flow, CFlow, AppFlow, and NetStream.
Key Features Comparison: Alerts
Both SolarWinds and Site24x7 integrate an alerting mechanism into their systems. In the case of the SolarWinds Network Performance Monitor and the SNMP-based device monitoring service of the Site24x7 Network Monitoring system, alerts are provoked by the SNMP Trap messages that device agents send out when their regular scans reveal a component fault.
The traffic analysis component of the Site24x7 Network Monitoring service and the SolarWinds NetFlow Traffic Analyzer both include a series of traffic throughput and capacity thresholds that trigger if traffic volumes approach the full capacity of a switch interface. These thresholds can be adjusted and it is also possible, in both tools, to create new thresholds and triggers. When tripped, these conditions generate alerts.
In both tools, alerts appear in the system console and they can also be sent on to technicians as notifications. These notification instructions need to be set up by an administrator. With SolarWinds, alerts can be sent out by pager, SMS, or email, and in Site24x7 they can be sent by voice call, SMS, email, or Slack message.
Who is it recommended for?
As it is a cloud-based system, Site24x7 competes more directly with Atera and NinjaOne rather than SolarWinds. The Site24x7 platform is marketed in subscription plans that bundle together all the modules offered by the company and there is a plan available for managed service providers.
Pros:
- Full Network Monitoring: Both device and traffic monitoring
- Network Management Services: A network configuration manager and a log manager
- Virtual System Monitoring: Can also monitor virtualizations, VPNs, and cloud virtual servers
Cons:
- No On-Premises Version: Only available as a hosted service
Site24x7 offers many plans that blend all the different modules on the platform in different capacities. All plans are sized with the minimum capacity possible to make them affordable for small businesses and then capacity expansions are available for a fee to suit larger businesses. You can try out the whole Site24x7 platform with a 30-day free trial.
SolarWinds vs Paessler PRTG
Feature Comparison Table:
Feature | SolarWinds NPM | |
|---|---|---|
Network Discovery | Yes (SNMP autodiscovery) | Yes (SNMP autodiscovery) |
Dashboard | Yes | Yes |
NetFlow | No (needs SolarWinds NetFlow Traffic Analyzer) | Yes |
Network Topology Map | Yes | Yes |
APIs | No | Yes |
Automation | No | Yes (with ScriptRunner) |
Mobile AppI | No | Yes |
Customizable Alerts | Yes | Yes |
Operating System | Windows Server | Windows Server |
Cloud Platform | No | Yes |
Wifi Monitoring | Yes | Yes |
Pricing | Starts at $2,892 (£2,245) | Starts at $1.600 (£1,242) |
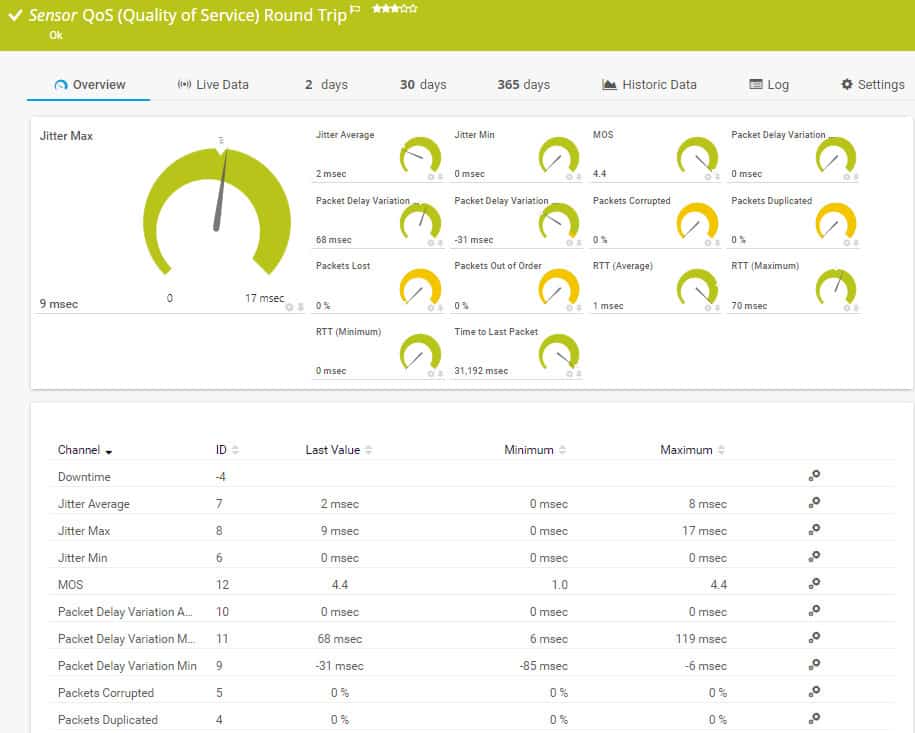
Paessler PRTG is a collection of monitors, each of which is called a “sensor.” Each customer buys an allowance of sensors and activates that number. Comparing Paessler PRTG to the SolarWinds Network Performance Monitor is only possible when the right sensors are used in PRTG. The full complement of PRTG sensors covers the monitoring of networks, servers, and applications.
Key Features:
- Network Discovery: Regular scanning
- Network Asset Inventory: Network topology map
- Device Status Monitoring: Driven by SNMP
Why do we recommend it?
Paessler PRTG is a large package of tools that covers networks, servers, services, applications, and cloud systems in one bundle. Effectively, this is the equivalent of all the SolarWinds monitoring tools in one software package. No one will need all of the sensors in the bundle, so buyers decide which monitors to activate and leave the rest dormant.
The capabilities of PRTG can be extended by add-ons, plug-ins, and scripts. The PRTG system also includes APIs so users can interact with sensors from custom-built programs. Although automation is possible with PRTG, this has to be accomplished by PowerShell programs, such as ScriptRunner. Paessler built PRTG purely to monitor IT infrastructure. As such, it has few remediation tools and no maintenance capabilities. However, the same limitations apply to the SolarWinds Network Performance Monitor.
General industry opinion ranks PRTG as the main rival to SolarWinds Network Performance Monitor, which is the leader in the field. The two tools have a lot in common. Both install on Windows Server, but, in addition, PRTG is available on the Cloud. Prospective buyers can try both of these tools on a 30-day free trial.
Both SolarWinds NPM and Paessler PRTG are based on SNMP and both have very impressive network topology mapping capabilities. Both can monitor remote sites, cloud-based resources, and wi-fi networks as well as traditional wired networks.
The sensors in PRTG extend to functions that SolarWinds markets separately to the Network Performance Monitor. These include NetFlow monitoring and traffic shaping measures, which SolarWinds makes available in the NetFlow Traffic Analyzer. So, it is possible to turn on a certain number of sensors to equate to NPM or turn on more and get the same functionality as the Network Performance Monitor plus the NetFlow Traffic Analyzer. This strategy would cost you more than the base price for PRTG. SolarWinds makes the Network Performance Monitor and NetFlow Traffic Analyzer together in a bundled called the Network Bandwidth Analyzer Pack.
The flexibility of PRTG makes it very appealing. Those who only turn on 100 sensors don’t have to pay anything. However, it would be impossible to replace the Network Performance Monitor with such a limited implementation of PRTG.
Feature Comparison: Alerts
As PRTG is based on SNMP, it processes SNMP Traps into warnings and alerts in exactly the same way as the SolarWinds Network Performance Monitor. This is another area of monitoring that makes NPM and PRTG very difficult to tell apart. Both enable combinations of conditions to create custom alerts and threshold levels can also be adjusted.
Who is it recommended for?
The flexibility of this system means that it should appeal to all sizes and types of businesses. Small businesses can use the package for free if they only activate 100 sensors. One important factor to point out is that PRTG is purely a monitoring system and doesn’t provide any asset management tools.
Pros:
- Alerts for Drive Problems: Can be forwarded as notifications by SMS or email
- Network Traffic Analysis: Based on flow protocols, such as NetFlow
- Free Edition: Supplies 100 sensors
Cons:
- No Version for Linux: The on-premises software is only available for Windows Server
Paessler PRTG Network Monitor is available on a 30-day free trial.
SolarWinds vs ManageEngine OpManager
Feature Comparison Table:
| Feature | SolarWinds Network Performance Monitor (NPM) | ManageEngine OpManager |
|---|---|---|
| Primary Function | Network Performance Monitoring | Network Performance & Infrastructure Management |
| Network Discovery | Automatic Network Discovery | Layer 2 Network Discovery |
| Visualization | Dynamic network maps, customizable dashboards | Real-time dashboards, rack & floor views |
| Alerting & Reporting | Customizable alerts and detailed reports | Threshold-based alerts, advanced reporting |
| Network Analysis | NetPath, PerfStack for root cause analysis | Built-in network analyzer, bandwidth monitoring |
| Configuration Management | Network configuration manager (add-on) | Configuration management included |
| Scalability | Highly scalable for large enterprises | Suitable for medium to large enterprises |
| Integration | Integrates with other SolarWinds tools | Integrates with ITOM and ITSM tools |
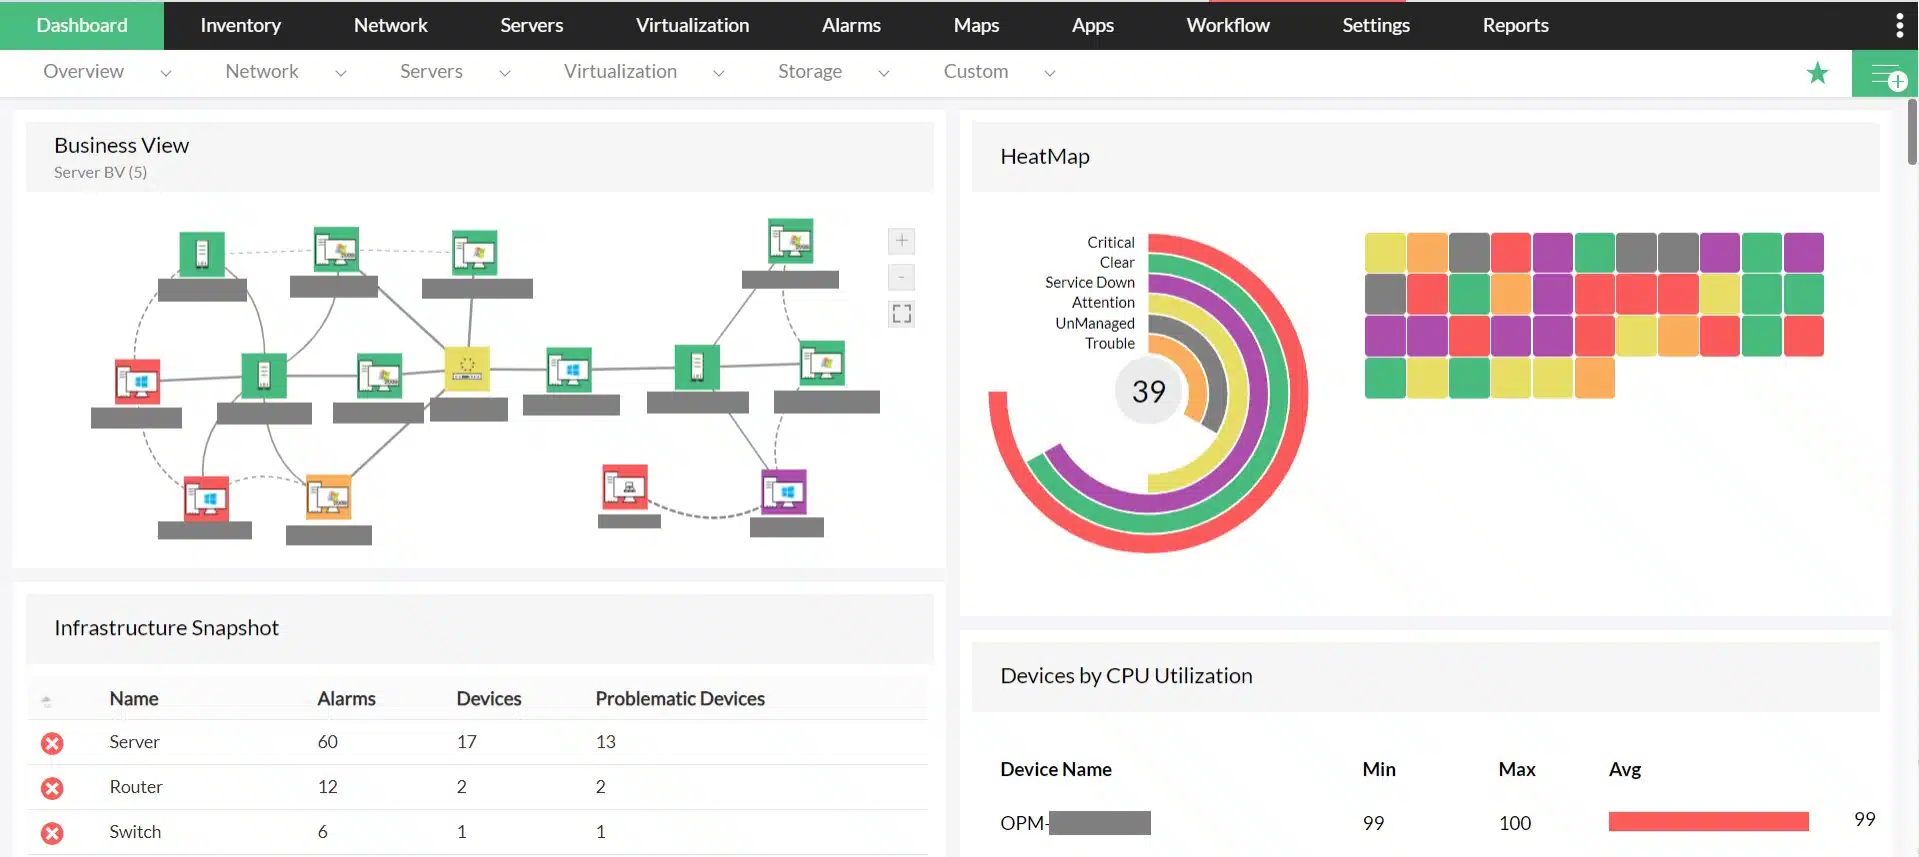
ManageEngine OpManager is known for its user-friendly interface and extensive device support. This tool simplifies network management tasks with automated workflows and real-time monitoring.
Key Features:
- Intuitive Interface: Dashboard is user-friendly, offering an accessible overview of network performance.
- Multi-Vendor Support: Compatible with a wide range of network devices, ensuring flexibility.
- Automated Workflows: Simplifies network management tasks with pre-configured automation workflows.
- Real-Time Monitoring: Provides instant updates and alerts on network performance.
- Customizable Reports: Allows for tailored reports to meet specific business needs.
Why do we recommend it?
ManageEngine OpManager is recommended for its robust feature set and user-friendly interface, which simplify network management tasks. Its extensive device support ensures compatibility across various network environments.
Compared to SolarWinds Network Performance Monitor, OpManager offers a more accessible user experience and streamlined automation workflows, which can simplify network management tasks. However, SolarWinds excels in scalability and in-depth network insights, making it more suitable for large enterprises.
While OpManager is ideal for small to mid-sized businesses looking for a comprehensive yet manageable solution, SolarWinds is better suited for those requiring advanced features and extensive customization options.
Pros:
- User-Friendly Interface: The interface is intuitive and easy to navigate, making network management straightforward.
- Extensive Device Support: Works with a variety of network devices, enhancing compatibility.
- Automated Network Management: Automates repetitive tasks, saving time and reducing errors.
- Real-Time Alerts: Immediate notifications help address issues promptly.
- Customizable Reporting: Reports can be tailored to specific requirements, providing relevant insights.
Cons:
- Complex Initial Setup: The initial configuration can be challenging and time-consuming.
- Resource Intensive: High resource consumption may affect performance on less powerful systems.
Who is it recommended for?
This tool is ideal for network administrators and IT professionals who need comprehensive monitoring and automated management for diverse network devices. It’s particularly suitable for small to mid-sized enterprises.
You can download OpManager on a 30-day free trial.
SolarWinds vs SevOne
Feature Comparison Table:
| Feature | SolarWinds Network Performance Monitor | SevOne |
|---|---|---|
| Network Discovery | Yes (autodiscovery) | Yes (specify subnets to scan) |
| Network Monitoring | SNMP, ICMP, WMI. You can purchase SolarWinds NetFlow Traffic Analyzer to use NetFlow, jFlow, sFlow, IPFIX and NetStream | SNMP, NetFlow, virtual machine monitoring, WMI, HTTP, JMX, IP Telephony, Cisco CallManager, Medianet, DNS, Proxy Ping, ICMP, IP SLA, NBAR, IPFIX, Port Shaker, MySQL, NAM and others |
| IPv6 Support | Yes | Yes |
| Topology Map | Yes | Yes |
| Syslog | Yes | Yes (requires SevOne Performance Log Appliance) |
| Virtual Interface and device monitoring report | Yes | Yes |
| Active Directory | Yes | Yes |
| Pricing | Starts at $2,892 (£2,245) | Contact the sales team |

SolarWinds Network Performance Monitor and SevOne are two of the most well-known network monitoring tools in circulation right now. As the needs of network administrators have evolved at an exponential rate, these two products have been adapting as well. SolarWinds Network Performance Monitor is a Windows-based network monitoring solution that can also be run as a virtual machine and offers a monitoring environment that is structured through the dashboard.
Key Features:
- Network Appliance: Doesn’t take up space on your server
- Graphical Data Interpretations: The dashboard shows data in chart format
- Network Discovery: Provides up to date inventory and topology map
Why do we recommend it?
SevOne is exceptionally good at monitoring networks. It is able to deploy a range of data sampling techniques to identify the network devices that are ground zero for your network problems. The package helps you identify a switch in trouble, find out why, and fix the problem quickly.
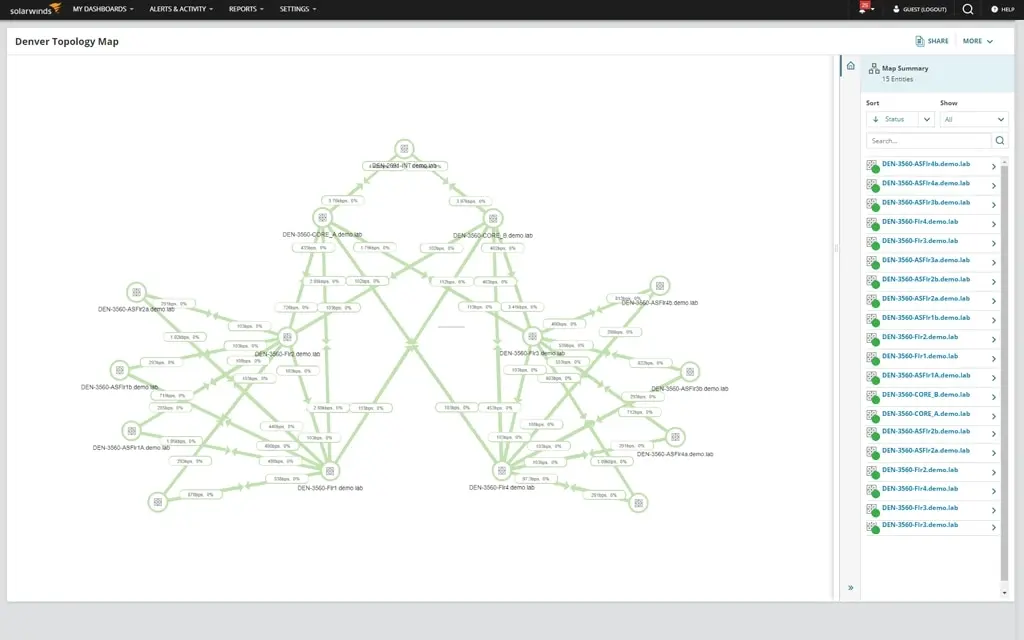
Devices are mapped through the use of network autodiscovery tool and can then be viewed in a variety of visual displays. Visual displays available in SolarWinds Network Performance Monitor include network topology maps to charts and graphs. SolarWinds Network Performance Monitor provides you with an intensely-visual experience with which to monitor. This allows the user to easily see what is going on from a top-down perspective.
SolarWinds Network Performance Monitor’s monitoring ability is underpinned by the use of SNMP, ICMP, and WMI. However, if you want to make use of flow monitoring, you will need to purchase a copy of SolarWinds NetFlow Traffic Analyzer. SolarWinds NetFlow Traffic Analyzer which costs $1,795 (£1,400) and will allow you to conduct NetFlow, jFlow, sFlow, IPFIX, and NetStream.
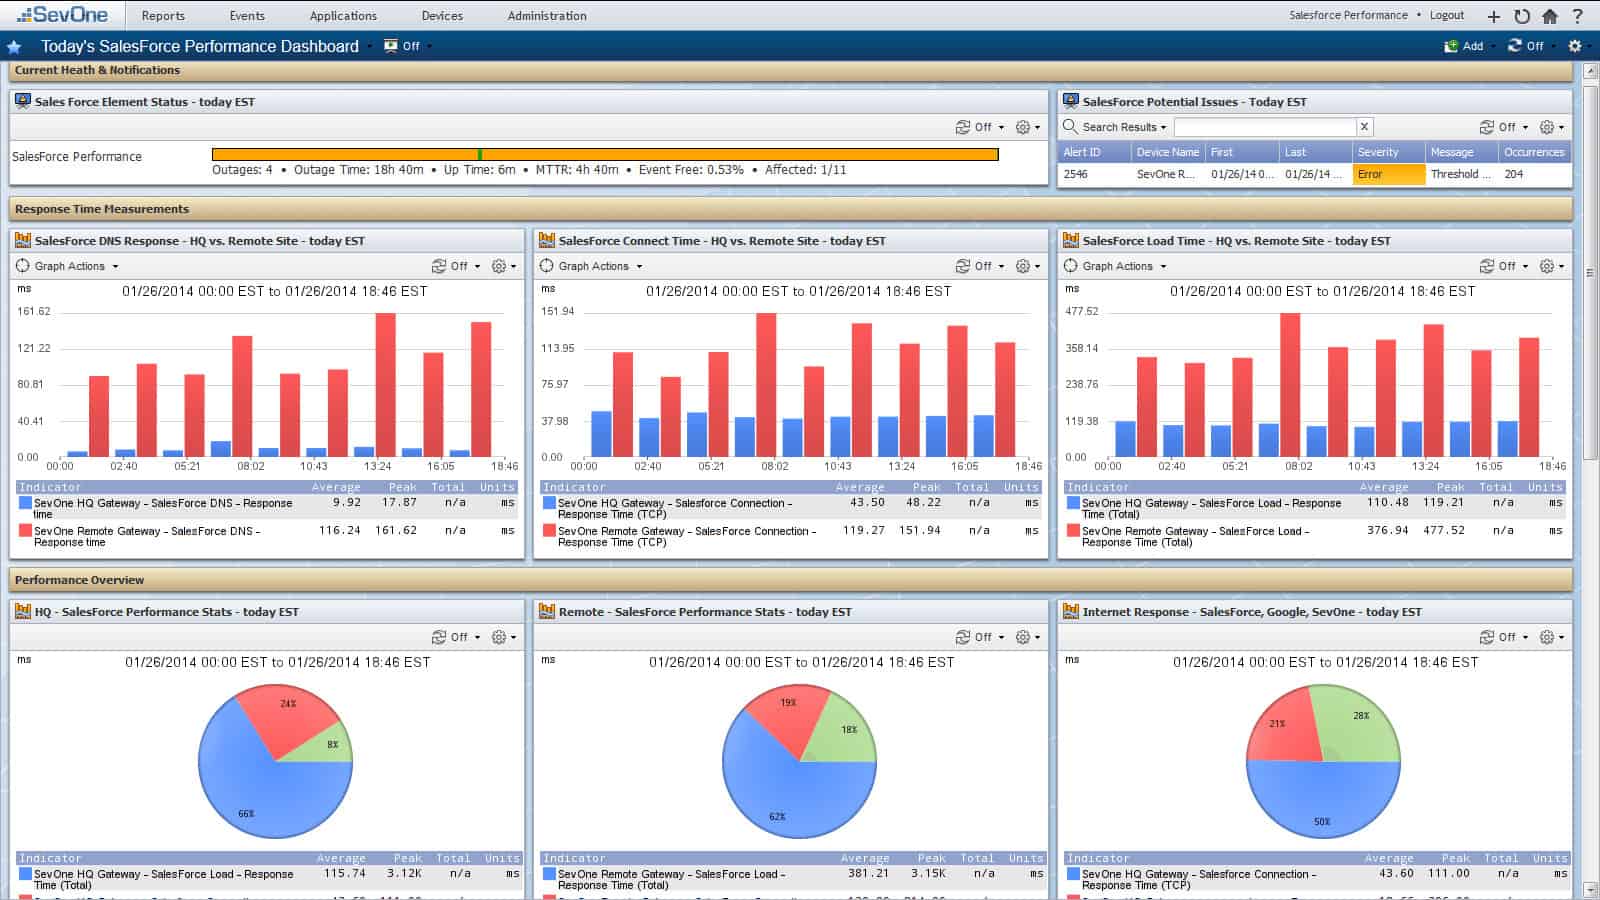
In comparison, SevOne offers a different approach towards network monitoring to SolarWinds Network Performance Monitor. SevOne is deployed as hardware directly to the datacenter which helps to support the potential for upscaling further down the line. The features of SevOne aren’t segregated by modules like they are in SolarWinds Network Performance Monitor either. For instance, if you want to access NetFlow monitoring you’ll find it’s part of the dashboard and you won’t have to click to another tab.
With SevOne you can monitor SNMP, NetFlow, ICMP, IPFIX, and more. The biggest advantage that SevOne enjoys over SolarWinds Network Performance Monitor is that it offers support for NetFlow. NetFlow is essential for conducting bandwidth analysis and while you can purchase SolarWinds NetFlow Traffic Analyzer, the lack of this feature makes it a missed opportunity for SolarWinds Network Performance Monitor.
Key Feature Comparison: Alerts
One of the most important areas to look at when considering a new network monitoring tool is alerts. Having the right alerts system helps to keep you in the loop even when you’re not glued to your device. Alerts are an area where both SolarWinds Network Performance Monitor and SevOne perform very well. SolarWinds Network Performance Monitor has an alerts system that lets you know when devices are close to failure (or when they have failed).
This ensures that you are only notified when devices are in serious jeopardy and cuts down the amount of irrelevant notification messages that are a problem with some other network monitoring platforms. You can also customize your experience by configuring network alerts to be triggered by specific criteria. Likewise, there is also the potential to set trigger conditions so that an alert is activated once something specific happens.
Alerts are then sent by email and SMS so that can be acted on. The ability to customize your alerts in this way is extremely handy, and this is something that SevOne does very well. SevOne operates a threshold-based alerts system that notifies the user when pre-configured alerts thresholds are violated. You can view alerts via an email, the dashboard or through the SevOne mobile app.
Having custom alert triggers ensures you keep in touch with what is going on and don’t overlook anything that could cause you unexpected downtime. Based on the usability and simplicity it has to be said that SolarWinds Network Performance Monitor has the better alerts system. It is easier to use and provides a monitoring experience that allows you to take a step back thus preventing endless notifications.
Who is it recommended for?
Packet loss and jitter are usually caused by overloaded or unresponsive switches and the SevOne package quickly identifies which switch is the cause and what is wrong with it. As it is a hardware device, the upfront costs of using SevOne are high. This is a solution for large and complicated networks.
Pros:
- Network Device Monitoring: With SNMP
- Network Traffic Analysis: Uses flow protocols
- Alerting is Simple to Implement: Sends by email, SMS, or a mobile app
Cons:
- No Price List: Must contact sales for pricing
SolarWinds vs NetBrain
| Feature | SolarWinds Network Performance Monitor | NetBrain |
|---|---|---|
| Network Discovery | Yes (SNMP autodiscovery) | Yes (CLI data autodiscovery) |
| Dashboard | Yes | Yes |
| NetFlow | No (needs SolarWinds NetFlow Traffic Analyzer) | Yes |
| Network Topology Map | Yes | Yes |
| APIs | No | Yes |
| Automation | No | Yes |
| Mobile App | No | Yes (Qapp) |
| Customizable Alerts | Yes | Yes |
| Pricing | Starts at $2,892 (£2,245) | Contact the sales team |
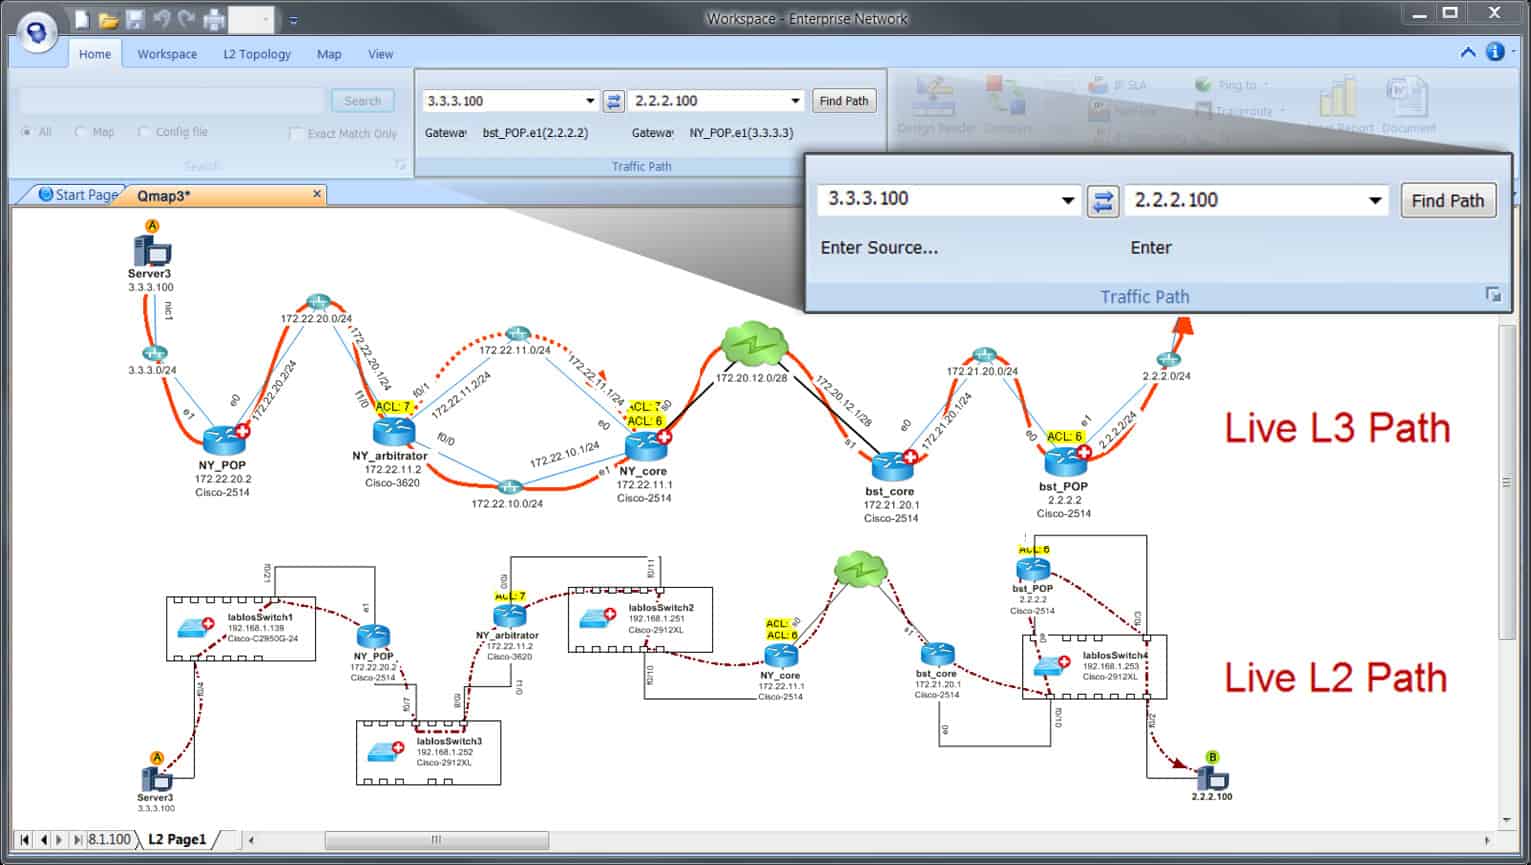
While NetBrain isn’t as well-known as SolarWinds Network Performance Monitor, it is still one of the most highly-functioning network monitoring products on the market. One of the features that makes NetBrain stand out is its network discovery. NetBrain has its own autodiscovery feature but instead of doing the SNMP polling that SolarWinds is well-known for, NetBrain builds a mathematical model from live data and collects CLI data from connected devices.
Key Features:
- Network Discovery: Uses packet sniffing instead of SNMP
- On-Demand Path Analysis: Shows a graphical representation
- Shows Capacity and Throughput: Writes statistics onto every link in the path map
Why do we recommend it?
NetBrain is a similar package to SevOn in that it combines device status checks with traffic analysis. This tool gets around the problem that remote management teams sometimes encounter with switches that have SNMP capabilities turned off. Most device monitoring systems simply do not know that those devices exist and there is no way of knowing about them without a site visit.
The main advantage this method of autodiscovery has over SolarWinds Network Performance Monitor’s SNMP polling is that it can collect data from all devices. In contrast, SolarWinds Network Performance Monitor can only poll SNMP-enabled devices. In this sense, NetBrain provides you with more visibility because it allows you to view all of those devices.
NetBrain also has compelling visualization. You can use NetBrain to create on-demand network topology maps to see how your network is working from a topological perspective. These are built from live data to ensure that everything you view is completely correct. In the event that your network changes, the NetBrain platform will update your network topology map so that you do not need to update it manually.
SolarWinds Network Performance Monitor has a similar setup in that you can also create network topology maps with the NetPath critical visualization. This feature allows you to view your network from a hop-to-hop perspective. While this is similar to NetBrain’s it has a much higher production value that makes the monitoring experience more satisfying on the whole.
Feature Comparison: Alerts
NetBrain also offers an alerting experience in line with SolarWinds Network Performance Monitor’s. With NetBrain you can not only receive alerts, but also configure a ticketing system that automatically triggers NetBrain analysis once an alert has been raised. This helps the user to run informed troubleshooting and helps to pinpoint the cause of the problem. On NetBrain the user is provided with a Dynamic Network Map displaying the area in question
You can also configure escalation through the use of APIs. This ensures that you don’t need to email log files in order to receive a prompt response. In threat response this is instrumental in helping you to respond before any damage takes hold. In terms of automation, NetBrain has a distinct edge over SolarWinds Network Performance Monitor.
Who is it recommended for?
The discovery and mapping services in NetBrain are great assistants to network administrators. They support path analysis and show link capacity and utilization. This equates to the NetPath tool that you get with SolarWinds only if you buy both the Network Performance Monitor and the NetFlow Traffic Analyzer with the Network Bandwidth Analyzer Pack.
Pros:
- Discovery Creates a Network Inventory: Details attributes of each discovered device
- Network Traffic Analysis: Uses NetFlow
- Troubleshooting Support: See which links are overloaded
Cons:
- No Price List: Must contact sales for a quote
SolarWinds vs Splunk
| Feature | SolarWinds Network Performance Monitor | Splunk |
|---|---|---|
| Autodiscovery | Yes | No |
| Real time Network Monitoring | Yes | Yes |
| Dashboards | Yes | Yes |
| Machine Learning | No | Yes |
| Add-Ons | No | Yes (over 1000) |
| Automation | No | Yes (automate log search and analysis) |
| Pricing | Starts at $2,892 (£2,245) | Starts at $75 per month for Splunk light (up to five users) and $150 per month for Splunk Enterprise |
Splunk is one of the biggest SolarWinds alternatives on this list. Splunk is a highly-regarded provider of network monitoring solutions. With Splunk, you can monitor your network in real time. Splunk uses machine data from your connected devices to measure how well your environment is performing. You can even use Splunk’s Search Processing Language (SPL) to search through this data in real time.
Key Features:
- Data Processing Package: Set it up to analyze any data stream
- Splunk Observability Cloud Package: A paid extra
- Splunk Enterprise Security: A SIEM
Why do we recommend it?
Splunk is a data analyzer that can be used for assessing any dataset. However, you need to design your analysis system by specifying data sources, search queries, and display formats. There are packages that you can buy for Splunk that create a service similar to the Network Performance Monitor. However, these still need a great deal of work to set up.
However, what makes Splunk a particularly interesting network monitoring tool is its automatic detection capabilities. For instance, it can detect abnormal data patterns across your network. You can even recognize the patterns of common cyber attacks that could damage your network. Splunk’s automatic detection abilities help to identify security and performance concerns that could cause you significant problems further down the line.
In terms of visual design, Splunk is very similar to SolarWinds Network Performance Monitor. There are graphs and charts to help you see what is going on, as well as a clear dashboard design. Though these two bear a resemblance, SolarWinds Network Performance Monitor’s simple layout and the rapid flow from dashboard to individual views makes for a much smoother user experience.
Feature Comparison: Alerts
As one of the best network monitoring tools on this list, it is no surprise that Splunk also has its own alerting capabilities. You can create real time alerts to notify you of events as they happen. You can also schedule alerts if you want to keep the impact on your computer as minimal as possible. This allows you to minimize the effects on your performance as you keep up-to-date with changes on your network.
You can also create alert conditions to specify when you want to be notified. The advantage of doing this is that you can set up the behavior that you want to monitor for. The end result is a monitoring environment where you only need to step in if the system monitors you that something problematic has happened.
The one limitation of Splunk that stands out is that the alerts system feels one dimensional when compared to the approach of SolarWinds Network Performance Monitor and the other tools on this list. The simplicity offered by SolarWinds Network Performance Monitor’s alerts system is one of the things that makes it standout from the crowd.
Who is it recommended for?
Splunk wouldn’t be your first choice is you just want a system to monitor network devices. The base package of the tool is just a framework for creating your own data analysis system. The observability package is way bigger than just a network monitoring system. The closest package to the NPM is the Splunk Infrastructure Monitoring unit.
Pros:
- Behavior Analysis Module: Look for unusual user activity
- Full Stack Observability: Correlate activity across the service stack
- Deployment Options: Available on premises for Linux and Windows or as a SaaS platform
Cons:
- Not Very Strong at Network Monitoring: Good at monitoring from the server up
SolarWinds vs Extrahop
| Feature | SolarWinds Network Performance Monitor | ExtraHop |
|---|---|---|
| Autodiscovery | Yes | Yes |
| Dashboards | Yes | Yes |
| Automation | No | Yes (and integrated with Phantom, Amazon Web Services, Servicenow, Splunk) |
| Rest API | No | Yes |
| Machine Learning | No | Yes |
| Pricing | Starts at $2,892 (£2,245) | Starts at $14,500 (£11,302) |

Extrahop is a network monitoring provider which has its sights firmly fixed on threat prevention. Extrahop offers a cutting-edge network monitoring experience that aids the user to cut out the unnecessary data and see the crucial information about what is going on. The dashboard is the heart and soul of where you conduct your monitoring activity with Extrahop.
Key Features:
- Focused on Network Scanning: Provides security and performance monitoring
- Predictive Alerts: Uses machine learning to forecast imminent requirements
- Hybris Systems: Tracks performance around the network and out to cloud services
Why do we recommend it?
Extrahop provides two systems: security monitoring and network performance monitoring. So, when comparing this platform to the SolarWinds Network Performance Monitor, you need to look at the latter. This package includes anomaly detection that is based on AI and generates alerts accordingly.
However, Extrahop’s approach to network monitoring is very different to the modus operandi of most providers. ExtraHop is much more focused on data analytics. That being said, you can still view your past usage data in a variety of time windows whether you want to check daily events or a week’s worth.
The machine-learning system operated by Extrahop is called ExtraHop Addy. ExtraHop Addy is a cloud-based machine learning service for wire data. In a nutshell this product scans for patterns in your usage data to help detect abnormalities and performance issues. The biggest perk of this setup is that it reduces the amount of manual troubleshooting the user needs to do to resolve network faults.
Extrahop also has the ability to autodiscover devices throughout the network. This means that if a new device is connected it is added to your monitoring environment. Once it’s connected there is support for over 50 protocols and almost all TCP, and UDP systems. It is also high performance in the sense that it can run up to 100 Gbps of traffic.
While Extrahop offers a compelling package in terms of machine learning, its traditional network monitoring abilities are not as complete as SolarWinds Network Performance Monitor. Though SolarWinds Network Performance Monitor doesn’t have the machine learning ability of Extrahop, it makes up for this by providing a tried and tested network monitoring formula that has maintained countless organizations over the years.
Who is it recommended for?
Extrahop is a very advanced network device monitor but all of its wizzy AI features are a little overengineered. The end result of all of its hard work is an alert if there is a problem with a network device. However, that’s exactly what SolarWinds provides just by picking up and processing SNMP messages: the same result for a lot less effort.
Pros:
- Discovery and System Documentation: Constantly updates a network inventory
- Automatically Generated Network Map: Shows throughput data on each link
- Immediate Root Cause Analysis: Draws attention to the node that is underperforming
Cons:
- Doesn’t Provide Monitoring for Systems Above the Network: No network management tools either
King of the Hill: SolarWinds Network Performance Monitor
All in all, SolarWinds Network Performance Monitor performs well consistently across the board. While tools like Extrahop offer better features in terms of machine learning, SolarWinds Network Monitoring offers the most complete classic network monitoring experience on the market.
It is fair to say that tools like SevOne have the advantage when it comes to NetFlow analysis, and the lack of a NetFlow analysis ability on SolarWinds Network Performance Monitor is a considerable limitation (particularly given that you have to pay extra for this program!). Yet SolarWinds Network Performance Monitor remains one of the most appealing network monitoring platforms based on how it puts its network monitoring experience together.
If you’re looking for a network monitoring platform that’s easy to set up, with autodiscovery, topology maps, alerts, and reports, then SolarWinds Network Performance Monitor is as good as it gets. Whether you’re in an SME or a multinational organization this product has the bandwidth to be able to cope with your usage requirements.

