
Wireshark is a powerful tool, but it has its limitations. Unless you have professional networking equipment, it’s hard to analyze traffic that doesn’t involve your computer.
Sometimes the easiest solution is to use tcpdump to capture traffic on the remote server, and then run Wireshark to take a look at it.
What are Wireshark and tcpdump?
Wireshark and tcpdump are two powerful network analysis tools commonly used by network administrators and security professionals.
Wireshark
Wireshark is a free, open-source package that reveals packet content, including headers, and provides its own query language. It’s important attributes include:
- Graphical Interface: Wireshark is known for its user-friendly graphical interface, making it accessible even for those with less experience in network analysis.
- Packet Capture and Analysis: It captures network packets in real-time and allows for deep inspection of hundreds of protocols. Users can see detailed information about the network traffic.
- Filtering and Coloring Rules: Wireshark offers sophisticated filtering options and coloring rules to help users quickly identify and analyze specific types of traffic.
- Cross-Platform: It runs on various operating systems, including Windows, MacOS, and Linux.
- Use Cases: It is widely used for network troubleshooting, protocol development, and educational purposes.
tcpdump
The free tcpdump system is a veteran packet analyzer, first released in 1988. This system steadfastly refused to move with the times when GUI applications became available. Nonetheless, it is still highly respected for traffic analysis for these reasons:
- Command-Line Interface: tcpdump is a command-line packet analyzer. Users interact with it through terminal or command prompt.
- Packet Capture: It captures packets from a network interface and displays their contents as they are received.
- Scripting and Automation: tcpdump is highly suitable for scripting and automation in network monitoring and analysis tasks.
- Lightweight: Being a command-line tool, tcpdump is lightweight and efficient, making it ideal for use on servers and in environments with limited resources.
- Use Cases: It is often used for network debugging, traffic analysis, and capturing packets for later analysis with tools like Wireshark.
Resources and Further Learning
You can check out our tcpdump cheat sheet to learn more about installing, packet capturing, logical operations, protocols, and more.
See also: Wireshark Alternatives
Before you begin
To follow the directions in this guide, you’ll need the following:
- A remote computer with an SSH server and tcpdump installed
- Root access
- Services that generate network traffic, like Apache or node.js, running on the remote computer
- A local computer with an SSH client and Wireshark installed
The goal is to use tcpdump commands on the remote computer, through SSH, to capture network traffic. Then the captured traffic can be copied to the local computer for analysis with Wireshark.
This is useful when you don’t have physical access to the remote machine or are running it ‘headless,’ i.e. without a keyboard and monitor.
Capturing packets with tcpdump remotely through SSH
In order to capture traffic with the tcpdump command, you’ll need to connect to the remote computer through SSH. You will also need root access, otherwise the tcpdump won’t be able to capture traffic and you’ll see an error stating You don’t have permission to capture on that device.
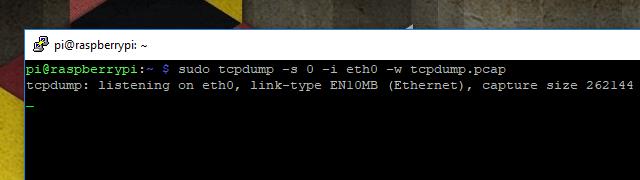
Once you’ve connected, run the following command to start capturing traffic with tcpdump:
sudo tcpdump -s 0 -i eth0 -w tcpdump.pcap
The command-line options I’ve used to capture this session will be explained below. In short, the above command will capture all traffic on the Ethernet device and write it to a file named tcpdump.pcap in a format compatible with Wireshark.
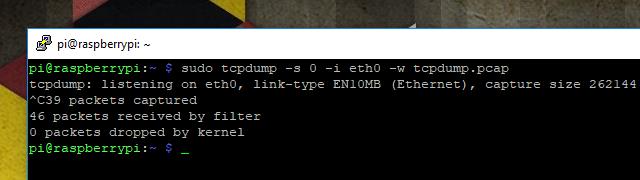
Once you’ve finished capturing traffic, end the tcpdump session with Ctrl+C. You’ll see a short readout displaying some information about the capture session.
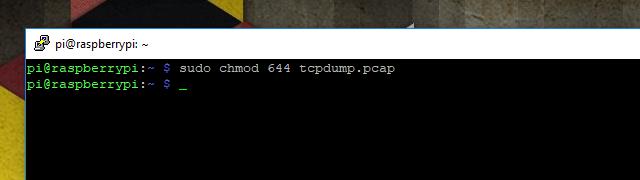
Before you can copy the traffic from your remote computer to the local one for analysis with Wireshark, you’ll have to change the permissions. By default, tcpdump sessions captured by the root user can’t be copied. Use this command:
sudo chmod 644 tcpdump.pcap
That will allow you to copy the file to your local machine using scp, as outlined in the next step.
Copying a tcpdump session for analysis
Once you’ve finished a capture session with the tcpdump command, you’re left with a problem. How do you copy it to the machine running Wireshark for analysis? There are a lot of ways, but I think the easiest is with scp. Since you’ve already captured network packets on a headless machine using SSH, everything you need to use scp is already installed and running.
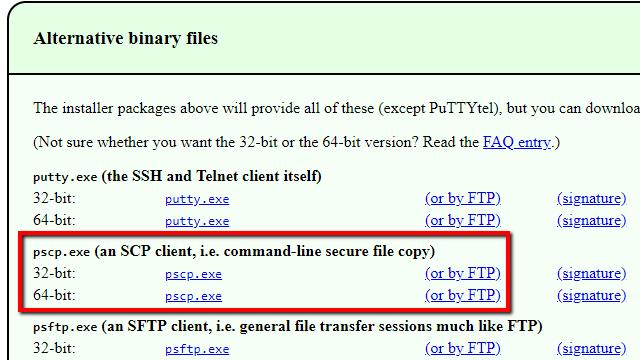
Windows users will have to download pscp, then copy the file to C:\Windows\System32. Most Mac and Linux users already have everything they need.
In Mac or Linux, open a terminal window and run the following command to copy the session capture file:
scp username@IP.address:/path/to/file ./
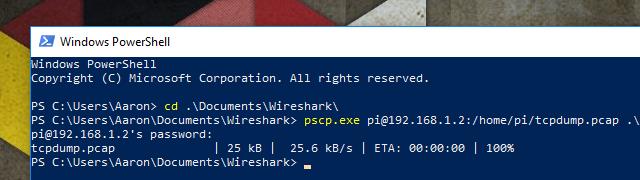
Or in Windows, open PowerShell and run this command:
pscp.exe username@IP.address:/path/to/file .\
Substitute with your information where appropriate. You’ll be prompted to enter your password. The commands I used are in the screenshot above for reference.
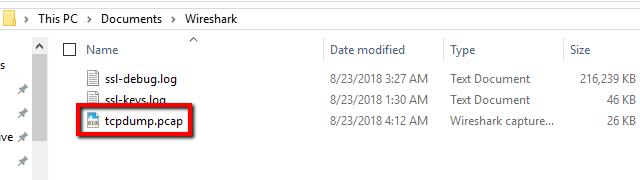
Check to see that the file copied as expected, and you’re ready to analyze the tcpdump session with Wireshark.
Analyzing a captured tcpdump session with Wireshark
Analysis works the same as it does with any traditional Wireshark capture; the only thing you need to know is how to import the file.
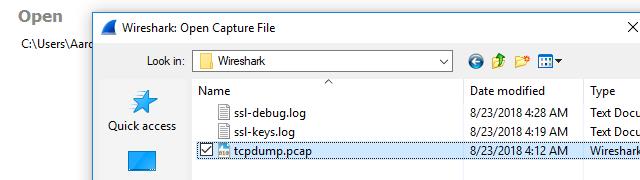
Start Wireshark, then import the tcpdump captured session using File -> Open and browse for your file. You can also double-click the tcpdump capture file to open it in Wireshark, as long as it has the *.pcap file extension. If you used the -w option when you ran the tcpdump command, the file will load normally and display the traffic.
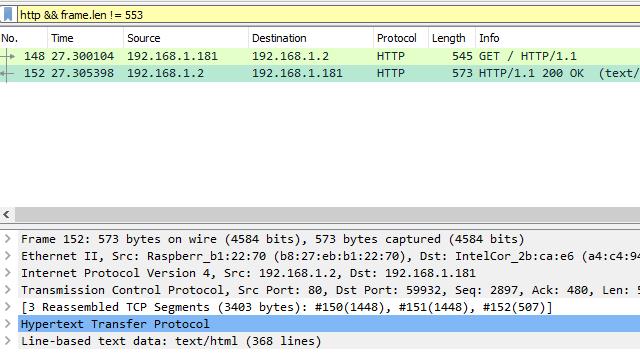
In my case, I’m running an Apache server on the remote host, and I’m interested in looking at HTTP data. I set the appropriate Wireshark view filter, and I can browse the captured frames as usual.
As a test, I’ve embedded an element in the HTML code that’s not displayed on the page. I should be able to locate it in the data stream and view it with Wireshark.
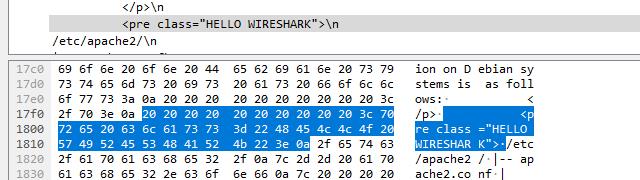
As you can see, Wireshark is able to analyze each frame and display the data just fine. The element I’ve hidden shows up in the example above. The capture process is a bit more involved when you use the tcpdump command, but everything in Wireshark works as usual.
Using command-line options for tcpdump
Most of the time, when you launch tcpdump you’ll want some control over how you capture the packets and where you store the session. You can control things like that using command-line options. These are some of the most useful command-line options for tcpdump.
tcpdump -w
The -w command-line option enables Wireshark compatible capture output. It takes a single variable, which is the tcpdump output filename. Capture logs saved using this option won’t be human-readable outside of Wireshark, since they’re stored in binary rather than ASCII.
tcpdump -C
The -C command-line option enables you to set a maximum file size in bytes. This option only works alongside -w. For example, the command tcpdump -C 1048576 -w capture.pcap specifies a maximum capture size of 1MB (1,048,576 bytes) output to the file capture.pcap.
If the session generates a larger amount of output, it will create new files to store it in. So a 3MB capture would generate capture.pcap, capture1.pcap, and capture2.pcap each with a file size of 1MB.
tcpdump -s
The -s command-line option sets a maximum packet length for each in bytes, and truncates the packet when the maximum is reached. The command tcpdump -s 0 sets an unlimited length to ensure that the whole packet content is captured.
tcpdump -i
The -i command-line option specifies which network device you’d like tcpdump to monitor. If no interface is specified, it defaults to the lowest numbered interface that is currently running.
tcpdump -list-interfaces
The command-line option tcpdump -list-interfaces will print a list of all interfaces that are available for tcpdump to attach to. Note that this doesn’t start a capture session, but it will give you a list of interfaces to use with the -i option above.
tcpdump -c
The -c command-line option tells tcpdump to exit the session after capturing a specified number of packets.
tcpdump -n
The -n command-line option instructs the tcpdump command not to resolve IP addresses to hostnames. This is useful when troubleshooting websites behind a load-balancing server, and in a handful of other cases when using a hostname would give ambiguous results.
tcpdump -v | -vv | -vvv
The three command-line options, -v, -vv, and -vvv allow you to increase the verbosity of your capture session. -v will save TTL values for each packet, along with ToS information. -vv will output TTL and ToS along with additional information in NFS packets. And -vvv will log everything the first two options do, along with additional information from telnet sessions.
tcpdump -F
The -F command-line option instructs the tcpdump command to use capture filters from the specified file. More information about writing a capture file can be found in the next section.
Using capture filters for tcpdump
Capture filters let you narrow down the data that tcpdump stores in a session. They’re a helpful way to make data analysis a little easier and keep capture files small. Here are some of the most useful capture filters for tcpdump.
host
This filter specifies that only traffic to and from the target host should be captured. It takes an IP address or hostname as an argument.
net
The net filter will tell your computer to only capture traffic on a given subnet, and takes an IP address as an argument. For example, 192.168.1.0/24 specifies that traffic to or from all hosts on the subnet will be captured. Note that a subnet mask in slash notation is required.
dst host
Similar to host, this capture filter specifies that only traffic with a destination of the given host will be captured. It can also be used with net.
src host
Like above, but this filter only captures traffic originating from the specified host or IP address. It can also be used with net.
port
This filter tells tcpdump to capture traffic to and from a given port number. For instance, port 443 will capture TLS traffic.
portrange
Similar to the port filter, portrange establishes a range of ports on which traffic is captured. To use the portrange filter, specify the starting port and ending port separated by a dash. For example, portrange 21-23.
gateway
The gateway filter specifies that your computer should only capture traffic that used a given hostname as a gateway. The hostname must be found in /etc/hosts.
broadcast
The broadcast filter specifies that tcpdump should only capture traffic that is being broadcast to all hosts on a subnet.
IP multicast
This filter tells tcpdump to capture only multicast traffic on the host machine’s subnet.
and/or/not operators
Filters can be chained together using the and, or, or not operators. For instance, to capture all web traffic on a given host you could use the filter port 80 or port 443. Or you could capture all traffic on a given subnet except broadcast packets by using the filter net 192.168.1.0/24 and not broadcast.
It’s very common to use filter operators in practice since they provide an additional layer of granularity to your captures. You can capture exactly the traffic you need, without a lot of extra network chatter.
Complex expressions with multiple operators
Even more complex expressions can be built by surrounding multiple operations in single apostrophes and parentheses. For example, you can monitor all mail traffic, including SMTP, IMAP, IMAP over TLS, POP3, and POP3 over TLS, across multiple hosts and subnets, using a command like this:
tcpdump '(host 10.0.0.1 and net 192.168.1.0/24) and ((port 25 or port 143 or port 443 or port 993 or port 995))'
Complex expressions with multiple operators can be very useful, but they are typically saved to a filter file for reuse since a single typo will cause the capture to fail. Frequently, they’ll need to be prepared ahead of time and debugged.
See also: Variable Length Subnet Mask Tutorial
Using filter files for tcpdump
The filters above can be run on the command line when tcpdump is launched, but often it’s useful to build a filter file. A filter file makes it easier to reproduce filter settings between captures since it is reusable. Here are the steps to writing and using a filter file.
Write the filter file
Filter files use exactly the same notation as the command line. They don’t require any special characters or magic numbers at the top of the file.
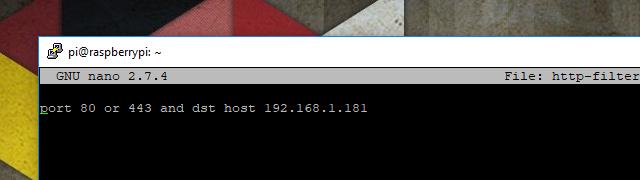
For instance, here’s a filter file I’ve written that will capture all web traffic outbound from my Apache server to a given host. In this case, the Chromebook I’m writing on.
As long as the file is readable by the user running the tcpdump command, the program will attempt to parse everything in the filter file and use it as a valid filter. When a filter file is used along with command-line filtering, all command-line filtering will be ignored.

Instruct tcpdump to use any given filter file using the -F command-line option, followed by the path to the file. In the example above, the filter file is located in the same directory that I’m executing tcpdump in.
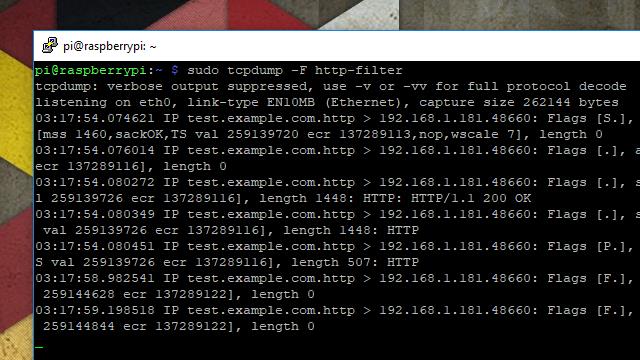
Here’s the raw packet capture output from the filtered session. You can see that the only packets being logged originate on port 80 or 443, and are outbound to the host at 192.168.1.181.
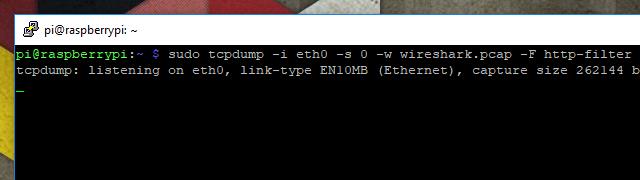
Once you see your filter is working as intended, capture a session to be analyzed with Wireshark using a command similar to this:
sudo tcpdump -i eth0 -s 0 -w wireshark.pcap -F filter-file
Wireshark and tcpdump
Unless you’re running a managed switch with an administration port, sooner or later you’ll need to capture traffic on a remote server. When Wireshark alone won’t do the job, Wireshark with tcpdump is a popular choice. The two work really well together and, with a few simple command-line options, tcpdump will export capture sessions that can easily be analyzed in Wireshark.
Wireshark tcpdump FAQs
How do I tcpdump an IP address?
The host filter will reduce the tcpdump to the traffic for just one IP address, use the host filter. This should be followed by the IP address. For example, tcpdump host 192.168.0.10. To reduce the output further you can specify only traffic originating at that IP address with the src option or only traffic going to that IP address with the dst option, eg: tcpdump src host 192.168.0.10.
How do I use tcpdump on a specific port?
You can select all traffic for a specific port with a filter on the tcpdump command. This method will also give you specific protocol traffic just as long as you know the port used for that protocol. The filter is port and it is possible to specify just TCP or UDP traffic with the options tcp and udp. Examples: tcpdump port 53 or tcpdump udp port 53.
What is remote packet capture protocol?
Remote Packet Capture Protocol is a program, called RPCAPD.EXE. This is implemented as a daemon and is part of WinPCap. The Remote Packet Capture Protocol daemon acts as an agent on one computer, allowing packets to be captured from it according to commands issued on another computer.
Why doesn't tcpdump capture passwords like ftp and ssh unlike Wireshark?
It is possible to capture ftp passwords with tcpdump. Run tcpdump -nn -v port ftp or ftp-data and search the output for USER to get the username and PASS to get the password. Even Wireshark won’t decrypt an SSH session, including the login credentials without already knowing the key used to encrypt the connection. Neither tcpdump or Wireshark can get the username or password for an SFTP or FTPS session.


Great article, helped me a lot, thank you VERY much!