

A data breach incurs serious consequences no matter whether a company is big or small. Staff get fired, executives issue apologies, and entire systems are overhauled to ensure that it doesn’t happen again. They instill doubt in consumers, damage the company’s reputation, and the impact can last for years. A data breach can harm both public sentiment and a company’s competitive edge in the market.
But how do investors react to data breaches? Does Wall Street punish companies that leak customer data? This is the question we will attempt to answer.
We analyzed the closing share prices of 118 companies, all of them listed on the New York Stock Exchange, starting the day prior to the public disclosure of their respective data breaches.
Key findings
- Stocks of breached companies on average underperformed the NASDAQ by -3.2% in the six months after a breach disclosure
- Stock prices bottomed out 41 business days following a breach, sinking -1.4% on average
- Stock prices recovered to their pre-breach disclosure levels 53 days after a breach
- The average share price of healthcare companies fell the most after a breach, followed by finance and manufacturing
- Counterintuitively, breaches of highly sensitive data like Social Security numbers had less of a negative impact on share price than breaches of non-sensitive info like email addresses
- Breaches impacting a larger number of records had a greater negative impact on share price than smaller breaches, but not by much
- Breaches that occurred prior to 2015 had the greatest impact on share price
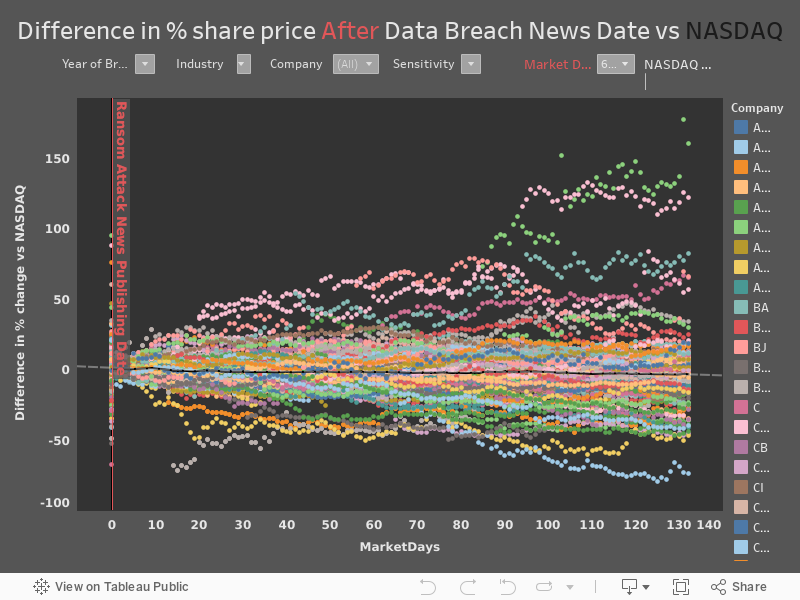
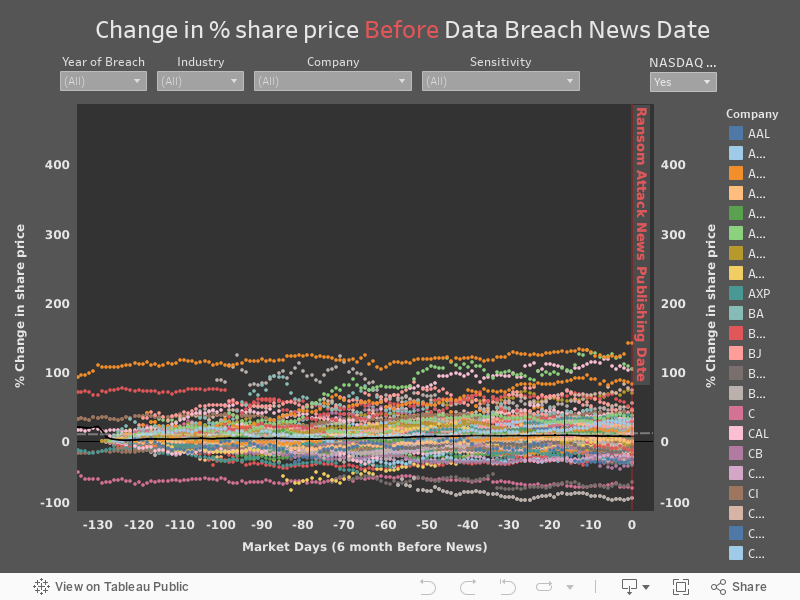
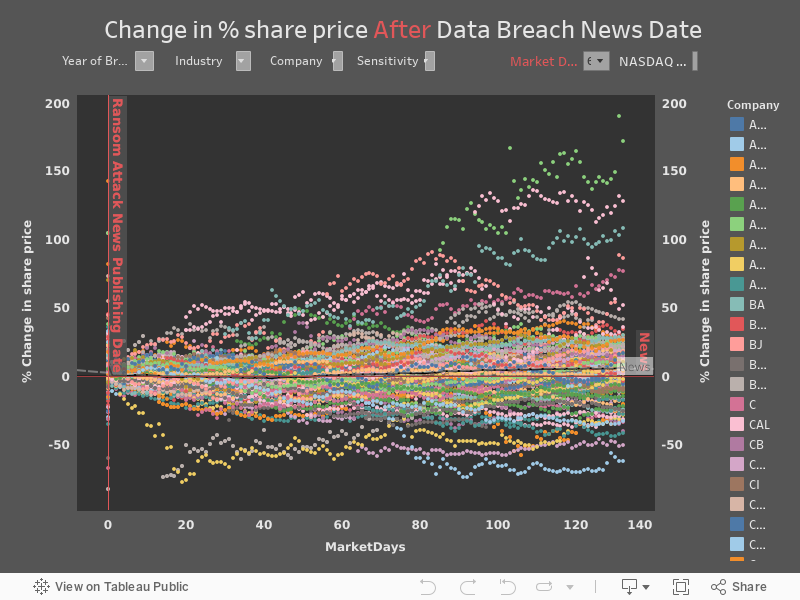
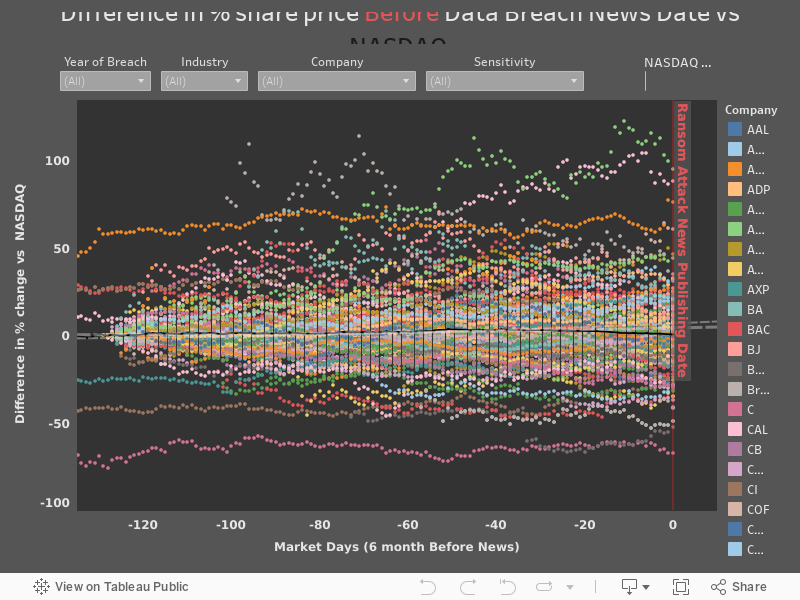
In the six months prior to breach disclosure, share prices on average rose +7.3% (+0.7% vs NASDAQ). Six months after breach disclosure, prices rose +5.9% (-3.2% vs NASDAQ).
Share prices bottomed out 41 days after breach disclosure, falling -1.4% (-1.9% vs NASDAQ). Those prices recovered to their pre-disclosure levels after 53 days on average, but the NASDAQ outpaced them overall.
Industry
Healthcare companies took the biggest hit to their share prices, which underperformed the NASDAQ by -10.6% in the six months following disclosure. Finance (-6.4%) and manufacturing (-4.0%) followed.
Retail was the most resilient sector, with share prices outperforming the NASDAQ by +7.29% after six months.
Tech companies, as well as all the other companies not listed in the above industries (food and beverage, transportation, travel, media) fell about -2.5% versus the NASDAQ.
Size of breach
The size of the breach, measured by the number of records affected, didn’t have as large of an impact on share price as expected.
Share prices following breaches of more than 100 million records underperformed the NASDAQ by -1.2%. Companies with 10 million to 99 million records breached underperformed by -1.5%. For 1 million to 9.9 million records, prices actually outperformed the market by +3.6%. And for less than 1 million records, share price performance didn’t deviate much from the NASDAQ.
Sensitivity of stolen info
Perhaps the most counterintuitive finding in our study, data breaches involving highly sensitive info such as Social Security numbers had less of a negative impact than those involving less sensitive info like email addresses. We grouped stocks together according to the types of data breached into three categories:
- High sensitivity: Social Security numbers, credit and debit cards
- Medium sensitivity: Unencrypted passwords, secret questions and answers, medical records, and other login credentials
- Low sensitivity: email addresses, usernames, addresses, and phone numbers
Companies that reported breaches of highly sensitive info saw share prices outperform the market by +1.0%, compared to -3.8% for medium sensitivity breaches, and -7.93% for low sensitivity breaches.
Time of breach
We placed each company into one of three groups based on when the breach disclosure occurred. Companies that disclosed breaches prior to 2015 saw the largest negative impact, with share prices falling -13.4% versus the NASDAQ in the six months following disclosure.
Breach disclosures from 2015 through 2019 didn’t have much of a negative impact on average (+4.92% vs NASDAQ). This could be due to breach fatigue at the time.
Companies that disclosed breaches in 2020 or later saw prices underperform the market by -6.6%. The about-face from previous years could be explained by the rise of ransomware. Ransomware attacks often involve data theft as well as making target systems unusable, which disrupts operations.
Note: Prior to 2018, not all US states had disclosure laws that required them to publicly report data breaches.
Methodology
We examined the closing stock prices of 118 companies that met the following criteria:
- The company was publicly listed on the NYSE or NASDAQ at time of breach disclosure
- The company publicly acknowledged a data breach
- The breach was disclosed at least 6 months prior to our analysis (May 2024)
The breaches we analyzed took place from 2007 to 2023. Historical stock data was downloaded May 2024.
For each stock, we pull closing share prices for the six months prior to reporting the incident, and the six months after.
First, we examine whether the share price went up or down. However, this method fails to account for market forces beyond the scope of the study.
To account for broader market trends, we compared the performance of each stock with the NASDAQ for the same time period, and calculate the difference in performance between them. The NASDAQ is a common standard for overall market performance, and most of these stocks are listed on it. We used a NASDAQ composite index as a benchmark for the wider market. Here’s the formula:
(((Company prices on day X after breach)/(Company price on day prior to breach)-1)*100) - (((NASDAQ prices on day X after breach)/(NASDAQ on the day prior to breach)-1)*100)
Essentially, we anchor the NASDAQ index performance to zero. If a company’s stock fell 1% and the NASDAQ rose 2% in the month after a data breach, the calculated decrease is 3%. If the NASDAQ fell 2% and the company’s stock price rose 2%, we report an increase of 4%. If the NASDAQ rose 2% but the company only rose 1%, that’s a 1% decrease versus the market. Finally, if the company’s stock price falls 2% but the NASDAQ falls 3%, then the company still sees a relative increase of 1%.
In short, we make the NASDAQ’s performance the baseline instead of zero.
We analyzed all of the stocks together and then broke them down by different factors to see if we could spot any patterns. These factors include the year of the breach, the size of the breach, the sensitivity of the leaked info, and the industry of the company. These findings, while insightful, are less statistically significant due to the smaller sample size.
Stock exchanges are only open on business days, which means no weekends or holidays. Here’s a quick reference that roughly converts business days to total time:
- One year: 253 business days
- 9 months: 198 business days
- 6 months: 132 business days
- 3 months: 66 business days
- 1 month: 22 business days
- 1 week: 5 business days
While we use daily means to present our findings in this article, we additionally include polynomial trend lines in our visualizations to better represent the data.
Limitations
Not all companies disclose how many records are affected. These breaches were not used in our analysis of breaches according to size.
As with any financial market study, there is a huge slew of factors that could affect stock price which we cannot account for. While we’ve tried to minimize blindspots by comparing share price performance against that of the NASDAQ, there are bound to be some unexplained inconsistencies.
Two noteworthy factors that we did not cover in this analysis stand out the most. The first: payouts. If a data breach leaks particularly damaging information that ultimately incurs financial damages to a company’s customers, and the company was shown not to have adequately protected the information leaked in that breach, then customers often sue in class-action lawsuits. These usually result in settlements, in which the company forks out millions of dollars to reimburse customers for damages. This does not always happen and the amount paid out varies, so we simply don’t have enough data to fit a practical model that shows how these settlements affect stock prices.
The second is financial reports. This would perhaps warrant an entirely separate study. We analyzed the share price starting with the day prior to when a data breach was publicly disclosed. While a company might divulge what information was leaked and how many records were affected in that initial disclosure, other consequences might not be revealed until the company releases its requisite quarterly shareholder report. This could include loss of sales or users, diverting funds to invest in data security and pay for remediation, or other important information related to the breach that could cause investors to jump ship.
Study updates
The 2024 version of this study increased the number of breaches to 118. Some groupings were adjusted accordingly.
The 2018 and 2019 versions of this study are revisions of a similar study that we conducted in 2017. The 2018 modifications include:
- Added two new companies: Under Armour (UAA) and Equifax (EFX)
- Removed three companies that are not listed on the NYSE to get a more uniform data set: Betfair, Countrywide, and VTech
- If a company suffered two data breaches that meet the criteria, we analyzed both instead of just the latest one (SNE, HNT, TMUS)
- Shifted focus to 6 months instead of 1-3 years. The effect of data breaches on share price diminishes over time, so we chose to look at a shorter period of time when changes in share price are more directly attributable to data breaches.
- Included 6 months prior to breach to compare share price fluctuations before and after breach and add context.
- Shifted focus more on the NASDAQ performance comparison and less on share price fluctuation
- Improved visualizations with interactive features.
In the 2018 study, we noted a slower decline in performance over time than in 2017. This is most likely to do with the introduction of new companies and breaches in the data set.
The 2019 changes include:
- Five more breaches from four companies: Facebook ($FB), First American Financial ($FAF), Capital One ($COF), and Marriott International ($MAR)
- Shifted the categories for “time of breach” comparison over by one year
And in 2021:
- Seven more breaches added: Quest Diagnostics ($DGX), LabCorp ($LH), Zynga (ZNGA), Microsoft (MSFT), MGM Resorts (MGM), and Walgreens (WBA), and a second breach from Marriott ($MAR)
- Shifted the categories for “time of breach” comparison over by one year