
A remote server monitoring cloud-based system, Site24x7 is “software as a service.” That means it includes the host server and the necessary storage space for log files. This delivery model offers great cost advantages for all sizes of companies because the customer doesn’t have to pay for the software upfront.
Instead, the service is charged for by subscription, which is a little like paying for the system on an installment plan. The format cuts costs and reduces the time it takes to get monitoring up and running.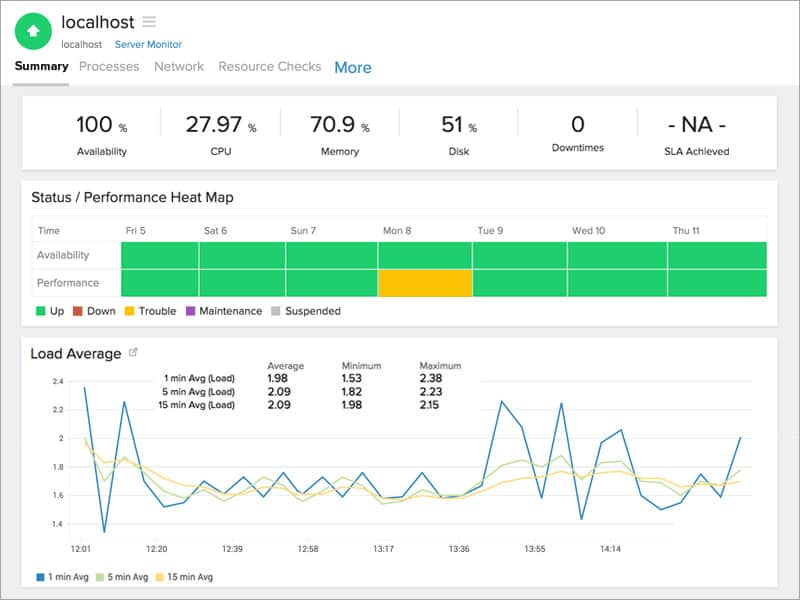
Site24x7 Server Monitoring not only monitors servers, it can also monitor the entire IT infrastructure on a network including the applications, logs, virtual systems, and network devices.
Key Features:
- Autodiscovery: Automatically identifies applications running on monitored servers, simplifying setup and maintenance.
- Server statuses: Monitors over 50 status conditions, ensuring comprehensive coverage of server health.
- Application tracking: Tracks the performance of common applications such as web and email servers.
- Alerts: Customizable notifications with AI-based assessments to prioritize and manage alerts effectively.
- Automation: Capabilities to auto-resolve performance issues, reducing manual intervention.
Here is an overview of what Site24x7 Server Monitoring includes:
| Feature | Description |
|---|---|
| Autodiscovery | Logs applications running on the monitored server |
| Server statuses | Constant checks on more than 50 status conditions |
| Application tracking | Monitors common applications, such as web and email servers |
| Alerts | Customizable threshold trip prioritized notifications with AI-based assessments |
| Automation | Auto-resolve performance issues |
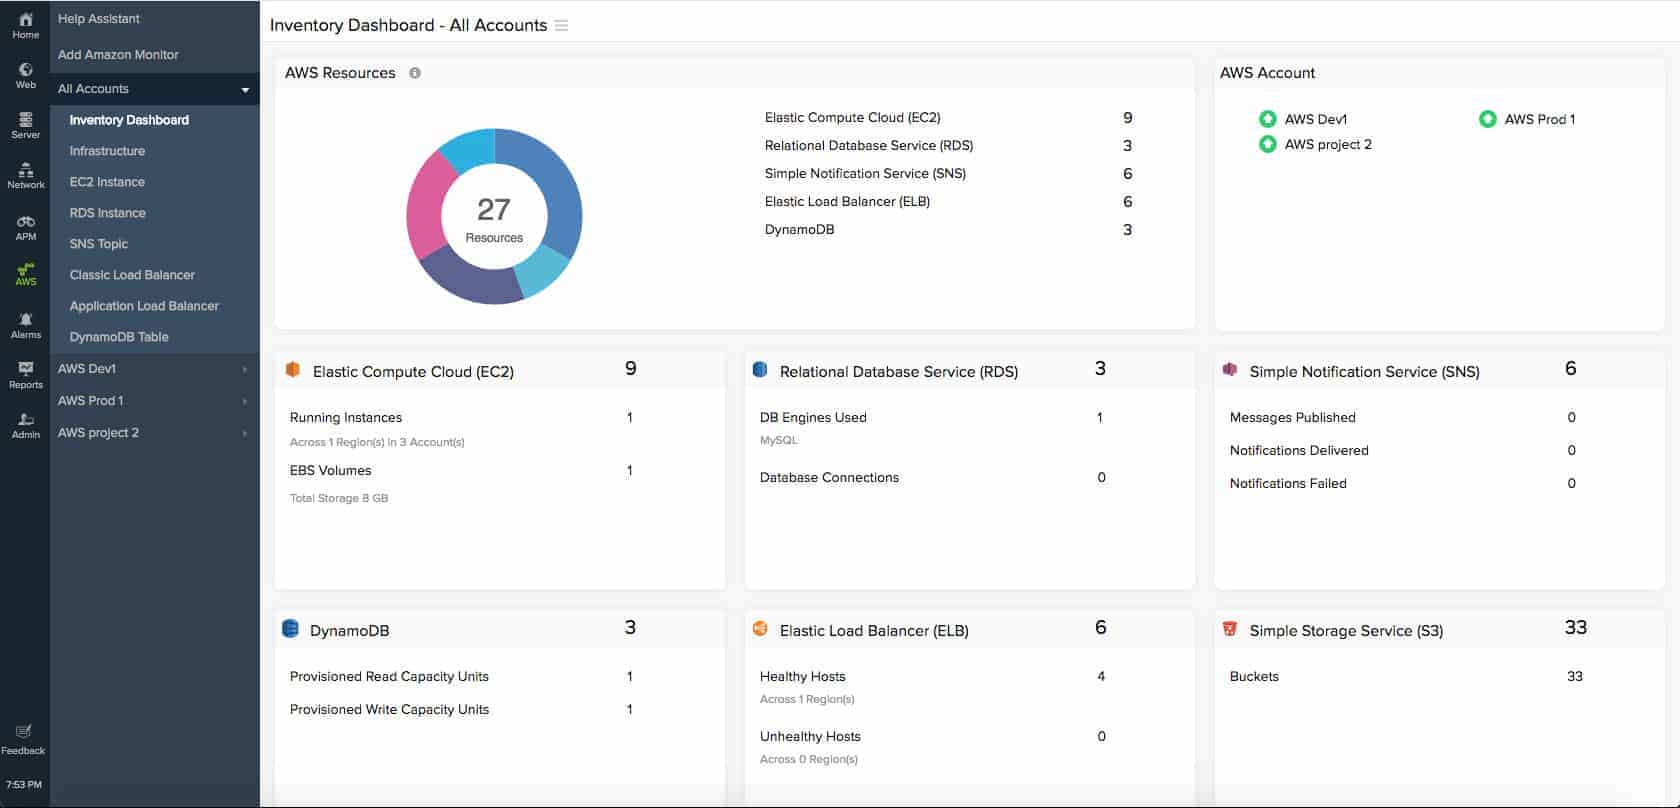
| Cloud monitoring | AWS EC2, EBS, ELB, RDS, DynamoDB, S3, ElastiCache, CloudFront, SNS, and SQS. More than 100 Azure services and Google Cloud Platform |
| Virtualization monitoring | VMWare, Hyper-V, and Docker |
| Reports | Including Root Cause Analysis |
If you would like to follow along with the setup and steps below, you can access a fully working 30-day free trial.
Setup
Although Site24x7 runs via remote servers in the cloud and is not run locally, in order to get data from the servers on a site, it needs an agent program installed on each of those servers. That said, the process is a no-fuss one-step installation. The Standard package allows up to ten servers to be monitored.
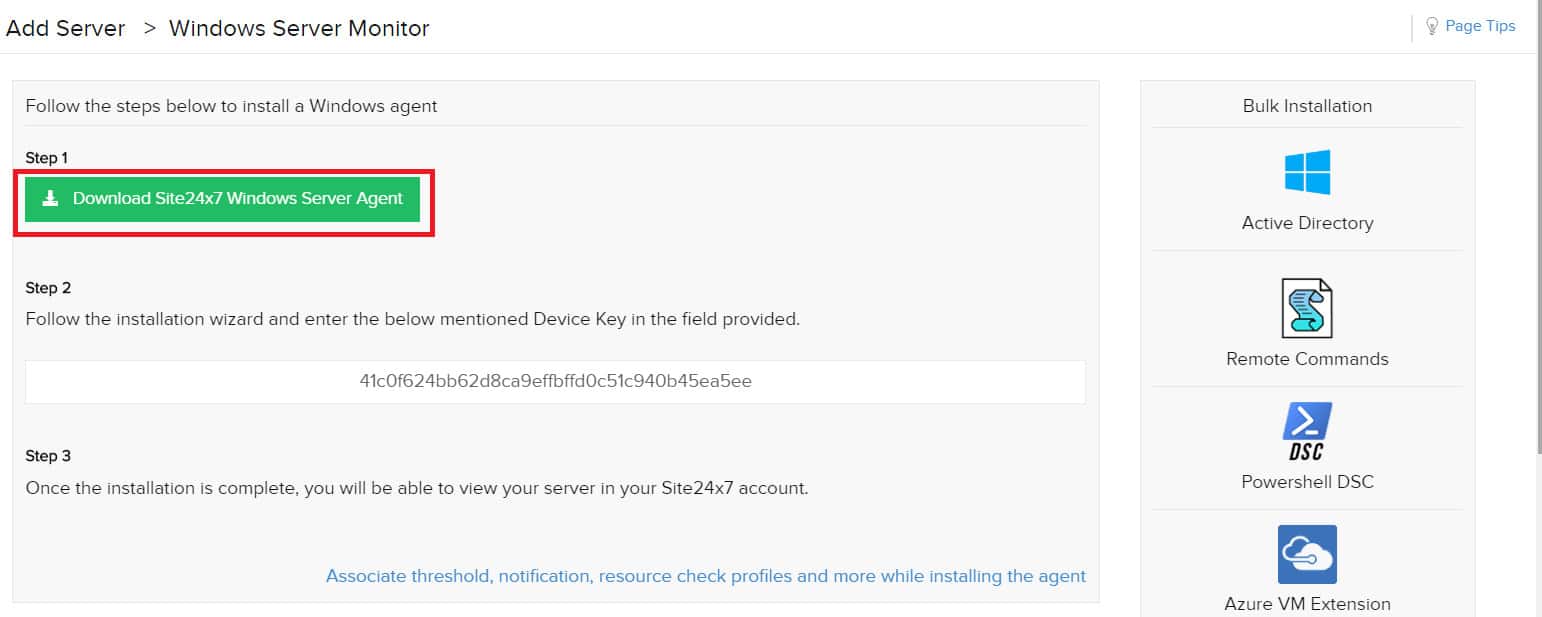
There are agent programs available for Windows, Windows Server, Linux (Debian, Ubuntu, CentOS, RedHat, Mandriva, Fedora, SuSE, Amazon Linux, Gentoo, CoreOS, Raspberry Pi, ARM Processor, and RancherOS), FreeBSD, and Mac OS X. There is also an agent that tracks Docker activity.
The agent installation process is driven by a download file, which is available within the server monitoring screen of Site24x7. The download command is available from the Admin/Inventory menu on the screen.
The downloaded file is an installer, which will set up the agent automatically. There are also alternative procedures for the bulk installation of agents on several servers simultaneously – such as Chef, Puppet, SaltStack for Linux and Active Directory, PowerShell DSC, and Custom Scripts for Windows.
Autodiscovery
The agent starts its service by searching through its host for well-known applications. This initial documentation phase brings application monitoring into action.
The applications that the service monitors include email servers, such as Microsoft Exchange, web servers, such as IIS, and database management systems, including SQL Server.
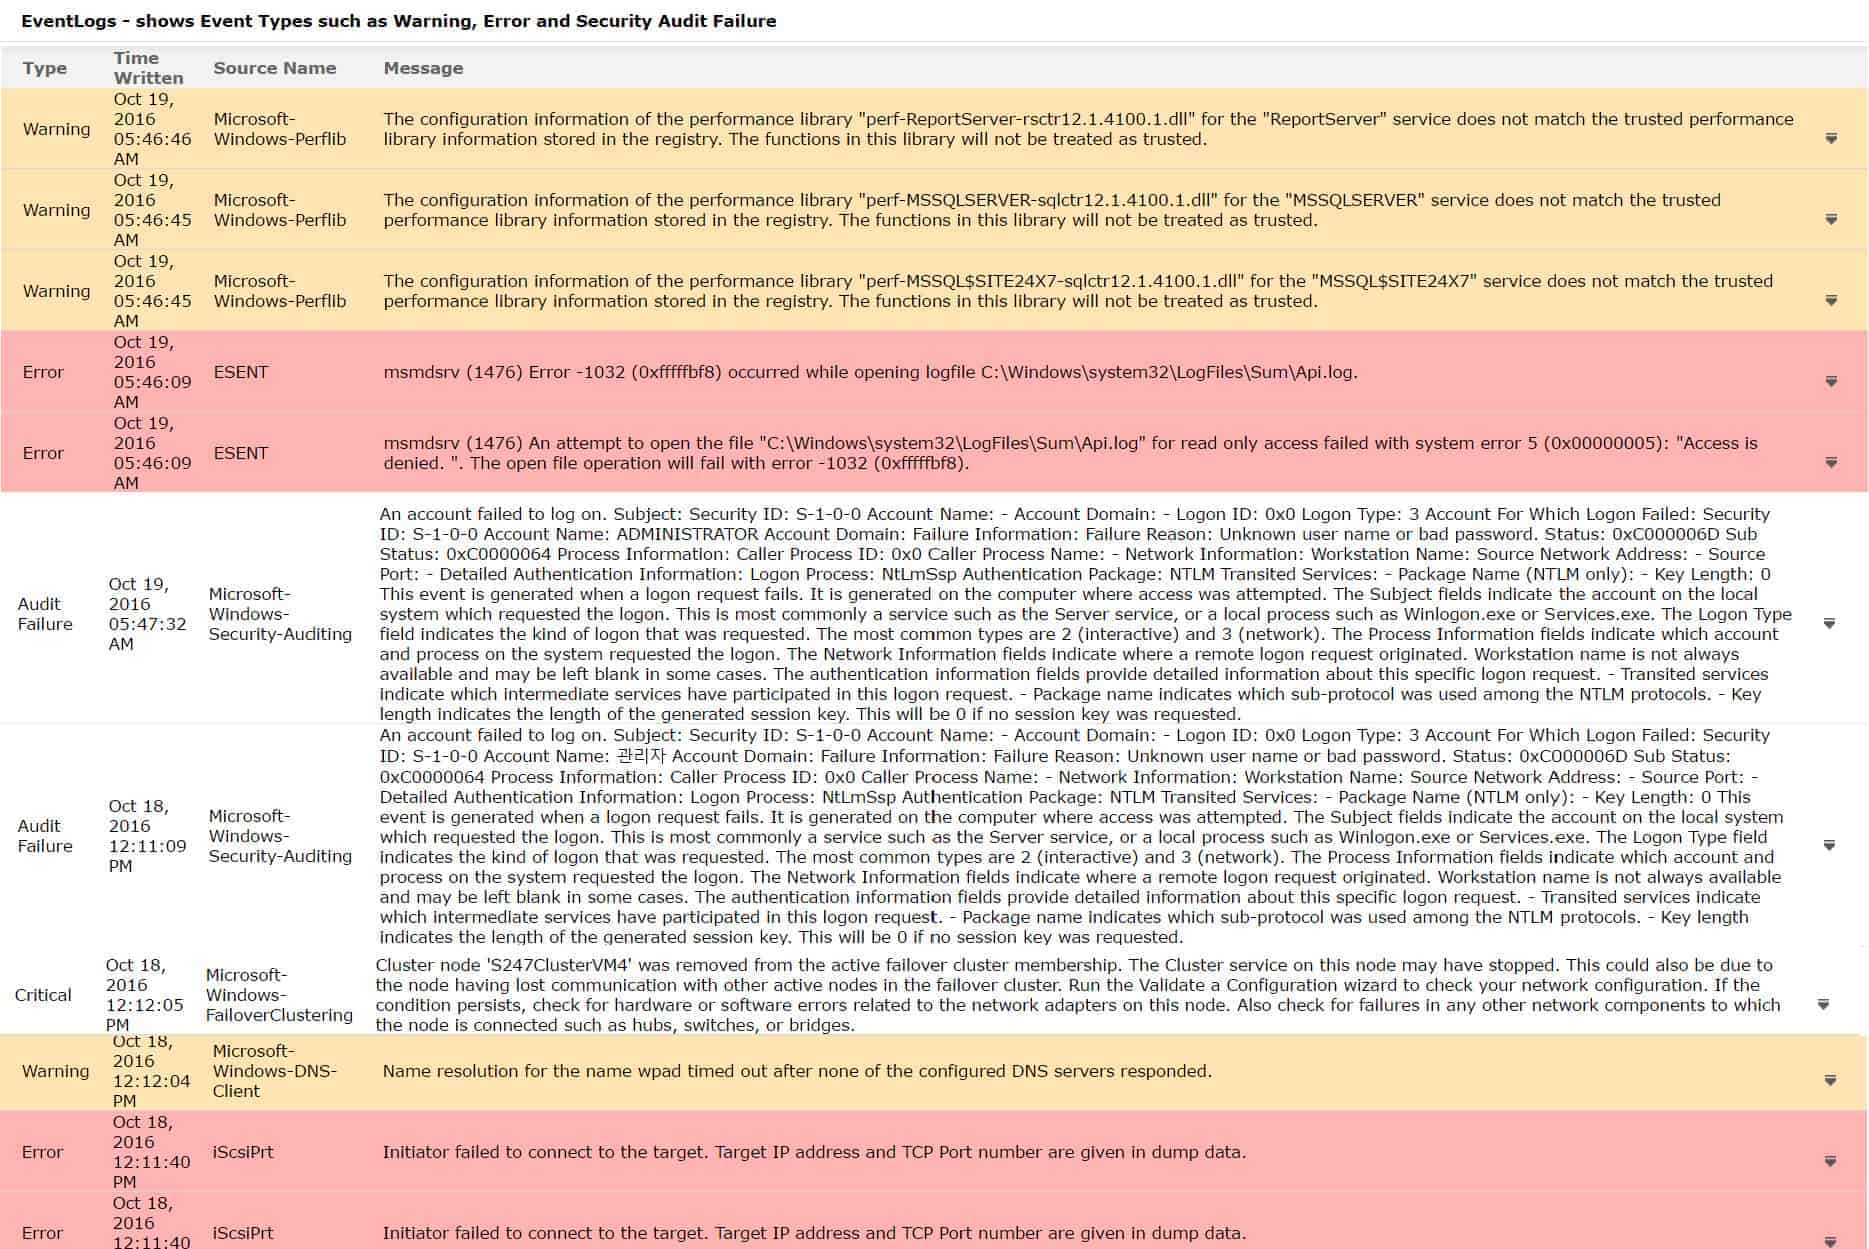
The monitor will integrate with access rights management services, such as Active Directory and it will keep an eye on log message systems, including Syslog and Windows Events. The autodiscovery function initializes all of these application monitoring tasks.
Dashboard
The dashboard for Site24x7 is accessible through any browser. All of the software for the service is hosted on the cloud – apart from the server agents.
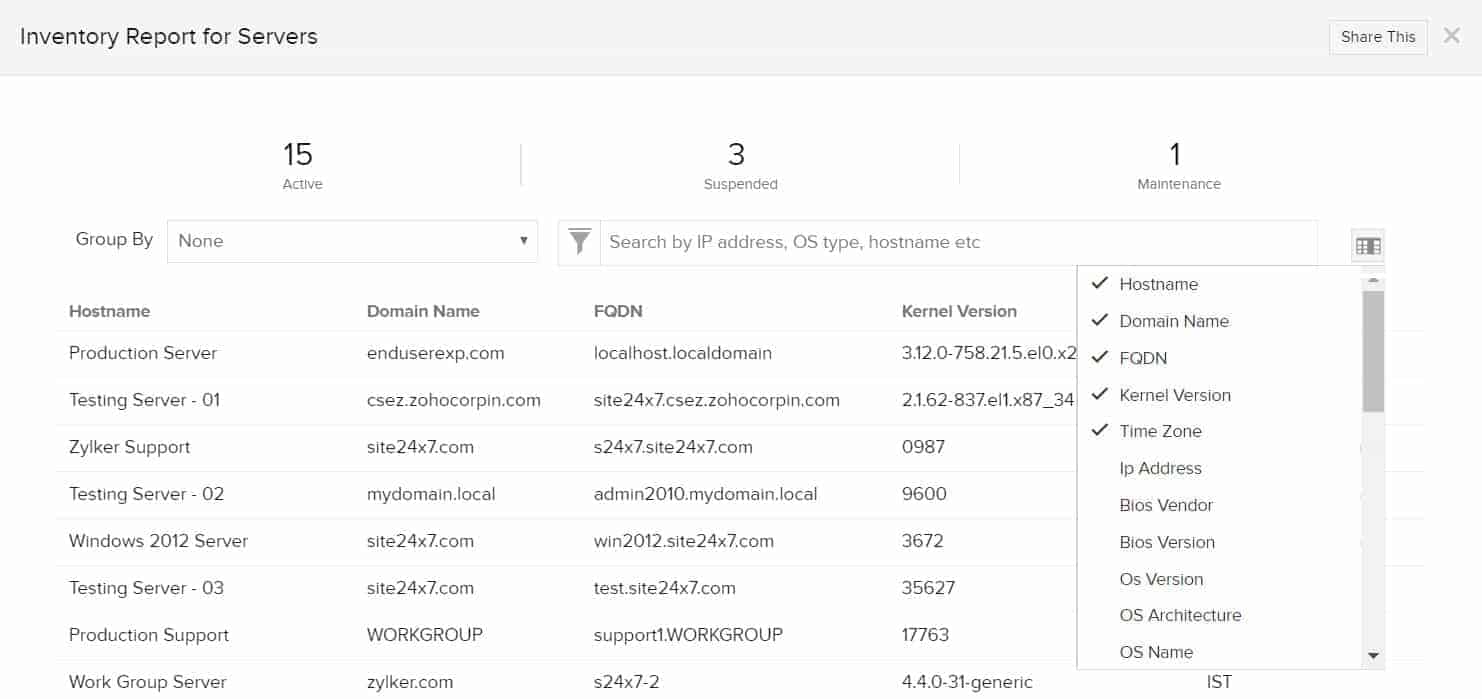
The dashboard includes several screens for server monitoring. The first port of call is the Server Inventory screen. This lists all of the servers that you have included in Site24x7 monitoring service. The “server” list includes physical servers and also applications that are known as servers, such as “email servers” and “web servers.”
The layout of the server monitoring screens allows for drill-down research with records in one screen forming links to detail screens. Graphical information is available in the Server Performance monitor.
The layout of the performance monitor can be customized. There are more than 50 different conditions that can be monitored with Site24x7 and it would be impossible to view all of these on one screen in any meaningful format. This is why the ability to create your own screens is very important.
The adaptability of the server dashboard screens is particularly important for information sharing. It is possible to create information views for non-technical stakeholders. Another adaption included with Site24x7 dashboard is white labeling. This is particularly critical for managed service providers (MSPs). The logos and branding on the dashboard can be altered to mask the source of the service, making Site24x7 look like the in-house production of the MSP. With this alteration, MSPs can confidently allow client stakeholders to get access to views of the dashboard.
Server Monitoring Features
With so many metrics being constantly scanned, it is important to focus on the essential information available in the server monitoring system. The overview on the Server Inventory dashboard includes:
- Domains – Servers listed based on domains. This overview includes a drill down to get details listing the servers on each domain
- Dependency Resources – The total number of services, processes, applications, plugins, resource checks monitored by the account
- Inventory Details – Servers listed by status, showing those that are active, suspended, and under maintenance. A drill-down feature shows the statuses of applications running on a selected server
- The Server Inventory Dashboard doesn’t include the eye-catching visualizations that are available in the Server Performance screens.
The customizable Server Health and Server Performance screens include most of the data options on server statuses. Here are the more critical conditions that can be found on the Server Health screen:
- A pie chart showing the count and status (Up, Trouble, Critical, Down, Maintenance, Suspended) of servers by the operating system
- Top Servers by CPU as a histogram
- Top Servers by Memory as a histogram
- Top Servers by Disk as a histogram
- Top Network Adapters by packets sent, received, or in error as a histogram
These metrics can be filtered by domain. The Server Health screen also shows a list of applications running on all servers (or all servers per selected domain) and their statuses: Up, Down, or Trouble.
Another section in the Server Health screen shows a list of plugins that have been added to the account.
The Server Performance screen is the most visually appealing section of the dashboard. This can be customized, but its main data portrayal method lies in visual representations.
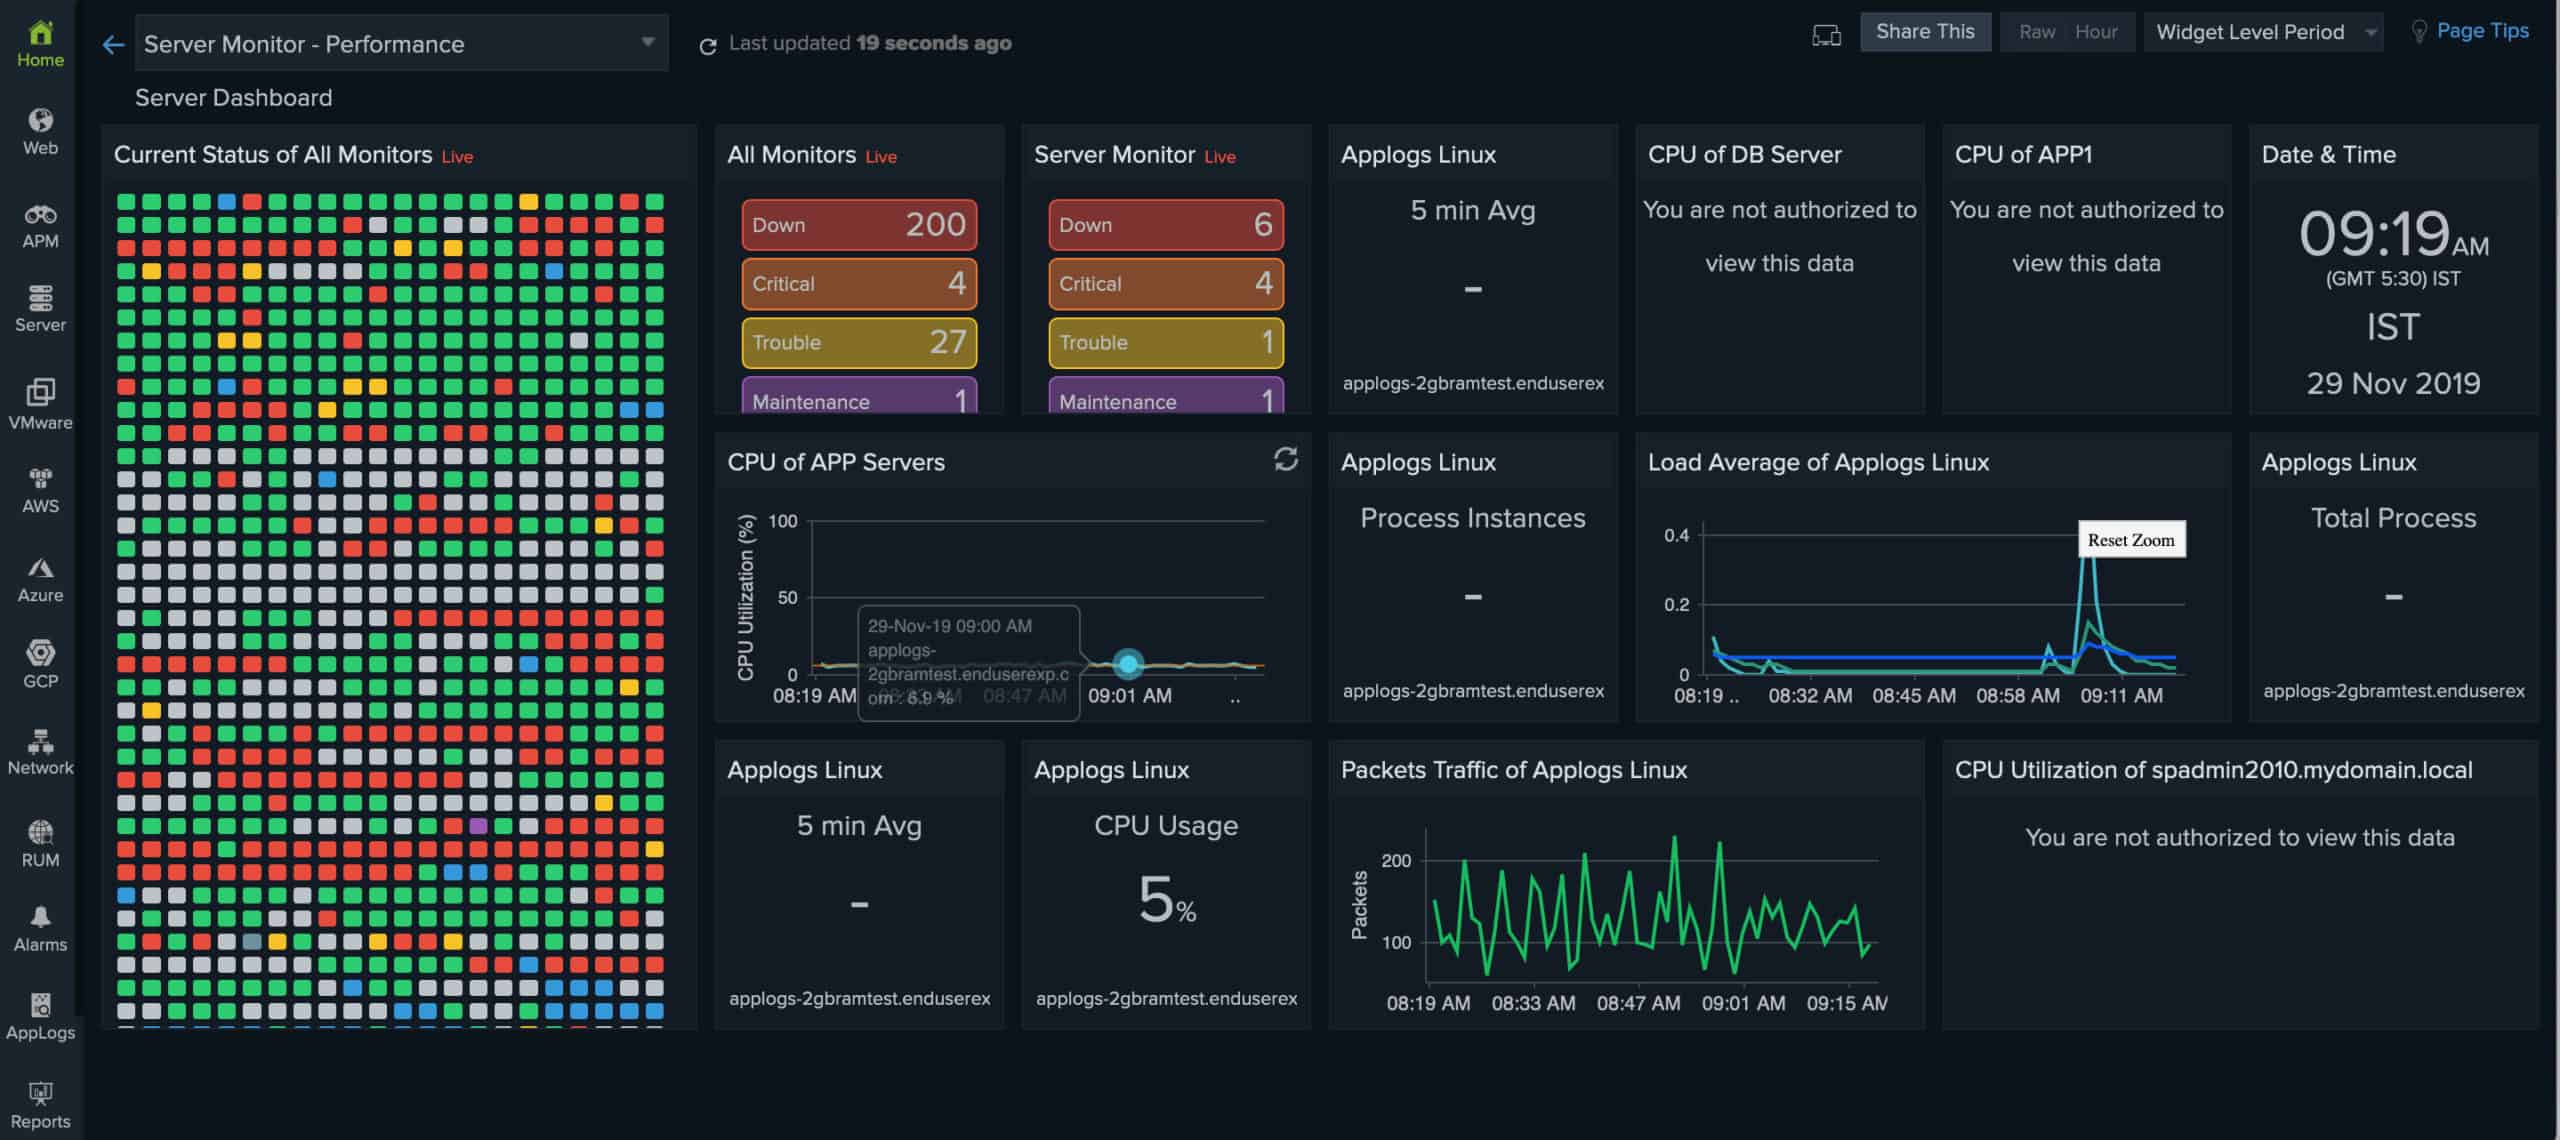
The metrics available in this screen include:
- CPU utilization – As a summary or detail, which shows system idle percentage, interrupts and context switches, and CPU Utilization per Core
- Memory utilization – As a summary graph or a detailed view with swap memory utilization, total memory used, number of memory pages (In/Out/Fault)
- Memory breakup — Free physical and swap memory
- Processor queue length – Shown as a chart over time
- Disk idle and busy percentage – On a time-based chart
- Disk usage with a capacity plan – Expressed as a dial
- Disk usage forecasting – Estimate what your disk usage will be after seven days, based on your current disk usage.
- Recent events – A color-coded chart counting information, warning, and error notification counts
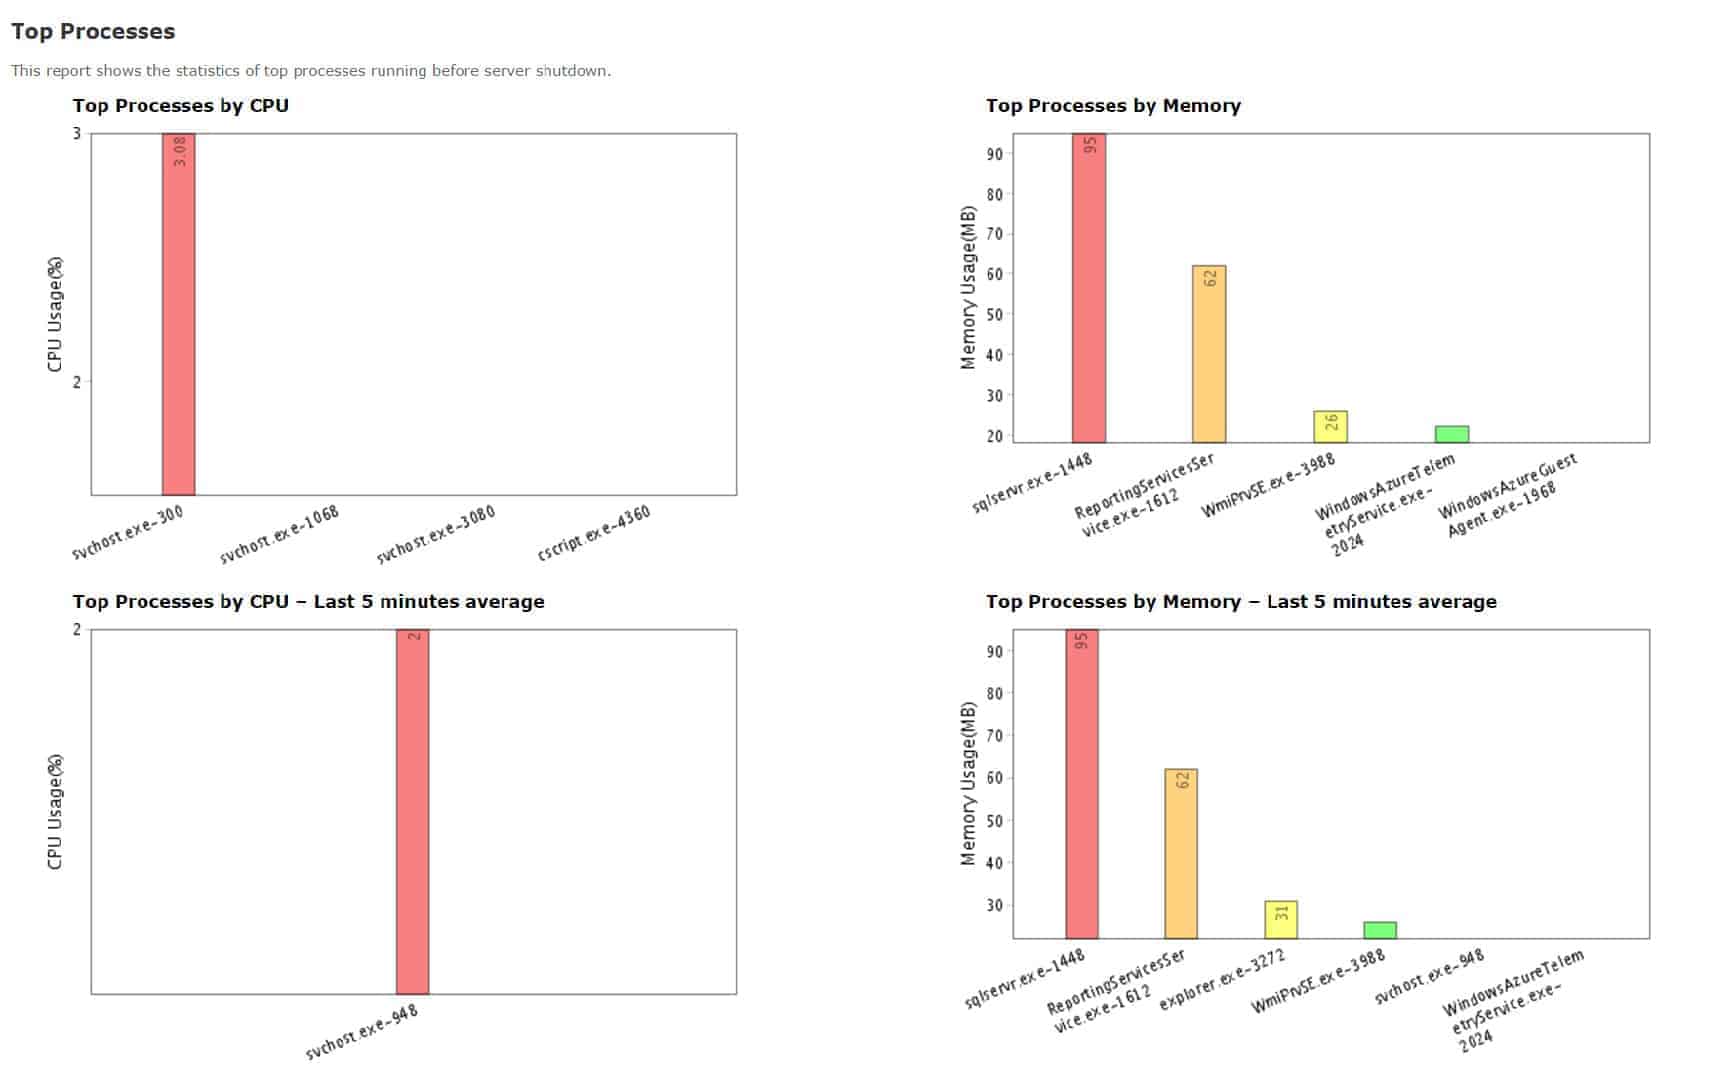
- Top process by CPU and memory – The display toggles between CPU and memory
- Application details – Lists running applications as a link to the details page for each application
- Down/trouble history – A problem history
- Services and processes – Can be customized to list only services of concern and the processes that they start
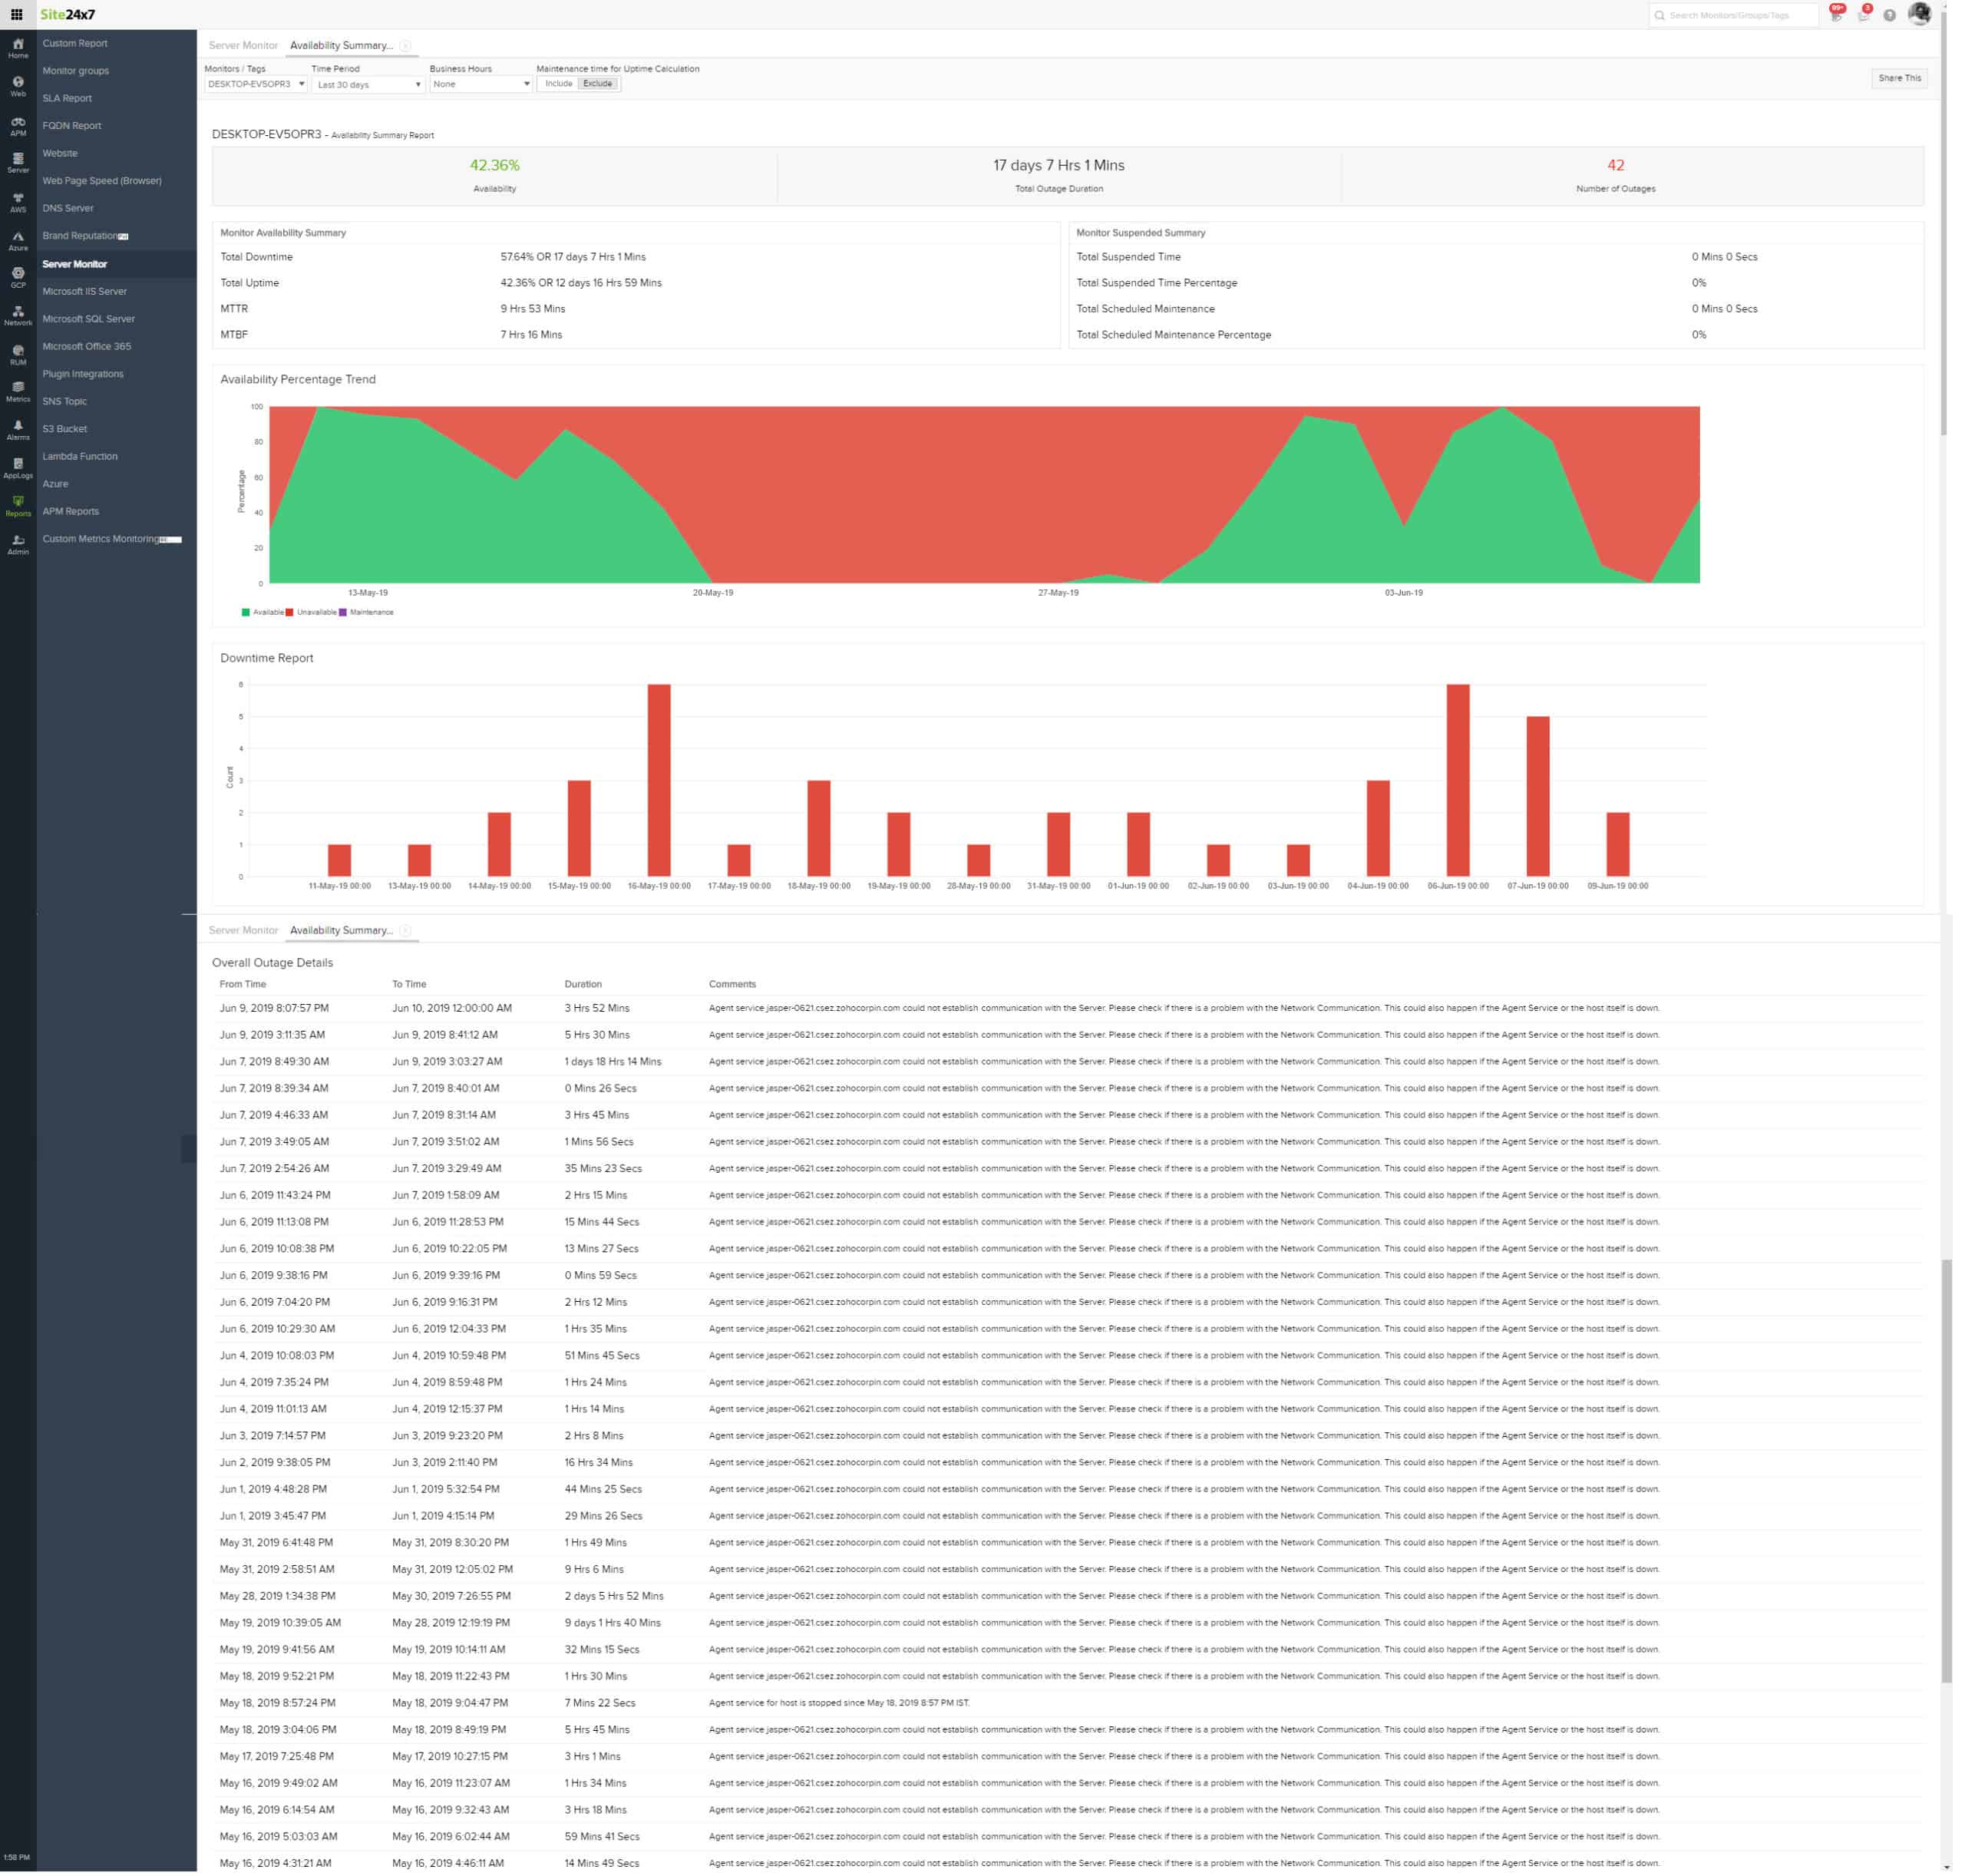
Root Cause Analysis
The downtime and trouble list in the server performance screen acts as an index to a library of Root Cause Analysis Reports (RCA). Every downtime event is logged with an RCA that lists the conditions of the server at the time of the outage and the reason for the suspension. This is tied to an alert that can be sent to the monitor’s key user automatically. The report will also be available for view within the dashboard.
RCAs are not deleted from Site24x7, so they are available in perpetuity.
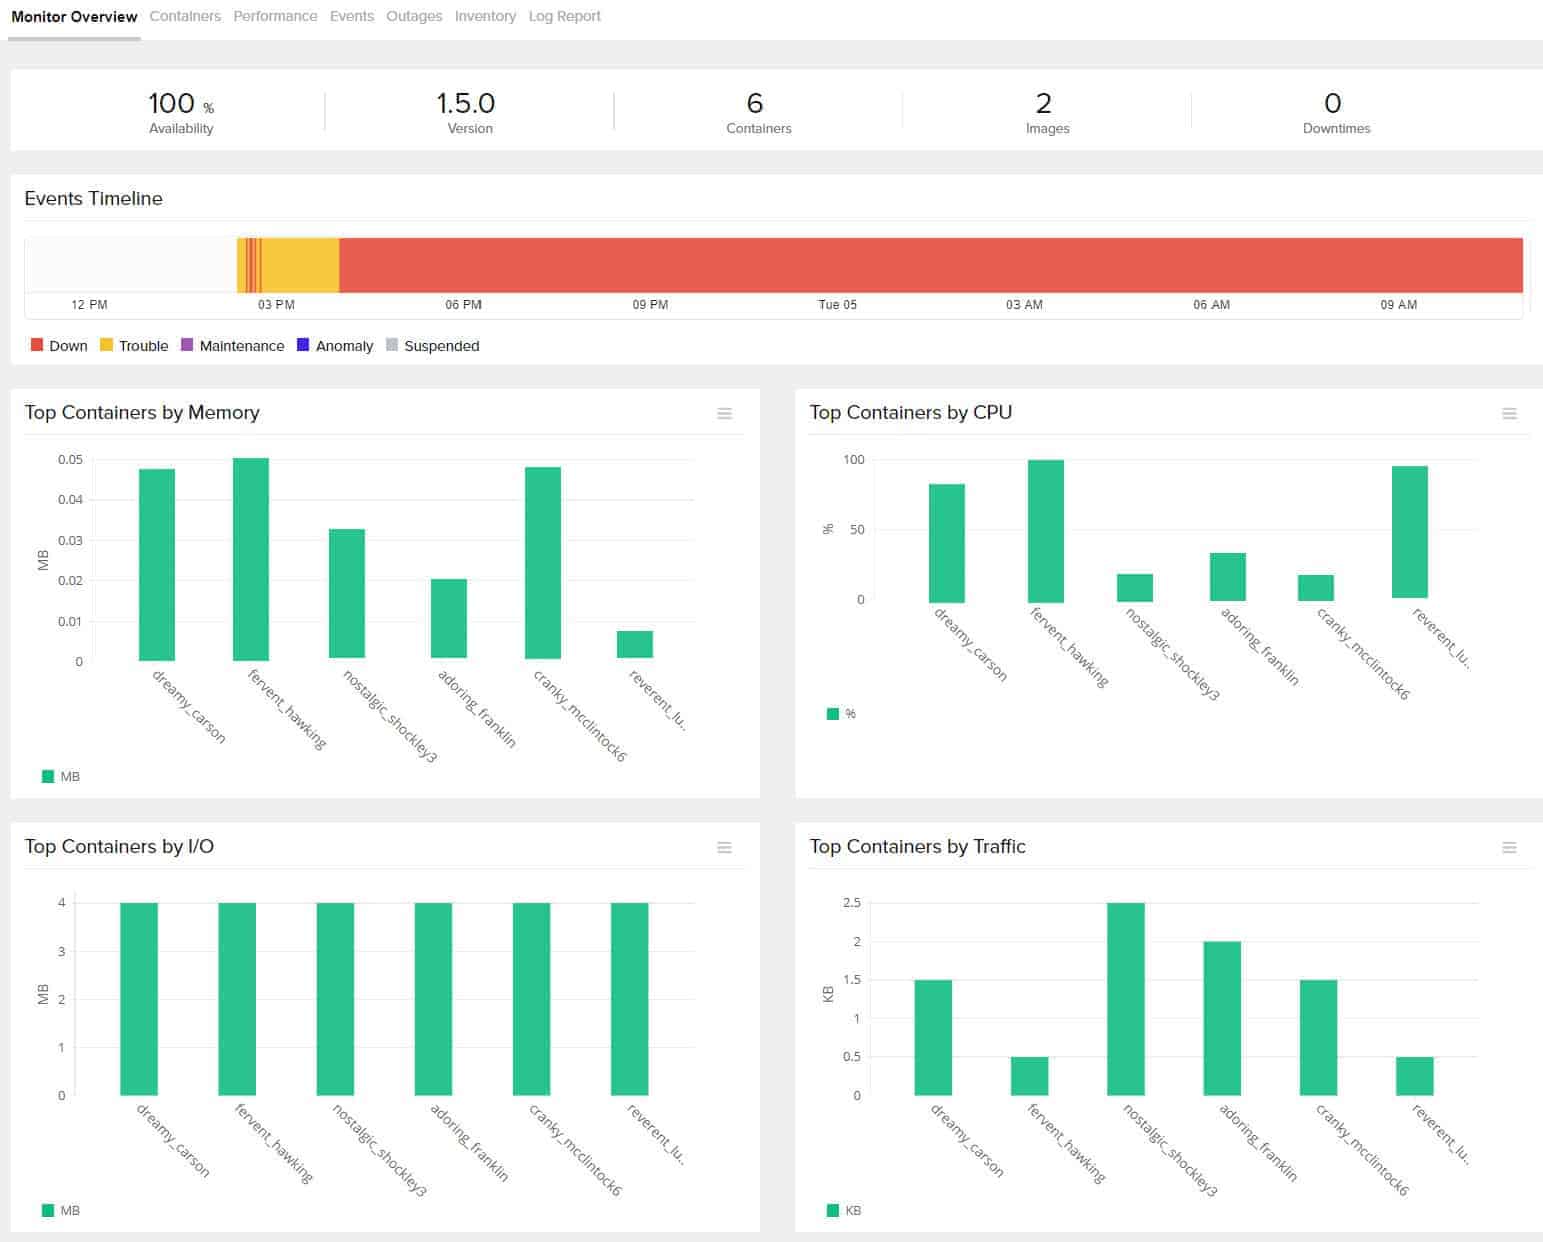
Virtualization monitoring
Site24x7 has specialized processes for monitoring the following virtualization systems:
- VMware ESX/ESXi
- VMware vCenter
- VMware VM
- VMware Datastore
- VMware Resource Pool
- Docker Monitor
- Hyper-V Monitor
The agent scans for VM activity and maps all relationships between VMs and servers, clusters, resource pools, and data centers. The system will display this relationship in the console of Site24x7 and refresh the information every five minutes. It is also possible within Site24x7 to map all of the underlying resources that support virtualization.
Docker is a little different from traditional virtualization systems and Site24x7 has special monitoring services for tracking the performance of containers.
Cloud monitoring
Site24x7 isn’t limited to monitoring on-site servers. It is also capable of monitoring AWS, Azure, and GCP virtual private servers and services.
Amazon Web Services already has its own agent in the form of the CloudWatch API. Site24x7 communicates through CloudWatch to gather metrics on the performance of the VPS and other subscription services on AWS. The Site24x7 system needs to be configured to gain access to your AWS account in order to begin monitoring. It’s able to issue commands to AWS services in order to automate problem remediation in a similar workflow strategy that deployed for on-site servers.
The setup for Azure monitoring is similar in that you don’t need to install an agent on the server but you do need to grant Site24x7 access to your Azure account. The dashboard of Site24x7 includes three screens for Azure monitoring, which are: Infrastructure, Inventory, and Health.
The Google Cloud Platform is also accessible to Site24x7. Again, the commencement of this service requires the administrator to set up the connection through Site24x7’s console rather than by installing an agent on the Google Cloud server.
With all cloud monitoring options, the system will implement an autodiscovery process to log all of the services that you have active on your cloud server and monitor those constantly as well as the server performance metrics.
Alerts
Although the account administrator can reduce the display of monitored factors to make information more digestible, all monitors are still active. Even when a specific metric is not shown, that data is still gathered by Site24x7’s agent and any warnings on performance in those categories will become notifications.
Site24x7’s monitoring system will automatically detect when problems arise and send out an “alert” to draw the operator’s attention to the situation. Alerts are also shown on a special screen on the dashboard.
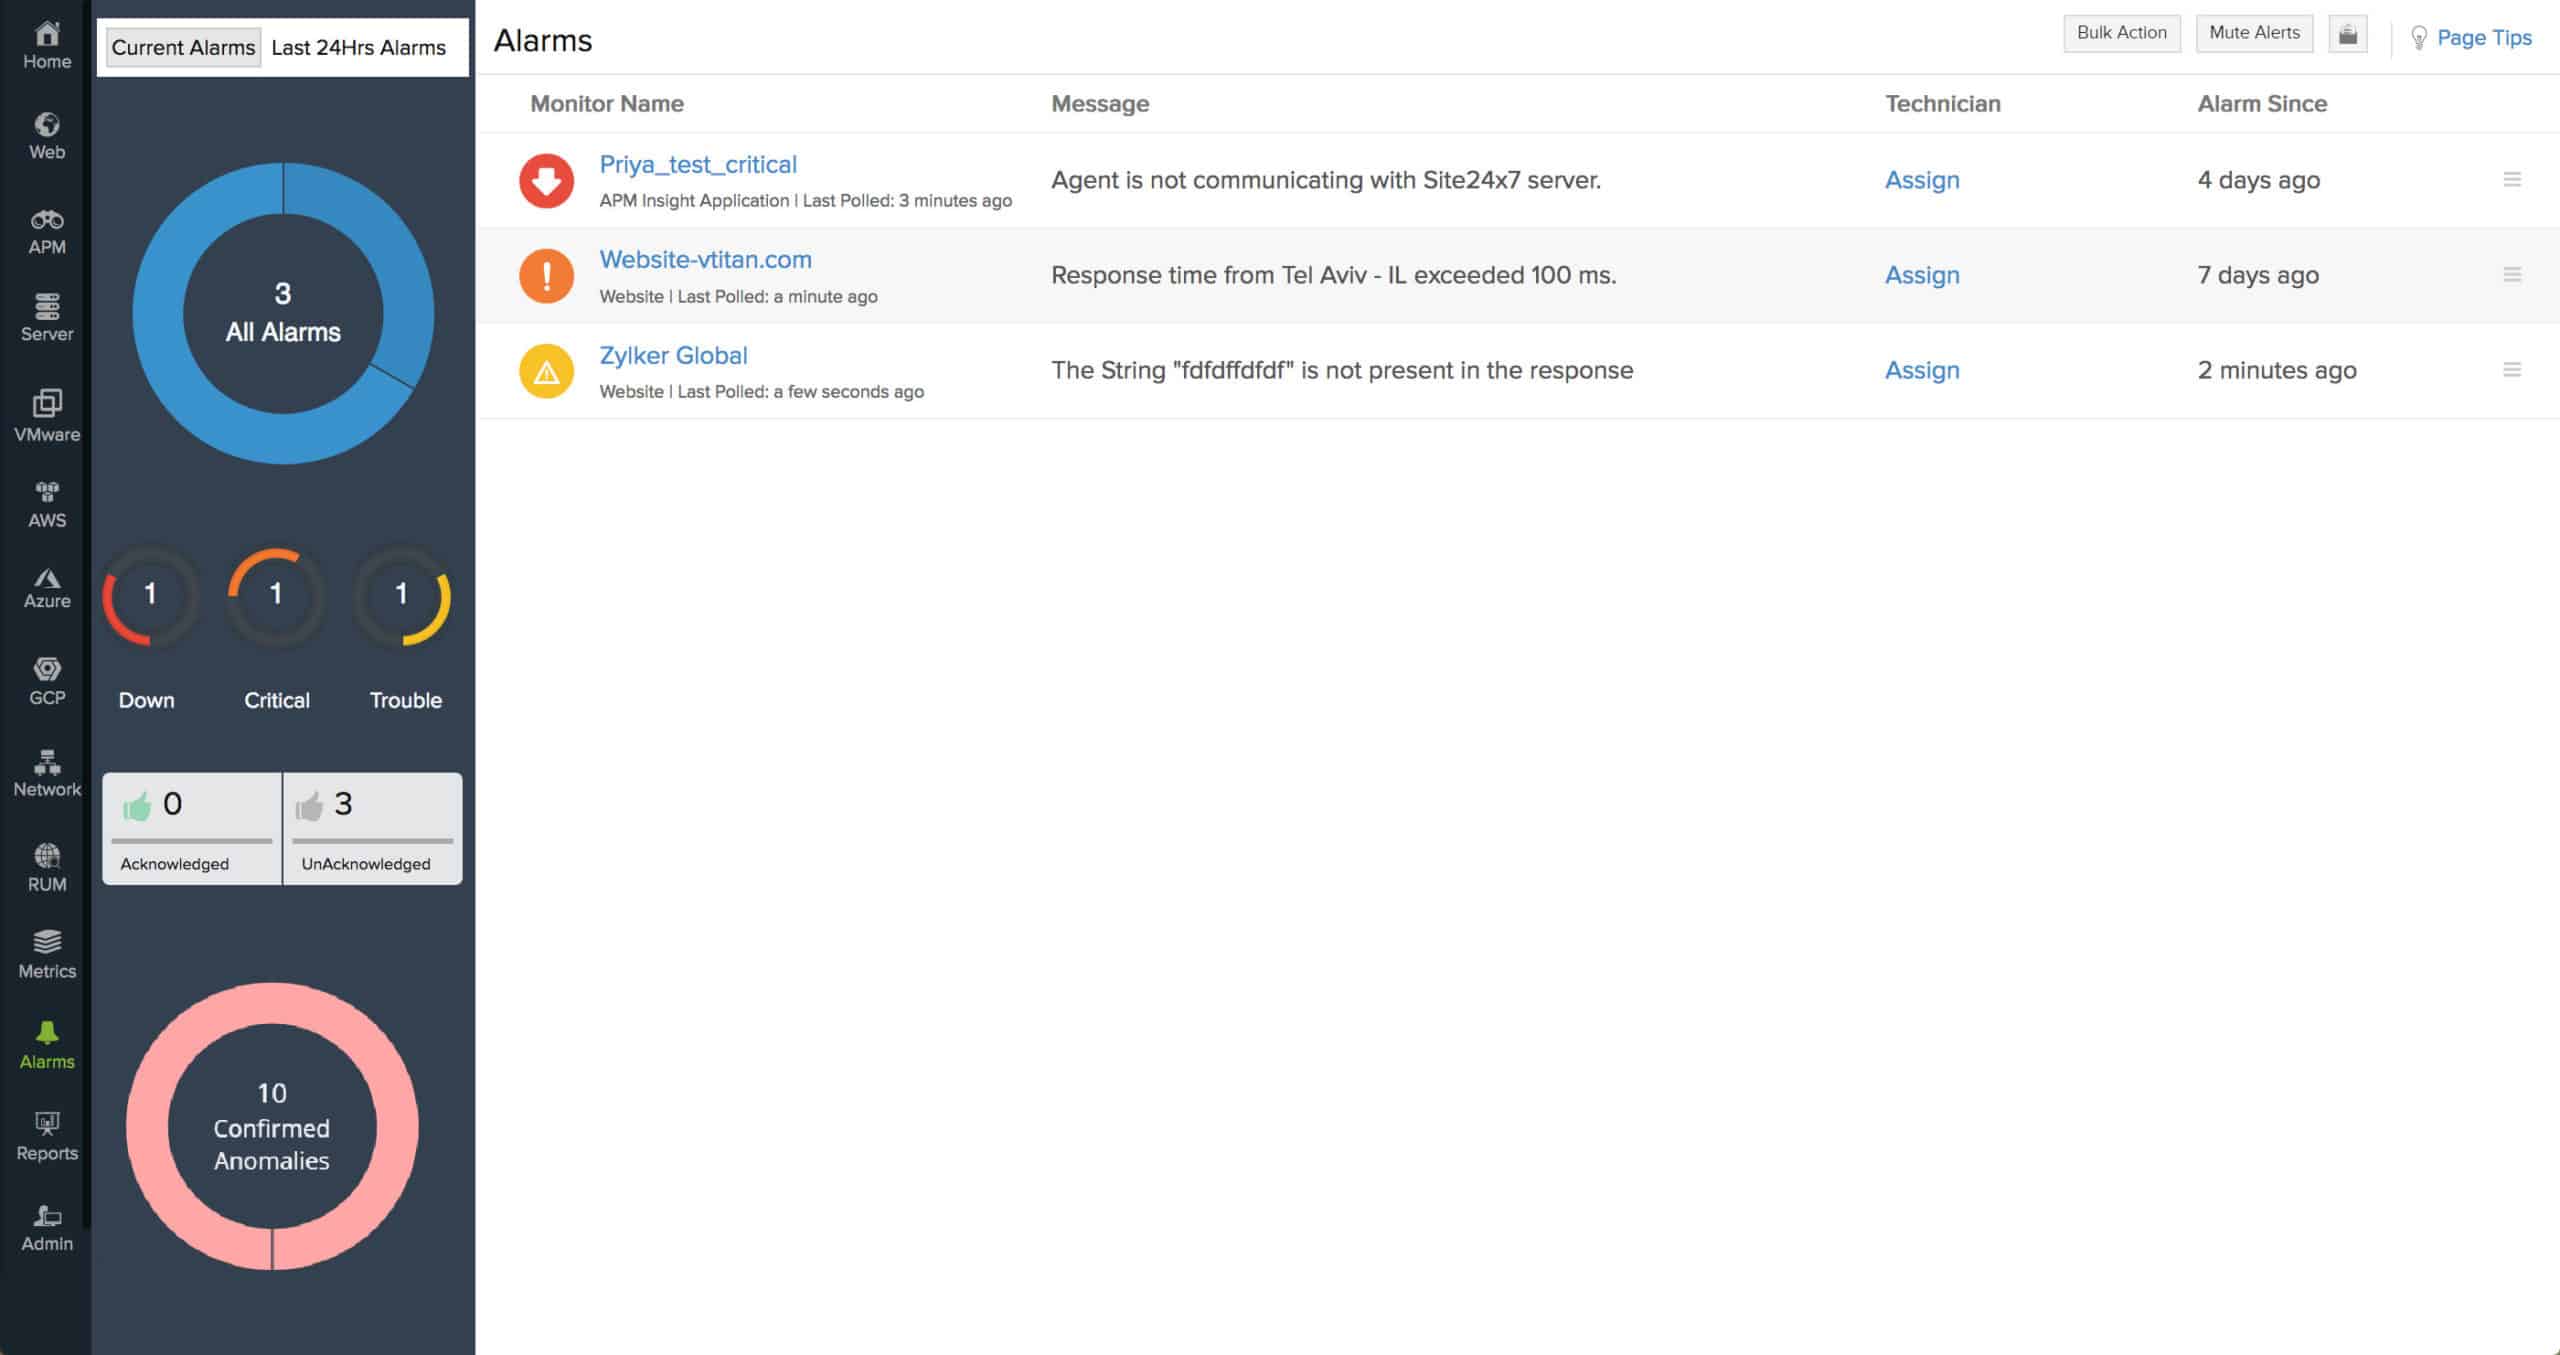
An alert is a warning, which can be advisory or an urgent matter. Site24x7 deploys AI-processes to adjust alert threshold levels. This reduces the unnecessary distraction of over-frequent alerting. Through machine learning, Site24x7 is able to adjust the conditions under which it issues warnings and alerts.
The alerts can be sent as emails to a nominated account. Thus, operators don’t have to sit and watch Site24x7’s server monitoring screens. Technicians can assume that everything is working okay unless they are otherwise notified.
The alerts system is a great time saver and allows managing technicians to get on with other more important tasks, such as supporting users or planning system enhancements. It is possible to adjust the preset alert thresholds and also create custom alerts, which can be composed of a combination of thresholds set on different performance factors.
Alerts can also be set up to work with third-party integrations like Zapier, Slack, PagerDuty, and ME SDP on-demand.
Reports
The dashboard of Site24x7 has a section that produces reports. There are pre-written report formats for all of the infrastructure monitoring activities of the tool and this includes specialist server monitoring reports. These include:
- Server disk partition report
- Server network adapter report
- Agent inventory report
- Services and processes report
- Top N Reports – by CPU, memory, and disk
It is also possible to design customized reports.
Plugins
A plugin is a pre-written combination of monitor agent, alert thresholds, data display widget, and report format. There are more than 50 plugins available in Site24x7 and each aids the integration of data collected from other monitoring applications, such as Nagios, or focuses on the specific monitoring requirements of a well-known application, such as the MySQL database management system.
Plugins can organize data already gathered by different infrastructure monitors in Site24x7 and unify the presentation of that data. This, for example, can create instant recognition screens detailing the performance of the entire stack from network up to the application. It is also possible to write your own plugin or source them from other users through the community forum.
Fault resolution automation
The agents installed on a server are able to channel commands from Site24x7’s system as well as sending data to them. This enables the IT automation module of Site24x7’s service to send action instructions to the server in order to correct problems detected by the agent.
This service is an option. The administrator needs to activate a workflow connected to an alert condition. When the alert threshold gets tripped the workflow implements the remediation actions without manual intervention. Thus, under certain circumstances, the network administrator will know that a problem has already been fixed as soon as the alert notification arrives.
Preventative maintenance tasks can also be set either on a schedule or in response to a threshold being breached. Examples of this are the disk cleanup procedure and log file management processes.
Security
All communications between the agent on the monitored server and Site24x7’s server are protected by encryption. Data at rest on the monitoring server is also stored in an encrypted format. Even the maintenance technicians of Site24x7 will not be able to read the information that’s held on your servers.
Access to your data is protected by credentials. All communication between your browser and the console page server in the cloud is protected by HTTPS.
Site24x7 also can boast of some highly recognized industry certifications, such as the ISO/IEC 27001:2013 certification for Applications, Systems, People, Technology, and Processes. They also qualify for AICPA’s Trust Services Principles criteria with a SOC 2 evaluation.
Pros & Cons
Pros:
- Comprehensive Coverage: Monitors not just servers but the entire IT infrastructure including applications, logs, virtual systems, and network devices.
- Flexibility and Customization: Customizable dashboards and alerts allow users to tailor the monitoring system to their specific needs.
- Cloud and Virtualization Support: Strong support for cloud services and virtualization platforms enhances monitoring capabilities across diverse IT environments.
- AI-Driven Alerts: AI-based alert management helps reduce noise and prioritizes critical issues, making alert management more efficient.
- Automation: Automated problem resolution can save time and reduce the need for manual intervention.
- Secure: Encrypted communications and data storage ensure that monitored data is secure.
Cons:
- Learning Curve: The breadth of features and customization options might require a significant time investment to fully understand and utilize effectively.
Site24x7 options
Site24x7 is available in a variety of flavors. It is available as an application performance monitor (APM), as a website monitor, and as an infrastructure monitor. These all include server monitoring. There is also a version of the monitoring system that is tailored to MSPs.
Site24x7 is available as a free version, which will monitor up to five servers. The cheapest paid plan that includes server monitoring is called the Starter plan. This is available on a 30-day free trial. This plan is charged at a very low monthly subscription rate and works out a lot cheaper than buying server monitoring software. The Starter plan also includes network monitoring functions, so you will be able to supervise your entire IT infrastructure with this plan.
The pricing system of Site24x7 includes a lot of add-ons, which can end up getting complicated. The base Starter plan includes monitoring for up to 10 servers, but you can add on more. It is also possible to extend the network monitoring capabilities of your account. Log management is included with the Starter plan, but it only includes 500 MB of storage space, so you might need to add-on more space for those files as time passes.
Site24x7 is a very comprehensive monitoring system for websites, servers, applications, and the entire IT stack – at a very low price! Not only is this system favored at the enterprise level, it is equally ideal for startups and budget-conscious SMEs that have tight budgets for software purchases. Larger companies will also benefit from the time-saving automation in the plan and MSPs will be attracted by the dashboard’s white labeling options.

