

The widespread adoption and critical role of SQL Server in modern IT environments have made SQL Server monitoring tools an essential part of any long-term network maintenance strategy. As SQL Server is often at the core of business applications and databases, ensuring its continuous health and performance is vital for the smooth operation of an organization’s infrastructure.
By utilizing dedicated server monitoring tools, administrators can continuously track the health of SQL Server instances, identifying potential performance issues before they become significant problems. These tools provide valuable insights into system metrics such as CPU usage, memory consumption, query performance, and disk activity, enabling proactive management
Database performance tuning involves optimizing queries, reallocating resources, or addressing bottlenecks. However, DBAs don’t perform those tasks without a trigger. Identifying performance concerns early helps maintain system stability and prevents minor issues from escalating into major disruptions.
Neglecting to monitor SQL Server can lead to severe consequences. In the best case, it might result in performance degradation, affecting user experience and productivity. In the worst case, it can cause complete system outages, potentially leading to costly downtime.
Server failures can disrupt business operations, result in lost revenue, and incur significant recovery costs. Therefore, regular and effective monitoring of SQL Server is not just an operational best practice but a critical component in safeguarding against both immediate and long-term risks to business continuity.
Here is our list of the best SQL Server monitoring tools:
- Paessler SQL monitoring software PRTG (FREE TRIAL) A network, server, and application monitor that examines monitor Microsoft SQL, Oracle SQL, MySQL, and PostgreSQL performance. Download a 30-day free trial.
- ManageEngine Applications Manager (FREE TRIAL) Monitors SQL Server databases and underlying server performance. Runs on Windows Server and Linux. Start a 30-day free trial.
- Site24x7 SQL Server Monitoring (FREE TRIAL) A monitor for networks, servers, and applications with SQL Server monitoring capabilities. This is a cloud-based system. Start a 30-day free trial.
- Idera SQL Diagnostic Manager (FREE TRIAL) This tool monitors SQL databases in physical and virtual environments including server CPU, memory, hard disk, and network usage. Start a 14-day free trial.
- Acronis Cyber Protect Cloud (FREE TRIAL) A package aimed at managed service providers that is delivered on a SaaS model and focuses on security for data held on endpoints. Start a 30-day free trial.
- Datadog SQL Server Monitoring An infrastructure monitor that includes database monitoring and a specialized integration for SQL Server.
- Checkmk An infrastructure monitoring system that includes specialized monitors for SQL Server. Runs on Linux.
- SolarWinds Database Performance Analyzer for SQL Server This cross-platform tool for Windows Server monitors SQL Server, MySQL, Oracle, DB2, SAP ASE, and Cloud servers from one centralized location.
- dbWatch Database Control A specialized database monitor that offers a unified front end for all of your database instances. Runs on Windows, Mac OS, and Linux.
- AimBetter This cloud-based service specializes in performance monitoring for SQL Server instances and can also tune Oracle and SAP systems. There is also a database management service available.
- Lepide SQL Server Auditing A server auditing package for effectively monitoring SQL instances that run on Windows and Windows Server.
- Red-Gate SQL Monitor This tool has 40 pre-configured alerts to monitor memory resource usage, high CPU, disk space, SQL errors, and SQL query performance issues.
- SQL Power Tools Lightweight agentless SQL monitoring solution that covers Oracle SQL Server, Informix, and Sybase database servers.
- dbForge Monitor Discover CPU utilization, memory utilization, disk activity, and IO latency with this tool.
The best SQL Server monitoring software
When selecting the tools for this article, we took into consideration the performance and features of each tool, their ease of use, their support and documentation, and robustness in use in a wide array of industry use cases.
Our methodology for selecting SQL Server monitoring scanner tools
We reviewed the market for SQL Server monitoring software and analyzed the options based on the following criteria:
- Monitoring functions to examine resource efficiency within the DBMS
- A service that examines the DBMS’s access to server resources
- An analysis tool that can identify inefficient or absent indexing
- An SQL query optimizer
- The ability to aggregate performance monitoring for several database instances
- A free trial for a no-cost assessment exercise or a money-back guarantee period
- A good mix of tools that will improve the efficiency and profitability of the company, paying back the purchase price
1. Paessler SQL monitoring software PRTG (FREE TRIAL)
Next up we have Paessler SQL monitoring software PRTG, part of the PRTG suite, a network monitor that also offers a range of SQL monitoring features. With this tool, you can monitor Microsoft SQL, Oracle SQL, MySQL, and PostgreSQL for signs of performance degradation. This process is made simple because Paessler SQL monitoring software PRTG has preconfigured sensor templates for all the most popular databases.
Key Features:
- Query performance: Measures execution time
- Server monitoring: Tracks the usage and availability of resources for databases
- Improvement recommendations: Query and database optimization
Why do we recommend it?
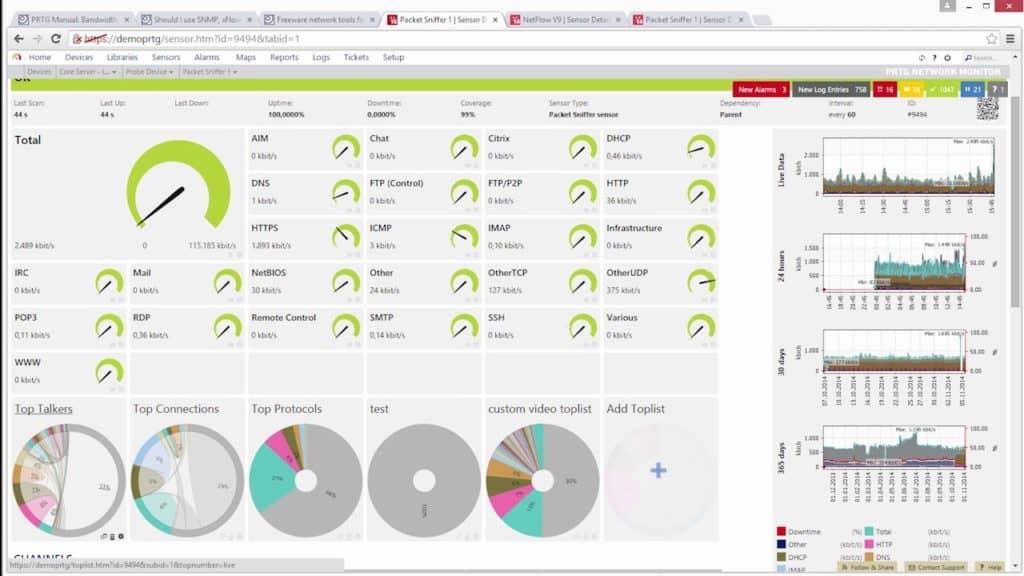
Paessler SQL Monitoring is part of the PRTG system. PRTG is an interesting on-premises package that runs on Windows Server and it is now also offered as a SaaS package. The PRTG system monitors networks, servers, and applications and it is composed of a very large package of sensors. Each sensor is a specialized monitor with its own display screens and there is a sensor available for SQL Server. You can let the tool watch SQL Server instances by itself because it will generate an alert if a problem arises. You choose which of the other sensors to turn on, so you create your own customized monitoring package.
Some of the sensors that Paessler SQL monitoring software PRTG comes equipped with out of the box include Microsoft SQL v2 Sensor, Oracle SQL v2 Sensor, MySQL v2 Sensor, PostgreSQL Sensor, and ADO SQL v2 Sensor. Each of these sensors has its own unique view and provides you with the key metrics relating to that individual server. For instance, the Microsoft SQL v2 Sensor tells you the execution time of the request, execution time of the query, number of affected rows, and downtime.
Outside of these unique sensor tools, Paessler SQL monitoring software PRTG also has a range of additional features like notifications. You can schedule alerts to determine when you will receive notifications for performance data events within your SQL Servers. Once an alert has been triggered you will be sent a notification via email or SMS. If you have the PRTG Network Monitor App on iOS and Android, then you can also receive the alert there.
Who is it recommended for?
The recent addition of a SaaS version means that it is difficult to imagine any business to which PRTG is not suited. The service is priced as an allowance of sensors, starting at 500. So, you fit together the combination that covers the specific technology on your sites. You don’t end up paying for functionality that you don’t need. Small businesses will also be interested in PRTG because if you only activate 100 sensors, you never have to pay for the package.
Pros:
- Flexible monitoring package: Choose which sensors to activate
- Database monitoring: For SQL Server, MySQL, Oracle, SAP, and PostgreSQL
- Full stack monitoring: Network, server, and application monitors are available
Cons:
- Not for Linux: Available for Windows Server or as a SaaS package
Paessler SQL monitoring software PRTG is one of the best SQL monitors for Windows devices. There is a freeware version of PRTG Network Monitor that lets you monitor up to 100 sensors without cost. From then on the prices range from $1,750 – $15,500 (£1,321 – £11,701) depending on the number of sensors you want. The cheapest paid version is PRTG 500 which offers 500 sensors for $1,750 (£1,321). The largest version is PRTG XL1 which offers unlimited sensors for $15,500 (£11,701). There is also a 30-day free trial of Paessler SQL monitoring software PRTG for evaluation.
2. ManageEngine Applications Manager (FREE TRIAL)

ManageEngine produces a range of IT infrastructure monitoring tools and SQL Server monitoring is part of its Applications Manager. This tool can be combined with other monitoring modules from ManageEngine to create a full IT support monitoring and management service.
Key Features:
- Database performance: Monitor database response times
- Physical server monitoring: Tracks the availability and usage of resources
- Tracks resource locks: Explains performance issues
Why do we recommend it?
ManageEngine Applications Manager is a similar system to the DAtadog Infrastructure package. The big difference between the two is that the ManageEngine system is a software package. You can install it on your own servers or on an account on AWS and Azure. However, even when you run it on a cloud platform, it isn’t a SaaS package and you keep full control. This tool monitors SQL Server instances in conjunction with all of the other applications, services, and server resources that interconnect with your SQL Server databases and it maps them, so you can see those relationships. The ManageEngine service provides instant root cause analysis when things go wrong.
The monitoring tool watches live database statuses including the performance of database services, such as memory and disk space usage and cache and buffer performance. The Applications Manager also records the utilization of database structures, such as tablespaces, and will warn the DBA if space is running out.
Database tuning services are also included in the SQL Server monitoring service. This includes analysis of database objects per type and also run-throughs of synthetic transactions to test queries on a database to spot which objects are badly implemented. Analysis tools also support SQL tuning.

The SQL Server monitoring section of Applications Manager is tabbed, which makes it easy to switch between screens of live data and access analytical features. The database monitoring capabilities of this tool are not limited to SQL Server. The Applications Manager will monitor a long list of database management systems, including Oracle, SAP, PostgreSQL, and MySQL. So, it is a suitable support service for mixed DBMS environments.
Who is it recommended for?
ManageEngine Applications Manager is in direct competition with the SolarWinds and Datadog services on this list. It is suitable for mid-sized and large organizations. However, ManageEngine has an ace up its sleeve that gives it a foot in the door in the small business market. This is a Free edition that provides a less complicated service for up to five hosts.
Pros:
- Tracks replication issues: Publications, subscriptions, and agents
- Performance tuning: Recommends query and database optimization
- Database monitoring: Also monitors DB2, Oracle, Sybase, PostgreSQL, Informix, SAP, and MySQL
Cons:
- Not a SaaS platform: Software for Windows Server, Linux, AWS, and Azure
The ManageEngine Applications Manager monitors server statuses as well, so all of the monitoring capabilities for the statuses of the underlying hardware is included along with the SQL monitoring capabilities with one package. The tool includes a wide range of application monitoring screens and it will monitor those systems that rely on databases, such as web servers. The Applications Manager installs on Windows Server and Linux and ManageEngine makes in available for a 30-day free trial.
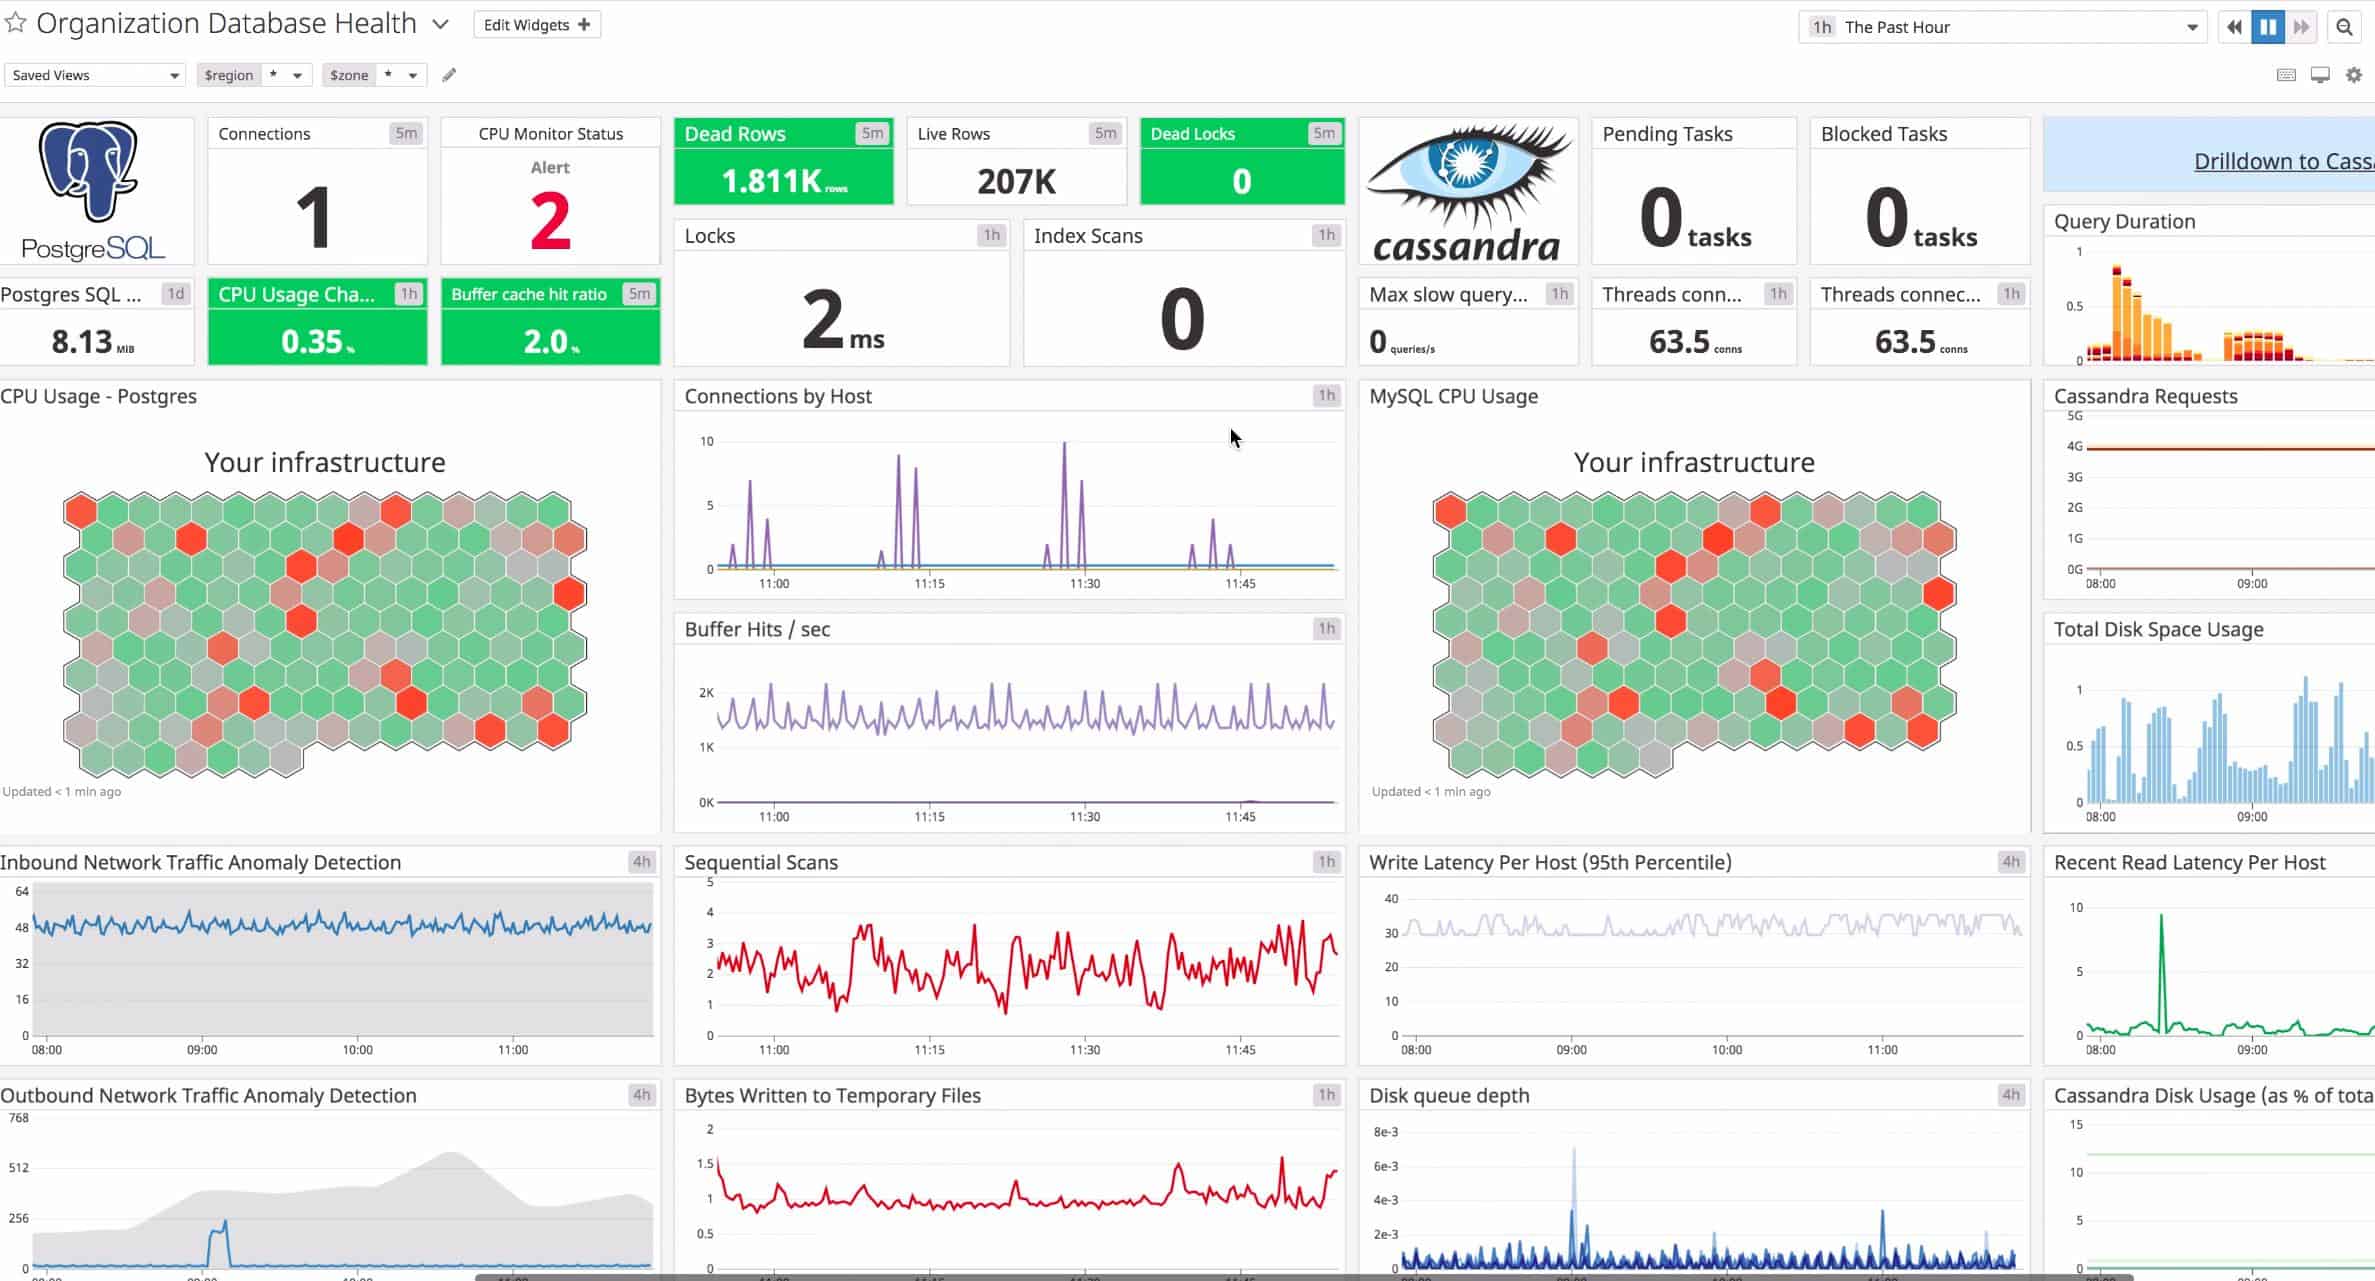
3. Site24x7 SQL Server Monitoring (FREE TRIAL)

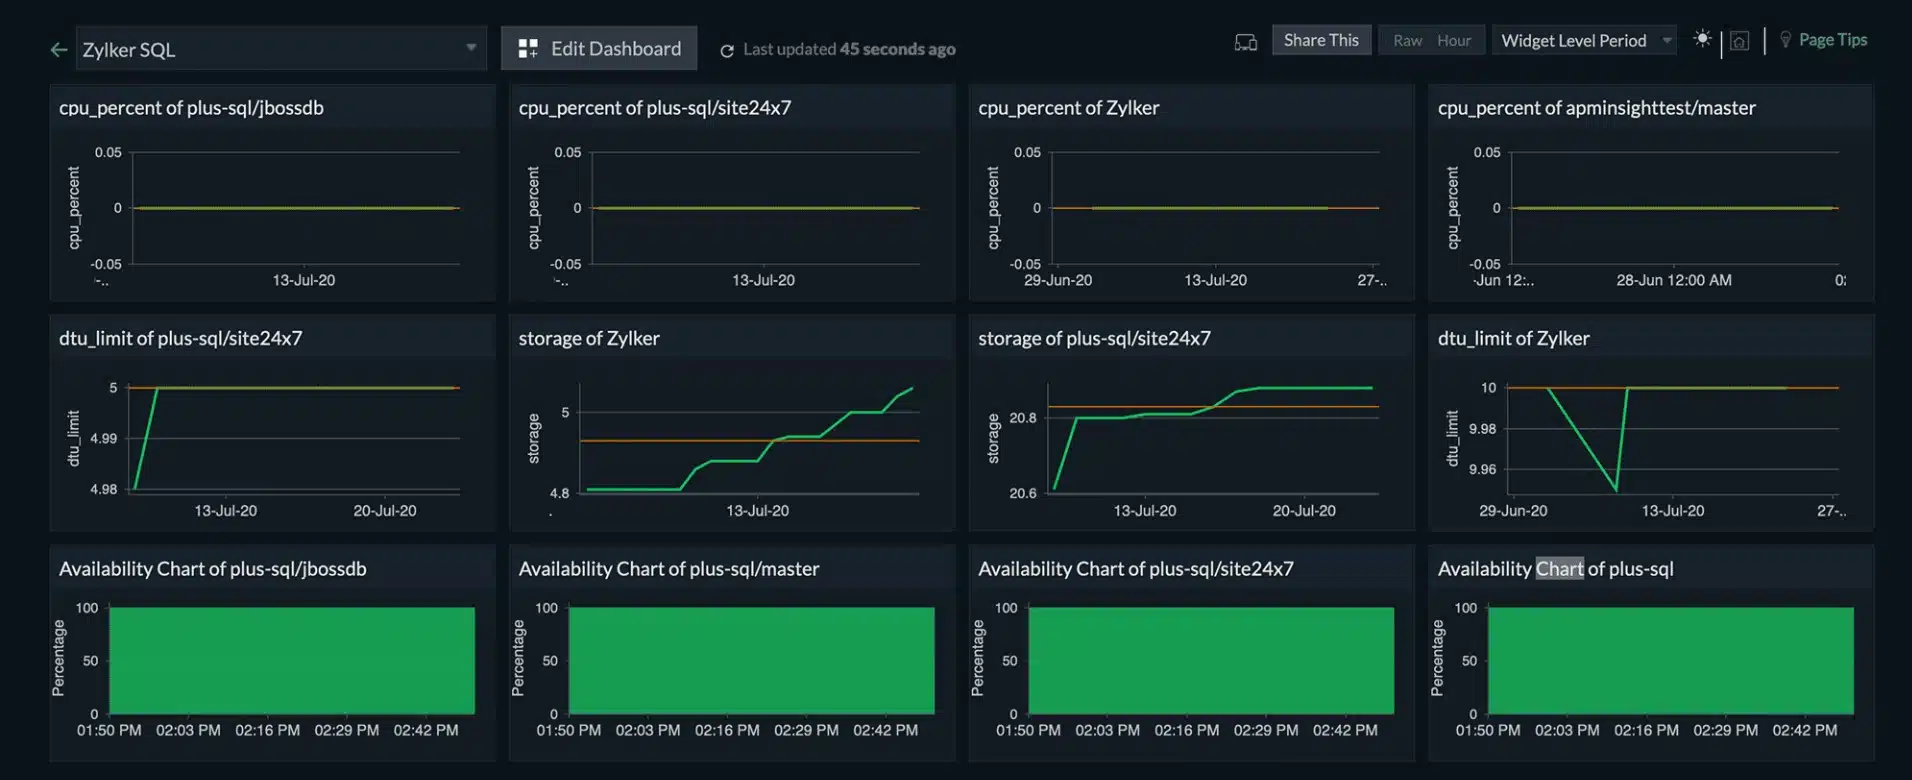
Site24x7 is a cloud-based platform of monitoring tools. The tools are bundled into packages and the Site24x7 Infrastructure plan includes database monitoring. The service is able to monitor SQL Server, MySQL, Oracle, PostgreSQL, Cassandra, DB2, MongoDB, VoltDB, CouchDB, and ClickHouse databases.
Key Features:
- Full stack observability: Part of a package to monitor networks, servers, and applications
- Cloud-based: A SaaS package
- Database capacity planning: Measures resource requirements
Why do we recommend it?
Site24x7 SQL Server Monitoring is provided by a cloud platform, which makes it a similar proposal to the package offered by Datadog. The Site24x7 is produced by the same company behind ManageEngine, so you will find similarities to the Applications Manager in this system as well. The big difference between this SaaS package and its big rivals is that Site24x7 offers its application and services monitoring utilities as part of a package of full-stack monitoring systems. So, you get network and server monitoring along with SQL Server and application monitoring.
The monitoring system requires an agent program to be installed on the system that contains the database to be supervised. However, that doesn’t have to be on the same server because the tool is able to reach databases across a network. It can unify the monitoring of databases on several different sites and also include cloud-based databases.
The Site24x7 Infrastructure service searches an enrolled system and creates an application stack map that identifies the dependencies of applications that serve a user-facing software package. The system is particularly strong at monitoring websites, where databases play an important supporting role.
The SQL Server examines the structure of a database instance, examining its data file size, log file size, and log cache hit ratio. The monitor watches SQL execution and records factors such as errors, replications, SQL compilations, and longest transaction time. It spots problems with resource locking and index inefficiencies. It also explores the resources of the server that supports the database and identifies the effects of each transaction on attributes such as CPU, memory, and disk space.
The SQL Server monitor includes an alerting mechanism that notifies technicians when performance drops or resources approach full capacity.
Site24x7 Infrastructure includes network, server, and website monitoring features as well as database monitoring. There is a 30-day free trial available for the monitoring system.
Who is it recommended for?
The SQL Server monitoring feature in Site24x7 is an extensive package that provides capacity planning, live activity monitoring, and log management, so it will be a great tool for DBAs. However, all of the other tools in the typical Site24x7 package will be needed by other administrators in the business, such as the network manager. So, this platform will be shared throughout the IT Department for automated performance monitoring and facilities management. This is a package that is suitable for use by mid-sized and large organizations. There is a Free edition for small businesses, but it doesn’t include application monitoring, so you can’t use it to watch over your SQL Server instances.
Pros:
- SQL Server logs: Gathers and analyzes logs
- Performance issues: Identifies reasons for poor response times
- Database design: Guidance for indexing and table partitioning
Cons:
- No on-premises version: This is a cloud-based system
Site24x7 Infrastructure is resident in the cloud, so it doesn’t need to be downloaded or installed. The maintenance for the software, processing power, and storage for the data that the monitor generates are all included in the price. The Web-based dashboard for the system includes customizable screens and it can be accessed from anywhere with any standard Web browser. The service costs $9 per month when paid for annually.
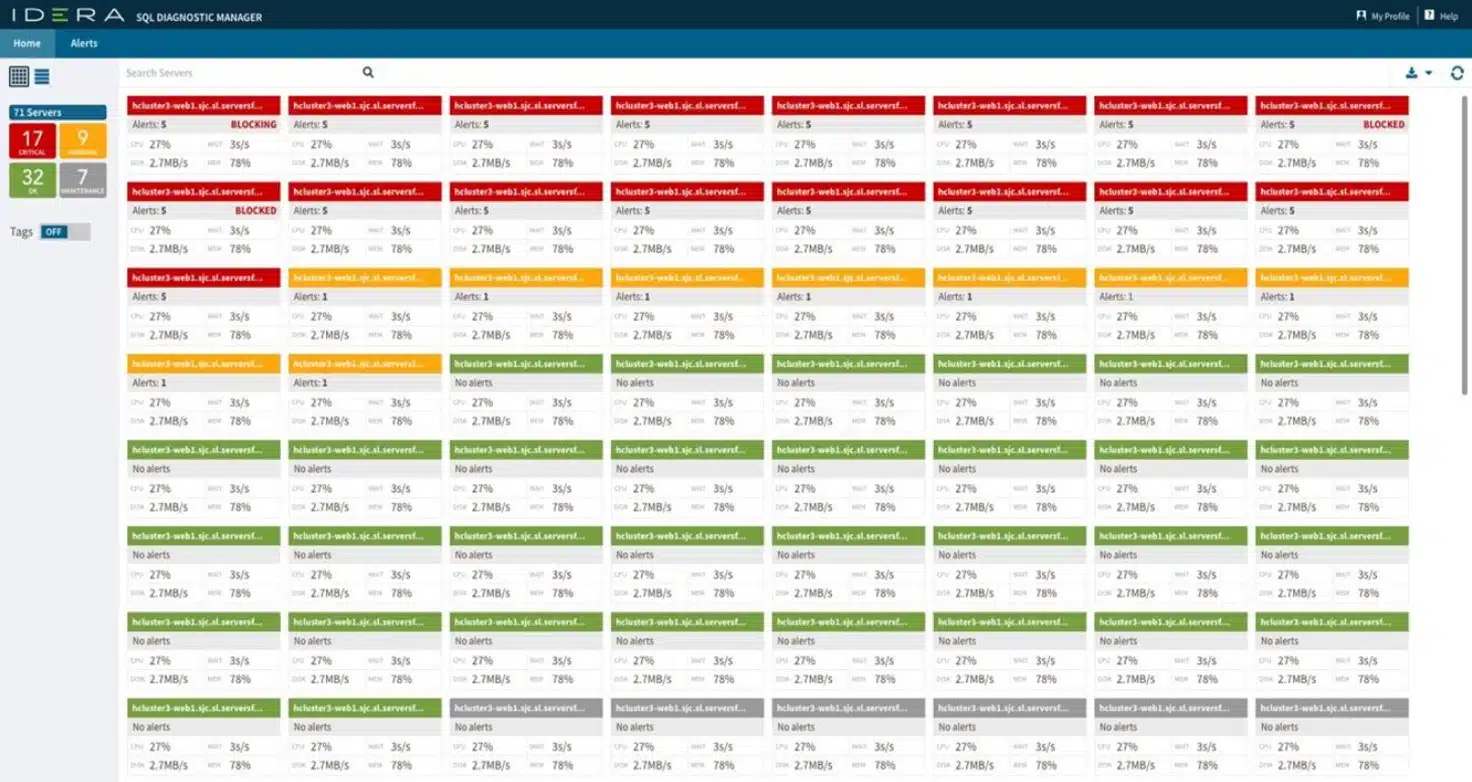
4. Idera SQL Diagnostic Manager (FREE TRIAL)
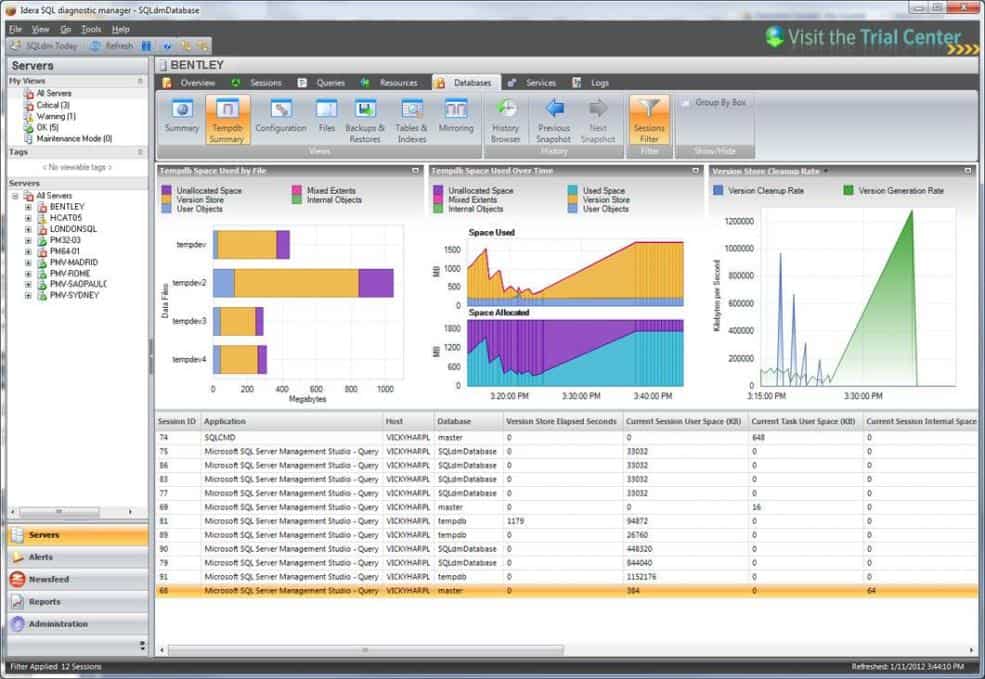
If you’re looking for more of a specialist SQL monitoring software product then Idera SQL Diagnostic Manager is the product for you. With Idera SQL Diagnostic Manager you can monitor SQL server databases in physical and virtual environments. You can view performance data on server CPU, memory, hard disk, and network usage. With this information, you can see if a server is experiencing difficulties.
Key Features:
- Monitors infrastructure: Monitors servers, virtualization, and cloud platforms that support databases
- Live performance monitoring: Tracks the response times of SQL Server databases
- Predictive alerts: Head off performance issues impacting users
Why do we recommend it?
Idera SQL Diagnostic Manager is packaged in two versions: one for SQL Server and one for MySQL. This system includes live performance monitoring as well as analysis of problems with database structures and SQL queries. The tool has an alerting mechanism that lets DBAs know when there is a gathering problem that needs to be dealt with, such as excessive locks or slow-running queries.
To get the most out of this program, you’re likely to need the SQL Query Tuner add-on. This add-on helps you to discover and diagnose SQL queries that are performing poorly. It does this by creating a graphical representation of the data so that you can see what is going on more clearly.
Predictive alerts is one of the most useful features offered by Idera SQL Diagnostic Monitor. You can configure custom thresholds for an SQL server activity alert so that you receive a notification once this trigger condition happens. This product also provides you with expert recommendations so that once an issue occurs you can run an automatic script to solve the problem. There is also specific guidance and online content to help you to fix performance issues as they occur.
Who is it recommended for?
The name of this system implies that it analyzes SQL and recommends improvements but, in fact, the SQL Query Tuner is an add-on function and not the main purpose of the system. This is a monitor for live activities in SQL Server instances and it tracks the utilization and availability of resources. This is a useful DBA tool for automated monitoring.
Pros:
- Manages availability groups: Creates high availability
- Identifies locks: Explains why the database stopped responding
- Fragmentation: Remediate fragmentation events
Cons:
- Runs on Windows and Windows Server: No cloud version
Idera SQL Diagnostic Manager is available for Windows 7, Windows 8, Windows 8.1, Windows 10, Windows Server 2008 SP2, Windows Server 2008 R2, Windows Server 2012, Windows Server 2012 R2, Windows Server 2016, and Windows Server 2019. You can purchase a single license of Idera SQL Diagnostic Manager for $997.60 (£753). There is also a 14-day free trial.
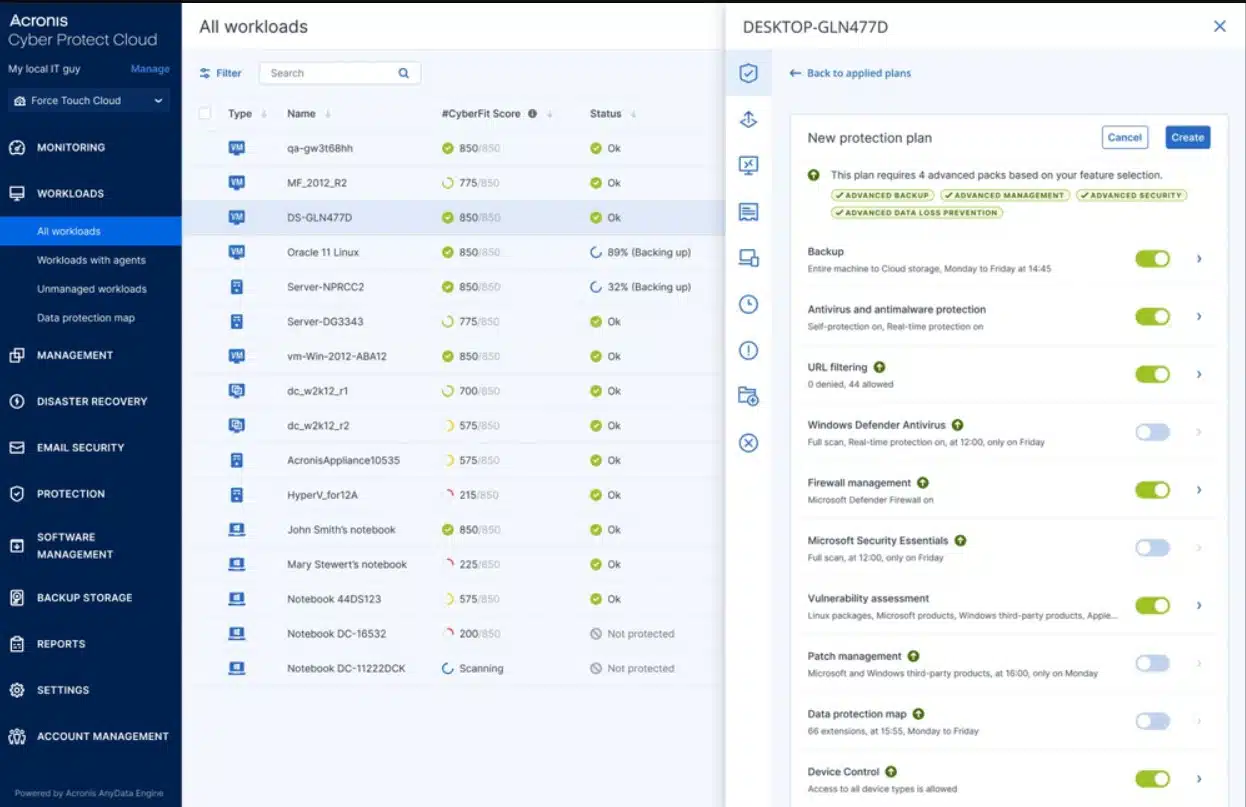
5. Acronis Cyber Protect Cloud (FREE TRIAL)
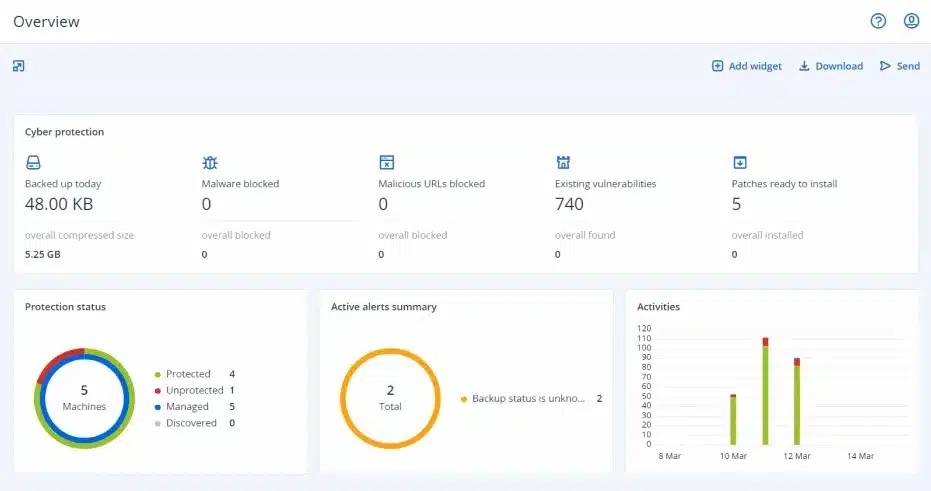
Acronis Cyber Protect Cloud is a SaaS package of system and data security measures that is designed for use by managed service providers (MSPs). The package includes Acronis Cyber Backup, which gives MSPs the opportunity to offer their clients a data backup and recovery service that includes cloud storage. The system also includes secure day-to-day file sharing and syncing features for the users on the endpoints covered by the Cyber Protect plan.
Key Features:
- Data backup: For servers, files, and database files
- Anti-virus: Detects a range of malware, including ransomware
- Data loss prevention: Guards data against theft
Why do we recommend it?
Acronis Cyber Protect Cloud is one edition of a suite of Acronis Cyber Protect systems and this one is aimed at managed service providers – there are other editions for direct system administration. This package is included here because, among its system-wide security monitoring services, it includes specific procedures to protect data in databases, including in SQL Server instances. This package includes malware protection and intruder detection. Perhaps the most important feature is its instant backup service that can quickly recover data if it is damaged or deleted.
The Acronis Cyber Protect Cloud system isn’t a full RMM solution. Instead, it is able to integrate with your current RMM and PSA systems to implement system-wide security and also log the chargeable services that the package offers.
Each individual service in the Acronis bundle can be turned on or off for each client. Therefore, the security services included in the package can be offered to each MSP customer as a menu of add-on modules. You don’t have to provide all of the Acronis security features to all of your customers.
The Acronis package can be white-labeled and its systems are supported with marketing and training material that helps the MSP present and explain the benefits of each security feature. Billing and contract negotiation are eased by the service reporting capabilities built into the Acronis Cyber Protect Cloud package.
The security features in the Acronis bundle offer a full range of endpoint and data protection services, which include insider threat detection, anti-malware, and Web-based threat scans and controls.
The system includes automated playbooks for threat remediation and data recovery. The threat detection processes in the Acronis package are based on AI-built baselining. Data security services extend to corporate services, such as file transfers and email systems, and can be managed by the customer’s administrator or an MSP technician to apply different data activity access permissions for different roles and user accounts. The Acronis SaaS package also includes a threat intelligence feed.
Naturally, communications between client sites and endpoints and the MSP technician console are also scanned and protected. The system includes threat reporting that provides source material for MSP security analysts to offer enhanced threat protection analysis to clients. The Acronis Cyber Protect Cloud toolbox also includes a system security auditing module that will support add-on consultancy security services that the MSP might want to offer to their clients.
Backup procedures in Acronis include automated AV scanning to prevent ransomware from working into your data stores. Recovery procedures also scan for malicious data infection in order to prevent re-infection of a client’s restored system. Backups are offered as both full disk and file-level options, which provides the MSP with a range of system protection strategies to offer to their clients.
Who is it recommended for?
As explained, Acronis Cyber PRtoect is a package for managed service providers. The tool focuses on security monitoring so the MSP will also need to find a performance monitoring tool for SQL Server instances.
Pros:
- Backup to cloud: Get cloud storage for repositories from Acronis
- Application backup: Backs up Microsoft 365 and Google Workspace
- Quick data recovery: Also offers business continuity
Cons:
- No specific processes for backing up databases: Extract data and backup the files
Acronis Cyber Protect Cloud is a subscription service and you can assess the package with a 30-day free trial.
6. Datadog SQL Server Monitoring
The Datadog Infrastructure Monitoring service is a cloud package that can monitor databases. The Datadog system can be enhanced with specialist plugins, called “integrations” and there is one available for SQL Server.
Key Features:
- Cloud-based: A SaaS package
- Base package: Part of the Infrastructure Monitoring module
- Integration: One of a library of extensions for the Infrastructure package
- Server monitoring: Watches supporting resources
- Query speed: Records slow-running queries
Why do we recommend it?
Datadog SQL Server Monitoring is provided by a unit on the Datadog cloud platform called Datadog Infrastructure. This package can be extended by add-ons, which are called “integrations.” There is an integration for SQL Server and this adds on extra screens and sensors. Invoking the SQL Server extension doesn’t remove the original infrastructure monitoring services of the package. So, you get live SQL Server instance performance monitoring in the context of service and server resource availability. Automated alert-based monitoring lets an administrator instantly see the root cause of any system problem involving SQL Server databases.
Data gathering for the monitoring service is performed by an agent but all processing is performed on the Datadog servers. Although the Datadog agents can be installed on Linux as well as Windows, the agent that monitors SQL Server will only install on Windows.
Installing the SQL Server integration doesn’t block the Datadog Infrastructure Monitoring from also monitoring other applications, rather, it adds specialized screens to the console for that account.
The console for Datadog is resident on the cloud server and it can be accessed through any browser. As it does not need to be installed on-site, Datadog Infrastructure Monitoring is able to monitor SQL server instances resident on remote sites and also those running on cloud servers.
We particularly like how you can query parameters like throughput, connections, execution performance, and buffer-pool use in real-time. Drag-and-drop functionality in the console makes your life easier
Who is it recommended for?
Although Datadog offers affordable per-host pricing, that should make the SQL Server monitoring package of Datadog appealing to small businesses. However, the complexity of this platform is probably more than a small business needs. This tool is more suited to mid-sized and large businesses that are heavily dependent on SQL Server databases for their success.
Pros:
- Performance alerts: Set up performance expectations that will trigger warnings if breached
- Demand observations: Records demand on database interfaces
- Processing volumes: Records throughput activity
- Capacity planning: Sees whether a database is undersupplied with resources
- Combined monitoring: Builds to a fuller service when combined with network, server, and web application monitoring
Cons:
- One part of a wider package: This is not a dedicated SQL Server package – Infrastructure Monitoring has many other functions
Datadog Infrastructure Monitoring is charged for by subscription with a monthly fee and also a lower annual rate available. That is a rate per host. The service is also available with an App Analytics add-on.
7. Checkmk

Checkmk is an infrastructure monitoring system for networks, servers, and applications. The system can be enhanced with product-specific plugins. Checkmk has more than one plugin for SQL servers and supports for example Microsoft SQL Server, MariaDB, MySQL, Oracle, and PostgreSQL.
Key Features:
- Monitors databases on-premises and on the cloud: SQL Server and Azure SQL
- Tracks supporting servers: Watches resource usage and availability
- Metric extraction: Via system table queries
Why do we recommend it?
Checkmk is a full-stack monitoring system that is offered in a number of editions – two of which are free to use. This package is similar to the proposals offered by Site24x7 and PRTG because it enables the monitoring of networks, servers, and applications. The SQL Server monitoring section of the Checkmk system looks at the resource activity within each instance. Outside the database, the tool watches interactions with other applications and also server resources. The addition of automated network monitoring completes the full system picture that can tell you the exact cause of any performance problems as soon as they arise.
The SQL Server monitor is able to track the performance of factors such as database connections, blocked sessions, cache hit ratio, tablespace resources, resource locks, backup performance, and database file sizes.
The monitor watches the interactions with host services and tracks processes, disk usage, and memory usage. The system also monitors the access to the network interface and the flow of database interactions across the network.

Checkmk is very easy to set up because it includes autodiscovery processes. These will search the network for every device and then scan each device to log all of the services that it hosts. SQL Server isn’t the only DBMS that Checkmk can monitor. It also monitors Oracle, MongoDB, MySQL, and PostgreSQL, among others.
Who is it recommended for?
This tool would benefit DBAs.The wider monitoring package provided by Checkmk can be used by other administrators of IT assets within the business. This is a very large package and its database monitoring services aren’t limited to SQL Server. Small businesses will opt for either of the two free editions of Checkmk.
Pros:
- Alerts: Trigger on shortages or response delays
- Multiple DBMSs: Monitors SQL Server, MySQL, Oracle, SAP, and DB2
- Multiple platforms: Windows, Linux, AIX, Solaris, and HP-UX
Cons:
- On-premises software: No SaaS version
Checkmk is offered in two editions. The Raw edition is a fork of Nagios Core and it is free to use. Checkmk also wrote its own proprietary infrastructure monitoring suite and there is a Free version of that, too. The full version of the paid system, which is called Enterprise Standard, has no limits on its capacity. There is also a version for managed service providers, called Enterprise Managed Services. You can access a 30-day free trial download.
8. SolarWinds Database Performance Analyzer for SQL Server
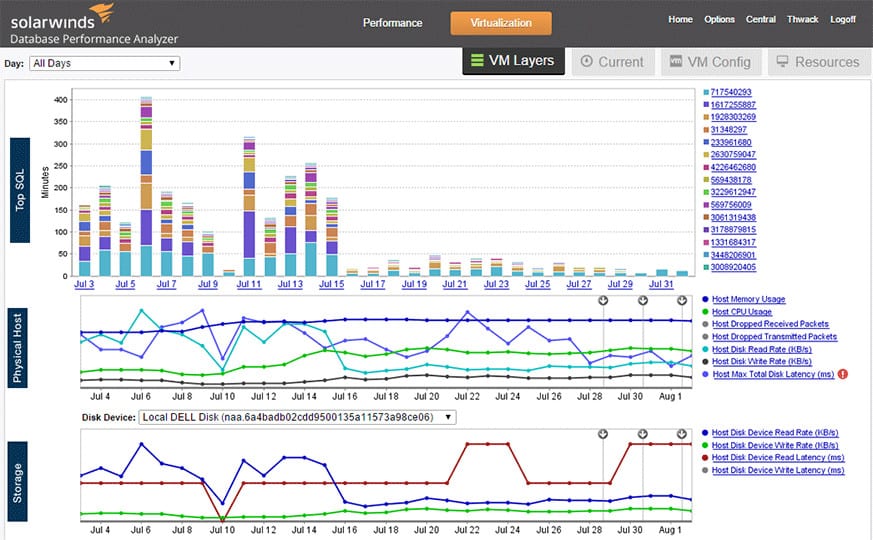
SolarWinds Database Performance Analyzer for SQL Server (DPA) has been designed as a complete server monitoring solution for modern networking. With SolarWinds DPA for SQL Server you can monitor SQL Server, MySQL, Oracle, DB2, SAP ASE, and Cloud servers from one centralized location. One of the main focuses of this product is finding the root cause of performance faults.
Key Features:
- Cross-platform: Monitors databases on-premises and on the cloud
- Built for Windows Server: On-premises software package
- Performance anomalies: Looks for deviations in request processing speed
- Alerts: Raie on resource shortages or performance drops
Why do we recommend it?
SolarWinds Database Performance Analyzer is able to track activities on SQL Server as well as many other DBMSs. The tool can watch over multiple DBMSs simultaneously and multiple instances per DBMS. The tool is able to monitor databases running on Windows Server and Linux and also cloud databases. This is a summarizing system that provides automated monitoring with alerts that identify emerging performance problems.
The user is provided with a data collection engine to view the raw server usage data. This includes a graph detailing how the SQL server performance metrics have changed over time which can be viewed in five unique ways (Summary, CPU, Memory, Disk, and Network). To get to the root cause of performance issues, it allows you to use metrics such as wait times, users, files, and objects to find out what the problem is.
What makes it one of the best SQL Server monitoring tools is that it has a low overhead cost on system resources. This means that you can run the program while having a minimal impact on your network performance.
Uses machine learning for anomaly detection and provides real-time and historical data.
Who is it recommended for?
This package is a DBA support tool. It not only provides automated monitoring but it will give you assessments of indexing that is adjusted according to the types of activities that dominate database usage. The tool will also highlight inefficient queries. Although the database and query analysis services in the package provide useful information for developers. This is not really intended for use directly by designers and developers but can provide information that the DBA can input into any design team.
Pros:
- Query optimization: Spots slow running queries and recommends changes
- Database tuning: Recommends changes to database object to suit access patterns
- Virtualization monitoring: Tracks the activity of VMware vSphere
- Physical server monitoring: Records the availability of supporting resources
Cons:
- Only for Windows: Doesn’t run on macOS or Linux
SolarWinds DBA is not only scalable but can also be integrated with other tools like SolarWinds Server and Application Monitor and Storage Resource Monitor, meaning that you can expand the monitoring experience based on your own requirements. The price starts at $1,170 (£883). There is also a 14-day free trial.
OS: Any physical or virtual Windows or Linux server that supports JRE v11
The combination of the Database Performance Analyzer and the Server & Application Monitor provides root cause analysis for performance issues. The bundle is called the Application Performance Optimization Pack
9. dbWatch Database Control
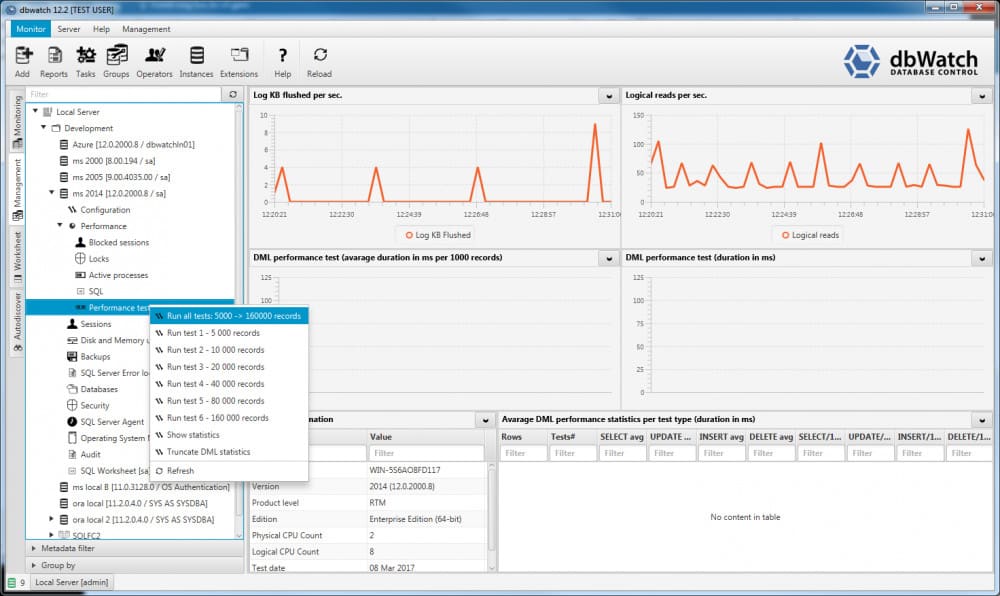
The dbWatch Database Control package isn’t part of a wider general server or application monitor. It is a specialized SQL server database monitoring system.
Key Features:
- Multi-platform: Monitors databases running on-premises, on virtualizations, and on the cloud
- Multiple DBMSs: SQL Server, Azure, Oracle, PostgreSQL, Sybase, MariaDB, and MySQL
- Datacenter service: Database farm management
This tool is capable of monitoring several databases at once and it isn’t restricted to working with just one database brand. The tool is able to monitor SQL Server, Oracle, Sybase, MariaDB, MySQL, and Postgres databases. It also doesn’t have a problem with watching over the coordination of clusters created with Oracle and SQL Server. This is a universal solution that can monitor cloud-based databases managed by Azure SQL as well as on-site implementations, It can even handle hybrid environments.
Why do we recommend it?
dbWatch Database Control is a pure database monitoring system and not a systemwide monitor with database monitoring capabilities like many of the tools above. This system can monitor and manage SQL Server, MySQL, MariaDB, PostgreSQL, Oracle, and Sybase databases simultaneously. It will aggregate statistics for all DBMSs and also for all instances of each DBMS. You can then drill down in the console and examine each instance. It can monitor on-premises and cloud-located systems together.
The environment allows you to view live data on database events and these views can be accessed on a per-database basis or as aggregated data across a selection of databases or all databases. The pre-written reports that come with the system are also available to log both an individual database or across all of your instances.

It doesn’t matter where your databases are located because dbWatch centralizes access to them whether they are onsite, in the Cloud, or on a remote site. The tool is available for all sizes of enterprises, thanks to a scalable pricing structure. However, the minimum license size covers ten databases, so it probably wouldn’t be suitable for very small enterprises.
The software for dbWatch is available for download and installs on Windows, Mac OS, and Linux servers. The package is available in three plan levels.
Who is it recommended for?
Businesses that have many and varied DBMSs to watch over need this system. Organizations that are not so database-intensive probably won’t need all of the power of this tool. The performance alerts in this system relieve busy DBAs from having to watch over all databases all of the time, so the dbWatch system really squeezes value for money out of a DBA’s wages.
Pros:
- Monitors services to the database: Connections, memory, disk, and CPU
- Database performance: Query response times
- Deployment options: Runs on Windows, macOS, and Linux
Cons:
- Not for small businesses: Minimum license size covers 10 database instances
The lowest of these, dbWatch Essentials, will give you SQL Server monitoring and will also cover any other DBMS implementations. The next plan up, dbWatch Professional, includes maintenance automation and SQL Server and Oracle license management functions. The top package, dbWatch Enterprise, has all of the facilities of the lower two packages plus cluster support, security monitoring via Active Directory, database autodiscovery, and the ability to extract data out in CSV format for import into Excel. You can try out dbWatch Essentials risk-free on a 30-day free trial.
10. AimBetter
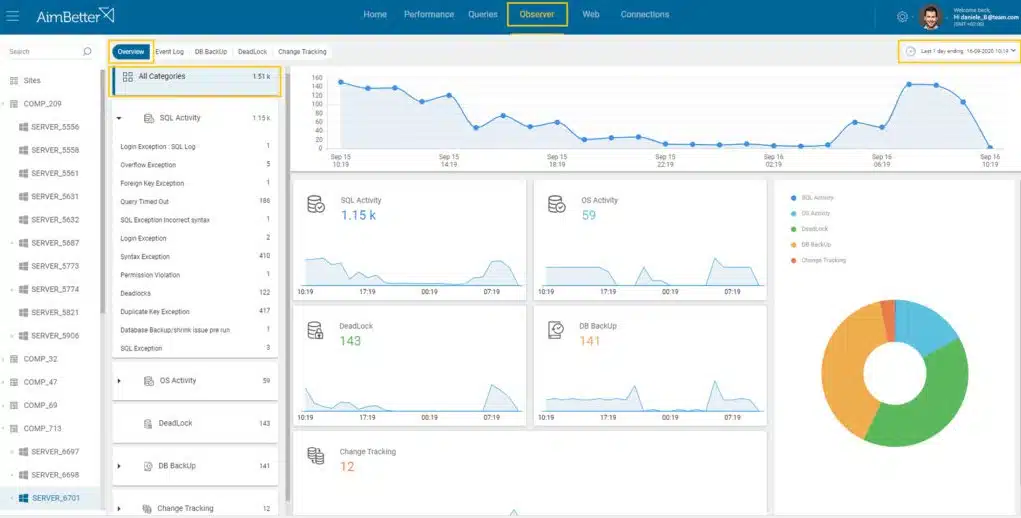
AimBetter is a SaaS package that was developed by SQL Server experts. The tool assesses your database structures to offer guidance on object optimization and then watches over the activities of your instances. The design of your database is very dependent on how it is used – for example, a system that experiences many inserts has different indexing requirements to tables that are only ever referenced. So, AimBetter gathers information on how best to tune your database by recording how it is used.
Key Features:
- Real-time problem solving: Delivered from the cloud
- Examines assets: Watches over SQL Server, IIS, Amazon RDS, and Oracle
- Operating system examination: Windows, Azure, and Linux
Why do we recommend it?
AimBetter is a cloud-based database performance monitor. This is a very similar service to the Idera package above, which is an on-premises system. The AimBetter platform is able to deliver live monitoring for SQL Server, Azure SQL, Oracle, and Amazon RS. It performs statistical analysis on queries while watching resource capacity in order to predict resource shortages. Its activity monitoring also extends to security alerts based on anomalous behavior detection.

The performance monitoring service in AimBetter tracks more than 400 metrics. It looks at how the DBMS interacts with its underlying host’s resources and can spot when space and memory allocations need to be resized. The service will help you to improve the structure of your SQL Server instances.
The performance monitor includes automated alerts, which will warn you of developing problems. However, this isn’t just a monitoring package – it is a managed service. You also get the advice of expert SQL Server consultants on how you should improve your databases to get better performance. The experts will only advise you, making those changes is still up to you. However, on a managed service plan, you can get AimBetter to provide the DBAs as well.
Who is it recommended for?
The AimBetters system can watch over databases that are hosted on-premises or in the cloud. It is a suitable tool for businesses of all sizes but large organizations with many databases would benefit most from its database monitoring services. This is an automated monitoring system with alerts to support DBAs.
Pros:
- Database functions: Performance monitoring and optimization recommendations
- Examines conflicts: Checks that security systems aren’t blocking database access
- Query optimization: Response time tracking
Cons:
- No price list: This is a customized service
AimBetter is a cloud service and so you don’t need to install the system on your own site. This configuration is preferable as most SQL Server databases are themselves hosted on cloud servers and form part of other services, such as Web hosting. You need to install an agent on the server that hosts your databases. The AimBetter package includes data retention for historical analysis and also analytical tools to mine that information.
The AimBetter dashboard can be accessed through a Web browser or a dedicated mobile app. You can try out the AimBetter service by requesting a free trial.
11. Lepide SQL Server Auditing
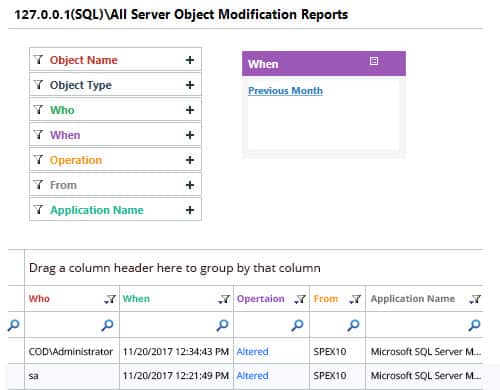
Lepide SQL Server Auditing provides a solid server auditing experience for monitoring SQL instances. With Lepide SQL Server Auditing all changes made to the configuration of SQL users, permissions, triggers, SQL server databases, and logins are saved as audit data. This is great for tracking how SQL configurations change over time and keeping on top of what is going on.
Key Features:
- Change documentation: Identifies configuration and permissions changes
- Database object tracking: Records changes to objects
- Alerts: Let the DBA know about unauthorized changes
Why do we recommend it?
Lepide SQL Server Auditing is a security tool that logs all changes to important table entries, such as user accounts and privileged access account information. As well as generating log records for data changes, the Ledide system will raise an alert for each event. The package also includes compliance reporting templates.
The Lepide SQL Server Auditing platform also allows you to monitor the health of connected SQL Servers. Lepide SQL Server Auditing monitors servers and provides you with data on usage, CPU usage, connections, and error rates. If a server goes down then you will be notified by an alert. Alerts are sent as console updates, emails, and push notifications from the LepideAuditor App.
Who is it recommended for?
The Lepide database auditing system is particularly important for businesses that need to comply with data protection standards, such as GDPR, CCPA, SOX, HIPAA, and PCI DSS. The tool would be managed by a DBA but an INformation SEcurity OFficer would also need access to the system.
Pros:
- Audit reports: Suitable for PCI DSS, HIPAA, SOX, GDPR, and CCPA
- Multiple instances: Tracks multiple database instances simultaneously
- Windows and Windows Server: No versions for macOS or Linux
Cons:
- No price list: Deters small businesses
You can download Lepide SQL Server Auditing on Windows 7, Windows 8, Windows 8.1, Windows 10, Windows Server 2008, Windows Server 2008 R2, Windows Server 2012, Windows Server 2012 R2, and Windows Server 2016. If you want to know the price of Lepide SQL Server Monitoring then you’ll need to contact the sales team directly. Lepide also offers a free trial of this software.
12. Red-Gate SQL Monitor
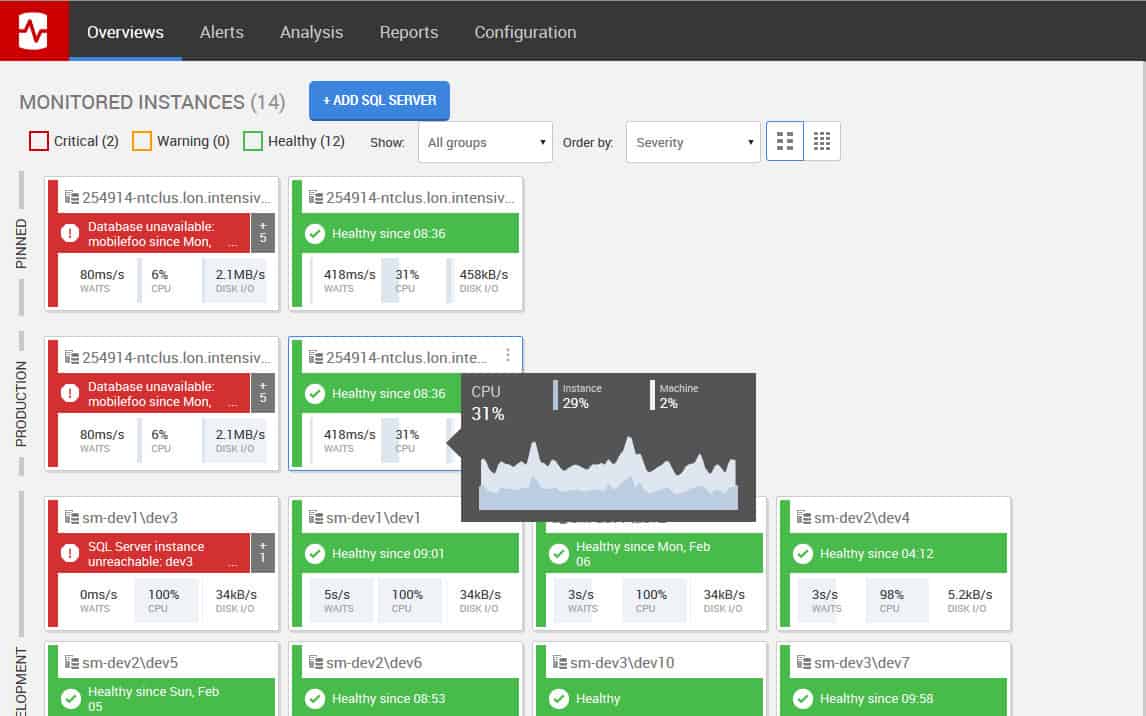
Red-Gate SQL Monitor is an SQL monitoring solution that offers one of the most modern monitoring experiences on this list. Red-Gate SQL Monitor gives you a Global Overview that allows you to view the health of connected servers from one window. This view shows a color-coded display of server health throughout your network. In the event that a server is down, it will turn red with a fault message. Fault messages include a notification like “Long-running query. sharepoint since 4:22”.
Key Features:
- Multiple DBMSs: SQL Server and PostgreSQL
- Cross-platform: Monitors on-premises and cloud-based databases
- Simultaneous monitoring: Tracks many database instances simultaneously
Why do we recommend it?
Red-Gate SQL Monitor provides an SQL Server monitoring service for multiple database instances simultaneously. The tool can watch over many databases on different platforms, which could be on-premises, on remote sites, or in the cloud. The console provides a single display for each database with color-coded statuses. The tool will also raise an alert if it discovers a performance issue with one of your instances.
Red-Gate recognizes that even with this Global view it is difficult to keep track of a live network which is why they have their own alerts system. The alerts system comes with 40 preconfigured alerts and can also be customized to send you alerts once a certain threshold has been exceeded. You can set thresholds for memory resource usage, high CPU, disk space, SQL errors, and query performance issues.

One of the most noticeable things about this product is how clear and pristine the graphs and visual displays are. They make it easy to monitor your server health promptly. There is also a reporting module that you can use to further breakdown your data for future analysis. You can export reports to PDF and schedule them to be emailed to you in the future.
Who is it recommended for?
This system is designed to support a central IT support department that manages multiple sites and includes many SQL Server databases. The tool isn’t suitable for small businesses and your organization would need to be running a lot of instances to fully benefit from Red-Gate SQL Monitor.
Pros:
- Performance monitoring: Tracks slow queries
- Diagnosis: Recommendations for query optimization and database tuning
- Alerts: Trigger when performance drops
Cons:
- Windows software: Only available for Windows and Windows Server
In organizations where top-down visibility over lots of different servers is vital, Red-Gate SQL Monitor is an excellent choice. The Global view will provide you with that core dashboard monitoring experience that keeps you on top of everything going on. You need to request a quote from the company website to view the price. You can evaluate their software on a 14-day free trial.
13. SQL Power Tools
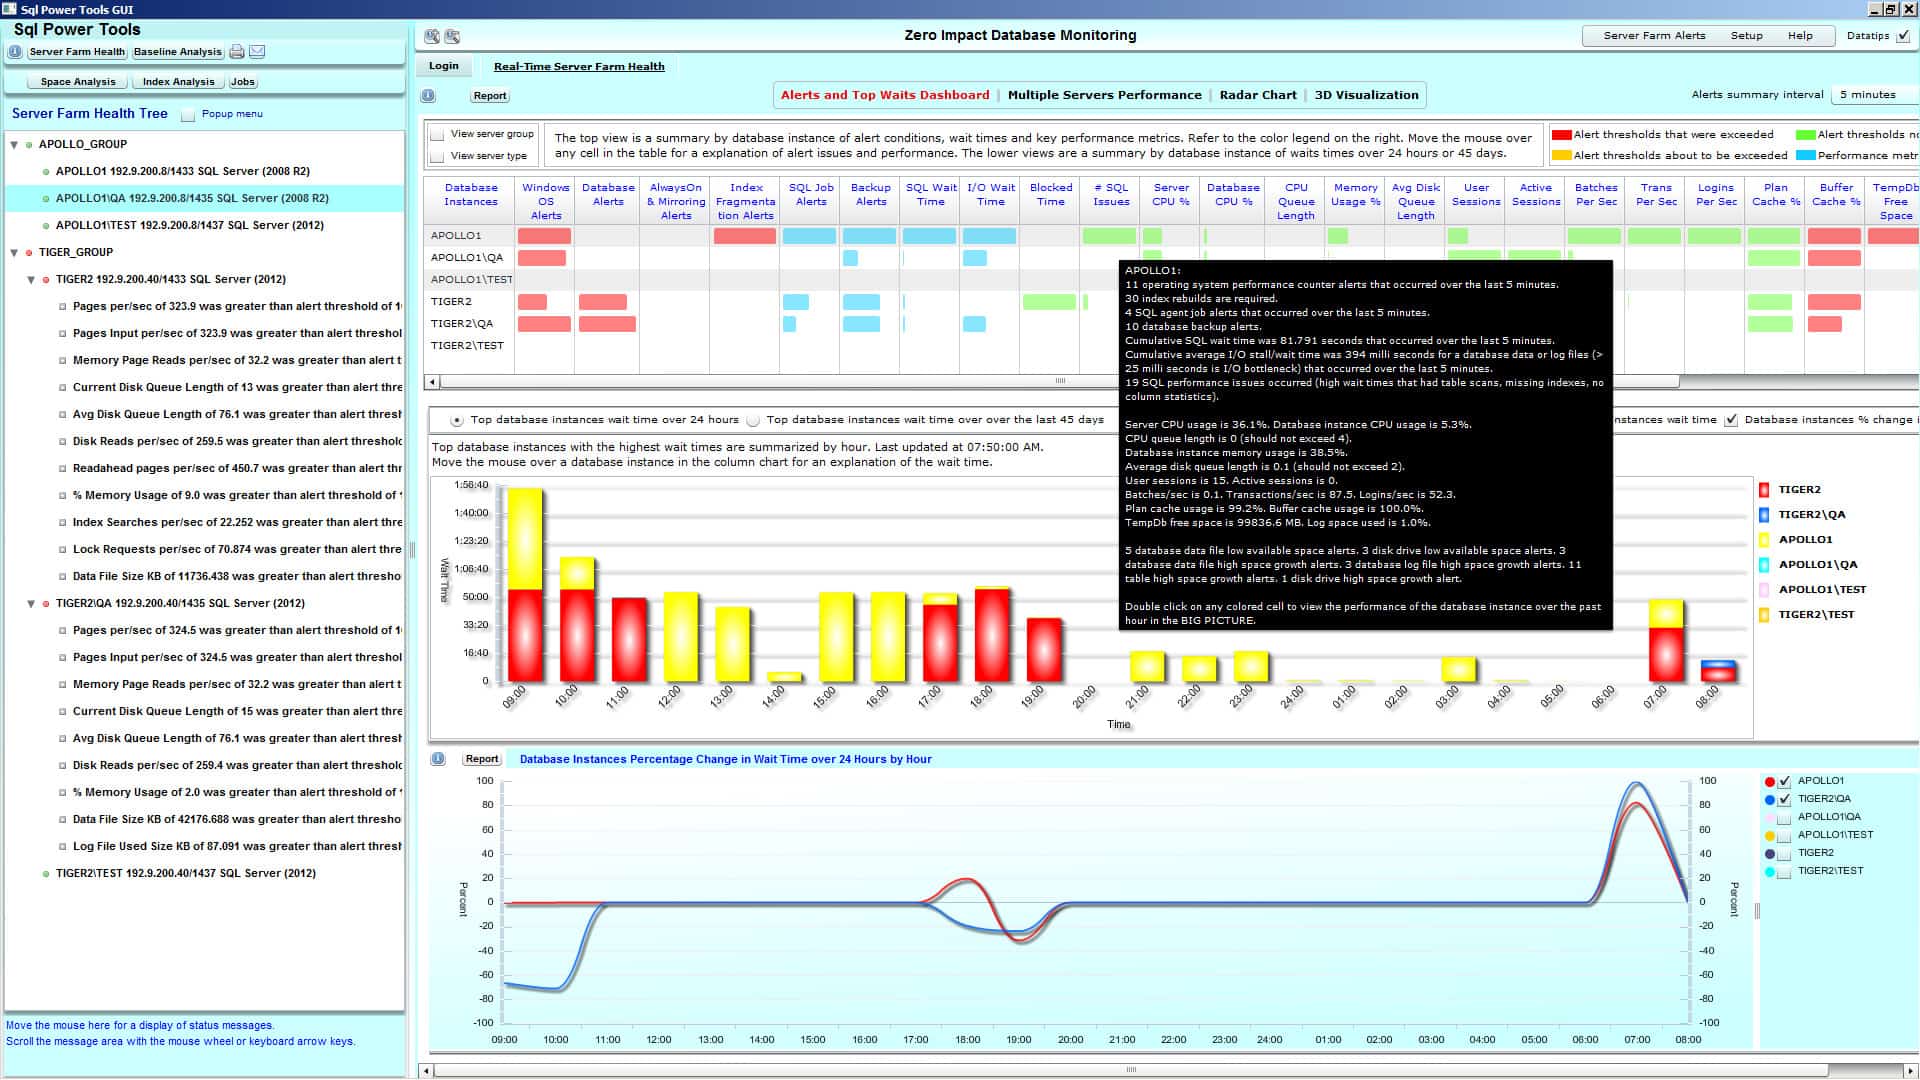
SQL Power Tools is an agentless SQL monitoring solution that is dedicated to being as lightweight as possible. With SQL Power Tools you can monitor Oracle SQL Server, Informix, and Sybase database servers with minimal impact on your server resources. Impact is kept to a minimum because the software uses packet sniffing to analyze the performance of the server.
Key Features:
- Arms-length monitoring: Reads packets in and out of the database
- Multiple DBMSs: SQL Server, DB2, Informix, MariaDB, MySQL, Oracle, PostgreSQL, and Sybase
- Response time tracking: Identifies poor performance
Why do we recommend it?
SQL Power Tools is a platform that provides both performance monitoring and security monitoring for SQL Server databases. The performance monitoring unit tracks typical throughput metrics for each database instance while the security monitoring module tracks activity to identify anomalies that could indicate a breach. The tool gathers its information by sniffing network packets and scanning those that are going to or coming from a database.
The data utilized by SQL Power Tools includes response time, destination IP, source IP application, start time, end time, database, rows returned, bytes sent, and packets sent. This is a sizeable body of data that gives you everything you need to scrutinize a database’s performance.
One of the key areas that SQL Power Tools focuses on is cybersecurity. This tool has been designed to prevent cyber attacks with Advanced SQL Behavioral Analysis and User Entity Behavior Analytics (UEBA). When an attacker tries to breach your network these two will recognize the threat and stop it immediately. This makes SQL Power Tools a good solution for securing your servers as much as monitoring them.
Who is it recommended for?
SQL Power Tools isn’t just able to monitor SQL Server. IT can also watch over MySQL, MariaDB, DB2, Informix, Oracle, PostgreSQL, and Sybase. The two units on the platform support different roles within the organization. The performance monitoring system is for use by a DBA, while the security monitor would be operated by the network manager or a cybersecurity specialist. As with the Red-GAte tool, this system is most suitable for large organizations with many databases. SQL Power Tools has the edge over Red-Gate because it can monitor many DMBSs, not just SQL Server.
Pros:
- Records waits: Looks at locks and other blocking events
- Fault analysis: Examines index fragmentation and server resource shortages
- Simultaneous monitoring: Good for server farms
Cons:
- Busy dashboard: Some might find this too much information
Overall SQL Power Tools is a product that should be considered by any organization that wants to combine a performance monitoring solution with additional cybersecurity capabilities on Windows. In order to view the price of SQL Power Tools you’ll need to contact the sales team directly. You can request a free trial.
14. dbForge Monitor
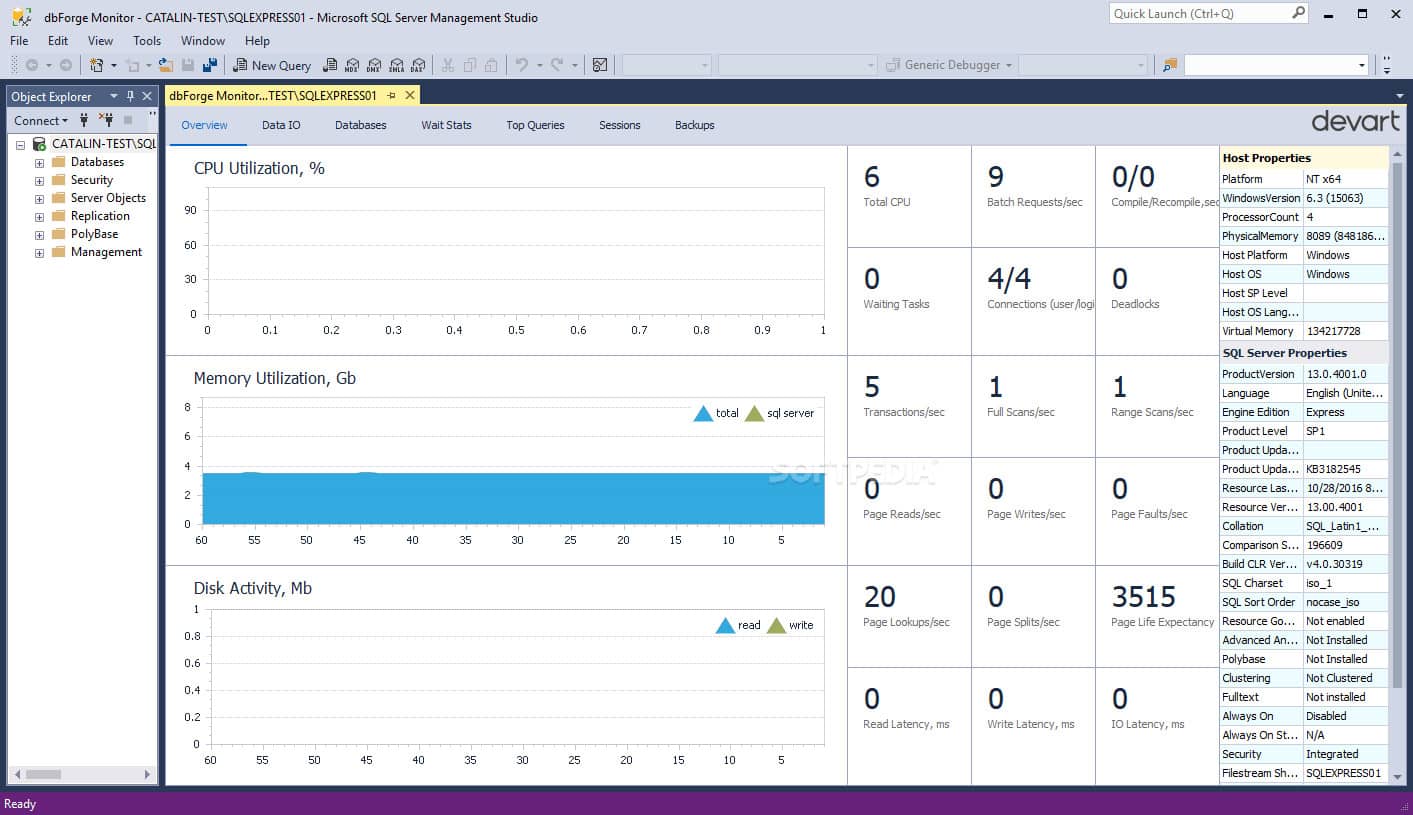
dbForge Monitor is an SQL monitoring tool for Windows that delivers a simple and contemporary SQL monitoring experience. dbForge Monitor absolutely nails the top-down perspective required by a larger network with a dedicated Overview tab. In the Overview tab, you can view key metrics like CPU utilization, memory utilization, disc activity, and IO latency.
Key Features:
- A plug-in for SQL Server Management Studio: Both tools are free
- Live statuses: Tracks multiple instances in one dashboard
- Root cause analysis: Get suggestions for performance issue causes
Why do we recommend it?
dbForge Monitor is an add-on unit for Microsoft SQL Server Management Studio (SSMS). Both the Microsoft system and the dbForge software are free to use. The dbForge system lets you monitor multiple SQL Server instances simultaneously. The overview page of the console consolidates all statistics into one screen. You can then drill down to see the metrics for each individual instance.
If you would like to delve deeper into the read and writes for individual database files then you can use the IO Data tab. Through the IO Data tab, you can view total data reads and writes, latency, and input/output operation count. Similarly, the Wait Stats tab is designed specifically to tell you the wait time and waiting tasks to help you pinpoint resources that are adversely affecting server performance.
With regards to queries, dbForge Monitor has its own SQL query performance analyzer to keep tabs on resource optimization. The SQL query performance analyzer looks out for resource-intensive queries that overwhelm the system so that it can’t cope with its entire workload. You can view the query text and query profiling data so that you can rewrite it to support your server better.

Who is it recommended for?
This system is a DBA tool for businesses of all sizes. Small businesses will appreciate that this very competent tool is free and larger businesses that have many SQL Server instances will particularly benefit from this system. If you also run databases from other DBMSs, you would need to look for another unified database monitoring tool.
Pros:
- Identifies slow-running queries: Lists the worst performers
- Query optimization: Recommendations to improve performance
- Monitors servers: Correlates resource usage with database activity
Cons:
- An add-in: Requires SQL Server Management Studio
All-in-all, dbForge Monitor is the ideal tool for users who want to view in-depth metrics without relying on too many complex displays. In order to run dbForge Monitor you need Microsoft SQL Server Management Studio 2012, 2014, 2016, or 2017. You also need to have .NET Framework 4.5.2 installed. You can download dbForge Monitor for free.
The Verdict
That concludes our look at the best SQL monitoring tools for 2020. Of all the tools mentioned on this list we recommend Paessler PRTG and ManageEngine Applications Manager. Both of these tools offers a server health monitoring experience that can function well within any size environment. The autodiscovery feature of the former makes this a particularly simple process.
No matter what your preferences are, we recommend that you try out a number of free trials before you make a purchase. If you’re working within a small network then it is ideal to try out a tool like Paessler SQL monitoring software PRTG on account of its freeware version. The most important thing is to find a product that you’re comfortable monitoring with before you make a purchase. At the end of the day, your comfort with the program will determine how effective it will be when you use it on a daily basis.
SQL Server Monitoring FAQ
What is the first step in reviewing your system in SQL?
Before approaching the task of reviewing your system in SQL, ensure that you have an effective monitoring tool. Reviewing the system by manually issuing a series of SQL queries is time-consuming, prone to error, and could slow down or block a system if it is already close to its operating limits. A performance monitor can give you advanced warning of potential problems before they become critical so you know that any actions you take in the database aren’t likely to make a bad situation worse.
What are the performance counters in SQL Server?
The term “performance counters” means the metrics or system indicators that you need to watch in order to prevent the database and its supporting services from getting overloaded. The most important of these are:
- % Processor Time
- Processor Que Length
- Processors Blocked
- SQL Compilations/Sec (or Re-compilations/Sec
- Total Server Memory
- Bytes Total/sec
- Average Disk Queue Length
- Pages/Sec
- Buffer Cache Hit Ratio
- Cache Hit Ratio
How do you check a SQL Server instance is running or not?
The steps to check on whether an SQL Server instance is running are:
- Open Microsoft SQL Server Management Studio
- Scroll through the Object Manager to find the folder the represents the instance that you want to check on.
- Right-click on the mouse to get the context menu.
- Look through the options. If Start is grayed out, the instance is currently running.
See also: The Best SQL Query Builders

Thanks for putting this together. It helped me cross reference with some other rankings to help me pick my TOP 5 for my DBA team to look at and pick a new monitoring tool for our company.