The rise of virtualized infrastructure and virtual machines has had substantial consequences for network administrators. Well-established network monitoring practices have been shaken up as enterprises incorporate performance monitoring platforms and Hyper-V monitoring tools to monitor virtual infrastructure.
Here is our list of the best Microsoft Hyper-V Monitoring Tools:
- Paessler PRTG Network Monitor (FREE TRIAL) An integrated network, server, and application monitoring suite that is ideally configured for VM monitoring. Runs on Windows Server and specializes in Hyper-V virtualizations. Download a 30-day free trial.
- ManageEngine OpManager (FREE TRIAL) A network and server monitoring package that includes Hyper-V monitoring capabilities. Available for Windows Server and Linux. Start a 30-day free trial.
- Site24x7 Hyper-V Server Monitoring (FREE TRIAL) A cloud-based monitoring system for networks, servers, and applications that includes a special integration for Hyper-V systems. Access the 30-day free trial.
- ManageEngine Applications Manager (FREE TRIAL) An application monitoring system that includes the supervision of Hyper-V and other virtualization systems. Installs on Windows Server and Linux.
- Datadog Hyper-V Monitoring A resource monitoring system that can be enhanced by an add-on for specialized Hyper-V monitoring.
- SolarWinds Virtualization Manager A sophisticated VM monitoring tool from the industry leader. Covers Azure and AWS as well as onsite Hyper-V and VMWare virtualizations.
- eG Enterprise Web-based Hyper-V monitoring solution with a massively discounted subscription deal.
- LogicMonitor Cloud-based Hyper-V monitor with three subscription levels.
- Veeam One A monitor for Microsoft Hyper-V and VMware vSphere that runs on Windows.
- Dynatrace A Hyper-V performance monitor with great live feedback screens and advanced diagnostics.
- Turbonomic Manage Hyper-V, vSphere, KVM, and PowerVM implementation with this live monitoring and capacity planning tool.
- EventSentry Real-time and historical data analysis for a range of infrastructure elements, including Hyper-V.
Now that so many companies are using Microsoft Hyper-V to deliver virtual services a range of Hyper-V monitoring tools have cropped up to monitor these resources.
While this has added lots of choice to the market it has made it difficult to tell which monitoring platform is the most effective.
Why Are Hyper-V Monitoring Tools Important?
Hyper-V monitoring tools are essential for managing and optimizing virtualized environments hosted on Microsoft’s Hyper-V platform. These tools provide critical insights into the performance, health, and efficiency of virtual machines (VMs) and their underlying infrastructure, enabling administrators to maintain smooth operations and preempt potential issues.
Here are some of the main reasons you would want to monitor Hyper-V:
- Performance Optimization: Monitoring tools help track resource utilization, including CPU, memory, disk, and network usage, across VMs and hosts. This data is vital for identifying bottlenecks and ensuring optimal performance. Over-provisioned or under-utilized resources can be adjusted to maximize efficiency.
- Proactive Problem Identification: These tools offer real-time alerts and detailed analytics to identify and resolve issues before they impact end-users. For instance, they can detect high latency, memory leaks, or failed VM migrations and notify administrators to take corrective action promptly.
- Capacity Planning: By analyzing usage trends, monitoring tools support long-term capacity planning. They help predict when additional resources will be required and ensure that the Hyper-V environment scales effectively to meet future demands.
- Enhanced Security: Hyper-V monitoring tools can detect unusual activity or unauthorized access, which is crucial for maintaining a secure environment. They track configuration changes, VM states, and access logs to prevent potential breaches.
- Compliance and Reporting: Many organizations need to adhere to strict compliance standards. Monitoring tools provide comprehensive logs and reports, simplifying audits and ensuring regulatory adherence.
- Disaster Recovery and Backup Management: These tools often integrate with backup systems to monitor the health of disaster recovery processes. They ensure that VMs are properly backed up and recoverable in case of failure.
In summary, Hyper-V monitoring tools are indispensable for managing virtualized environments efficiently. They not only enhance performance and security but also ensure scalability and compliance, making them a cornerstone of modern IT infrastructure management.
The best Microsoft Hyper-V Monitoring Tools
Our methodology for selecting Microsoft Hyper-V monitoring tools
We reviewed the market for Microsoft Hyper-V monitoring software and analyzed the options based on the following criteria:
- A system that can map all server and virtual machine relationships
- A resource management service for hypervisor activities
- A server monitor that watches the Hyper-V system resource usage
- A system that can predict oncoming Hyper-V resource demands
- A logging system that tracks Hyper-V behavior and performance
- A free tool or a paid system with a free trial for a no-cost assessment period or a money-back guarantee
- Paid tools that are worth the money given the services that they provide or free tools that are worth using
1. Paessler PRTG Network Monitor (FREE TRIAL)
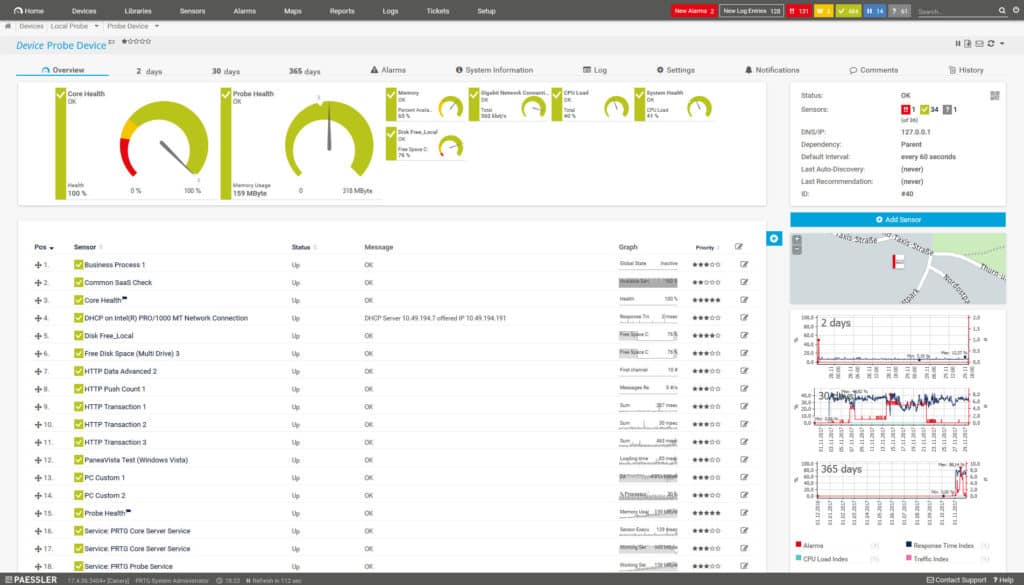
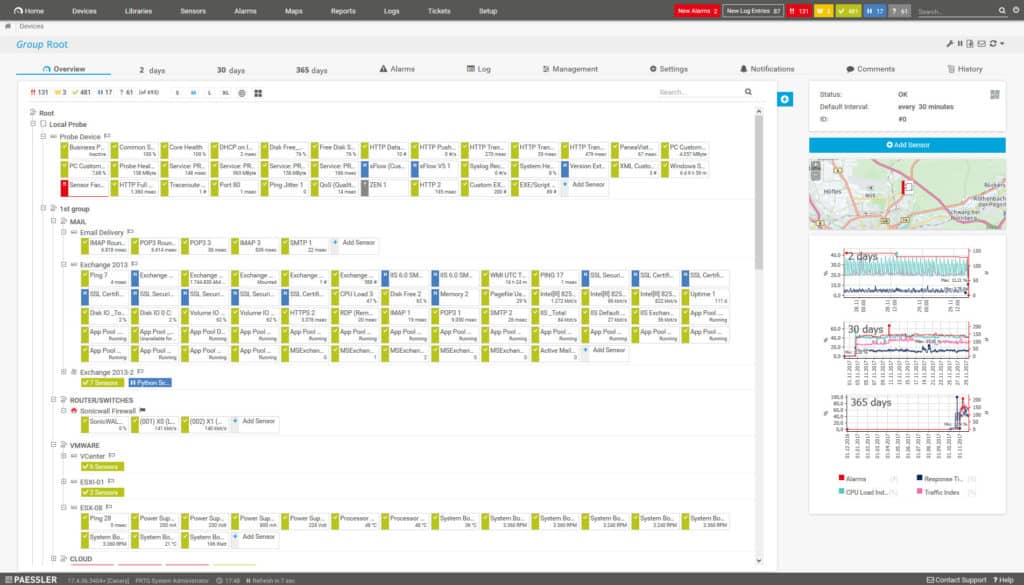
Next up we have PRTG Network Monitor, a tool that offers a streamlined virtual machine monitoring experience. PRTG Network Monitor can monitor the status, CPU usage, memory, and traffic of Hyper-V servers.
Key Features:
- Versatile Monitoring: Covers server, network, application, and Hyper-V monitoring with specialized sensors.
- Hyper-V Dedicated Sensors: Includes sensors specifically for Hyper-V host servers, VMs, and virtual storage.
- Customizable Alerts: Allows for threshold-based notifications to ensure timely response to performance issues.
Why do we recommend it?
Paessler PRTG Network Monitor is able to monitor so much more than just networks. This system-wide monitoring package also includes server and virtualization monitoring. It can monitor Hyper-V and also VMware, Citrix, and Nutanix systems. The package also includes cloud platform monitoring capabilities as well as physical server monitoring.
There are even sensors dedicated to monitoring Hyper-V servers, these include: Hyper-V Host Server Sensor, Hyper-V Virtual Machine Sensor, and Hyper-V Virtual Storage Sensor. With Hyper-V Host Sensor you can monitor CPU usage, system health, and network traffic of the host server. Similarly, with the Hyper-V Virtual Machine Sensor, you can monitor CPU usage, and read/write values of virtual machines.
PRTG Network Monitor has a notification system that can track key Hyper-V metrics using threshold values. The user sets a parameter for a metric like CPU usage and once a predefined value is exceeded an alert is generated. Alerts are sent via email, SMS, and push notifications. Being able to set performance thresholds gives you control over when you receive notifications.
Who is it recommended for?
PRTG can be tailored to only monitor the technologies that each buyer has because the package contains many sensors which can be turned on if needed or ignored. You don’t get charged for the sensors that you don’t activate. Small businesses will like PRTG because you don’t pay anything if you only use 100 sensors.
Pros:
- Tailored Monitoring: Enables customization with sensors that only activate as needed, optimizing resource usage.
- Comprehensive Coverage: Monitors a wide range of technologies, making it suitable for diverse IT environments.
- Freemium Model: Offers a free version with up to 100 sensors, appealing to small businesses with limited needs.
Cons:
- Initial Complexity: With its breadth of features, PRTG requires a commitment to learn and utilize effectively.
One of the biggest selling points of PRTG Network Monitor is that it is available free for up to 100 sensors. Paid versions of PRTG Network Monitor start at $1600 (£1,213) for 500 sensors to PRTG XL5 for unlimited sensors $60,000 (£45,524). There is also a 30-day free trial.
2. ManageEngine OpManager (FREE TRIAL)

ManageEngine OpManager is a monitoring package that covers networks and servers. Its capabilities include the ability to monitor Hyper-V virtualizations. It can also monitor VMWare, Citrix, and Nutanix hypervisors.
Key Features:
- Diverse Hypervisor Support: Monitors Hyper-V, VMWare, Citrix, and Nutanix environments.
- Resource Tracking: Offers detailed analysis of network and server resources affecting virtual machines.
- Automated Discovery: Automatically identifies and maps virtualized infrastructure upon setup.
Why do we recommend it?
ManageEngine OpManager is designed to monitor networks and servers, which includes Hyper-V and other virtualization systems in its remit. The system is able to correlate the demands of VM allocation on each virtual server and the physical server memory allocation to each virtualization instance. It tracks all server resource availability.
On its first start-up, OpManager will search the network and log all connected devices. It then searches through all servers on the network looking for hypervisors. When it discovers one, it requests access credentials. Once it is in, the monitor will map all of the virtual infrastructure including each virtual server down to its dependent virtual machines.
At this point, monitoring commences. The OpManager system makes regular scans of important resource issues, such as the memory, CPU, and storage access of the virtualization instance as a whole and per VM. The system dashboard shows a summary of all hypervisor activity with a click-through to details on each instance. Further drilling gets you information on individual VMs.
OpManager is a full server monitor, so it constantly checks on the host’s resources, looking out for shortages. All of the monitored statistics have performance thresholds placed on them. If a VM plays up or if a resource is running short, the system raises an alert. Those alerts can be forwarded as notifications by email or SMS to key staff.
The OpManager system will also watch over your Active Directory instances, your Web server and your mail server while also tracking the statuses of all of your network devices. All of this activity will be going on automatically while it keeps tracking your Hyper-V instances.
Who is it recommended for?
This tool offers a number of deployment options, which gives it a wide customer base. There is a Free edition of the tool but it doesn’t include Hyper-V monitoring. The paid edition’s baked package is priced to be accessible to small businesses and bigger corporations can get greater capacity for a higher price.
Pros:
- Comprehensive Server Monitoring: Tracks server health alongside virtual infrastructure for holistic insights.
- Alert Notifications: Configurable alerts for immediate awareness of performance issues via email or SMS.
- Flexible Deployment: Available in free and paid versions to suit different organizational sizes and needs.
Cons:
- Learning Curve: Feature-rich tool that requires time investment to master fully.
OpManager is a software package that installs on Windows Server and Linux. You can get it on a 30-day free trial.
3. Site24x7 Hyper-V Server Monitoring (FREE TRIAL)

Site24x7 Infrastructure is a cloud-based monitoring system for networks, servers, and applications and it has the capabilities for monitoring Hyper-V implementations. This tool is also able to monitor VMWare and Nutanix hypervisors and Docker containers.
Key Features:
- Cloud-Based Service: Monitors Hyper-V alongside VMWare and Nutanix from a unified cloud platform.
- Application Dependency Mapping: Identifies interdependencies within the application stack for root cause analysis.
- Performance Alerts: Sets thresholds for resource usage, alerting staff to potential issues via email or SMS.
Why do we recommend it?
Site24x7 Hyper-V Server Monitoring is integrated into a package of system-wide monitoring tools. The Site24x7 service can also monitor VMware, Nutanix, and containers. The bundle also provides physical server monitoring, network device monitoring, and traffic analysis. It can also watch over cloud platforms and track the performance of internet connections.
The Hyper-V monitoring capabilities need to be added to Site24x7 Infrastructure by activating a special “integration.” This is a plugin and it is free to use.
The Site24x7 Infrastructure system maps the hypervisor structure, showing the allocations of VMs to virtual servers and identifying the resource allocations of each. It also goes beneath the Hyper-V environment to track server resource usage. The Site24x7 Infrastructure package includes a process that identifies the application stack, showing the interdependencies of applications. This can be useful for tracing activity from a front-end interface through applications, such as Hyper-V, down to the server’s operating system for root cause analysis when problems arise.

The monitoring system defines performance thresholds on all resources and raises an alert if any of these get crossed by deteriorating conditions. The alerts can be forwarded to technicians by SMS message or email. This allows staff to get on with other tasks, knowing that Site24x7 is keeping an eye on normal Hyper-V activities.
Who is it recommended for?
Site24x7 s a close competitor to the Datadog system. However, this platform bundles all of its modules into combination packages. These are sized and priced for small businesses and the larger companies pay for capacity expansions. The platform is also available in a package for managed service providers.
Pros:
- Integrated Monitoring Solution: Combines server, network, and application monitoring for comprehensive oversight.
- Customizable Integration: Hyper-V monitoring can be added on to the main service for tailored infrastructure management.
- Scalable Packages: Designed to accommodate the needs of both small businesses and larger enterprises.
Cons:
- Complexity: A detailed platform that requires time to explore all features and capabilities.
Site24x7 Infrastructure is a subscription service that costs $9 per month when paid annually. You can get a 30-day free trial.
4. ManageEngine Applications Manager (FREE TRIAL)

ManageEngine Applications Manager covers more than 500 applications and Hyper-V is on that list. The tool tracks live performance statistics on the hypervisor continually, showing statuses on the screen that stretch back to a few hours of recent activity. Data is represented as summaries and is also interpreted into graphs for instant problem recognition.
Key Features:
- Comprehensive Coverage: Monitors over 500 applications, including Hyper-V, for holistic infrastructure visibility.
- Resource Correlation: Links server performance directly to virtual system operations for root cause analysis.
- Instant Alerts: Notifies administrators of performance issues through email or SMS for rapid response.
Why do we recommend it?
ManageEngine Applications Manager is another option to monitor virtualizations that the ManageEngine stable offers. This tool links underlying server resource demands up through services like hypervisors and applications such as databases through to user-facing systems. The application dependency maps this detection process creates identifies the root causes of performance problems.
The service includes an alert system that will send out notifications by email or SMS when problems arise. The tool covers resource issues, such as memory and CPU usage on the host and also examines transactions between servers and VMs.
Network interface activity is particularly important in virtualization and the Applications Manager logs activity both on virtual NICs and switches as well as the load on physical network adapters, including those designated as virtual switches. If you implemented teaming on your network adapters, Applications Monitor can spot that and gives both individual and group statistics for those interfaces.

The software for Applications Manager is available for installation on Windows Server and Linux. It is also able to monitor VMWare, Citrix, Red Hat Virtualization, and Kernel-based Virtual Machine. The system also has services that monitor containers.
Who is it recommended for?
ManageEngine offers a much better Free edition of this package than it does for OpManager. You can monitor five assets with this edition and it is able to monitor Hyper-V, VMware, Citrix, RHEV, and Oracle VM. The paid edition offers value for money and it also monitors all of those same virtualization systems.
Pros:
- Versatile Deployment: Available on both Windows Server and Linux, offering flexibility for diverse IT environments.
- Virtual and Physical Monitoring: Seamlessly correlates physical server resources with virtual system demands.
- Application Dependency Mapping: Identifies interdependencies to pinpoint performance bottlenecks effectively.
Cons:
- Feature Exploration: Requires time to fully leverage the extensive monitoring features and options available.
ManageEngine Applications Manager is available in three editions: Free, Professional, and Enterprise. The Free edition is limited to running only five monitors. The Enterprise edition is suitable for large businesses that require a large volume of monitoring activity. ManageEngine Offers Applications Manager on a 30-day free trial.
5. Datadog Hyper-V Monitoring
Datadog is a cloud-based infrastructure management service. The Datadog system is organized into modules and the Infrastructure unit oversees equipment, including network devices and servers. The monitor can be enhanced with “integrations.” There are more than 500 integrations available that add-on specialized monitoring functions. One of these creates the capability to monitor Hyper-V implementations.
Key Features:
- Cloud-Based Integration: Delivers Hyper-V monitoring as part of a comprehensive infrastructure management suite.
- Extensive Add-Ons: Features over 500 integrations for customized monitoring across various systems.
- Alert System: Provides timely notifications for critical memory and resource thresholds.
Why do we recommend it?
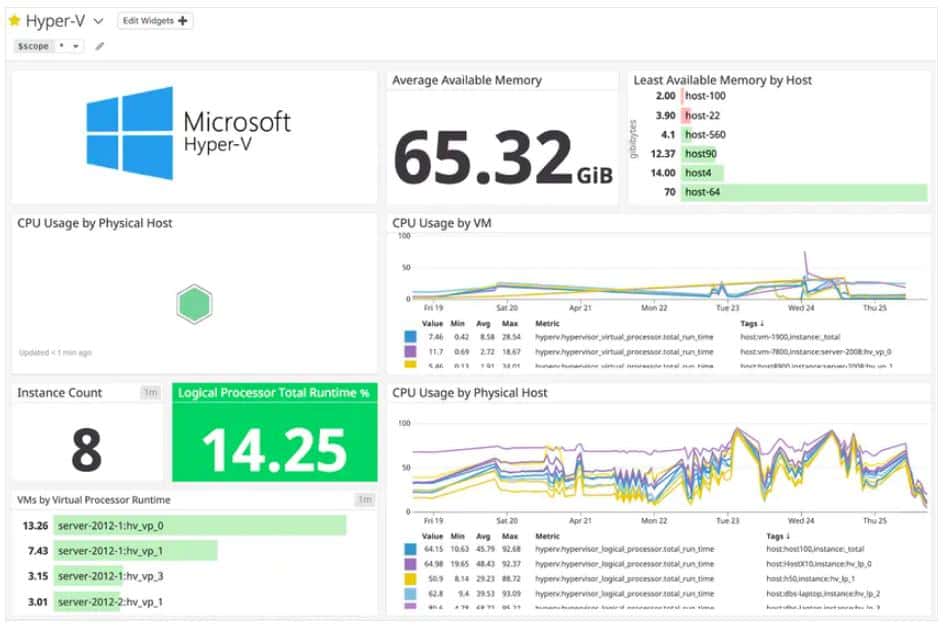
Datadog Hyper-V Monitoring is delivered from the cloud, so this is a good choice if you don’t want to host your monitoring software on your own servers. This is part of the Datadog Infrastructure package, which will also monitor services and applications, such as Web servers and databases.
The Datadog system is almost entirely resident on the cloud except for an agent program that must be installed on the server of the customer. In the case of the Hyper-V monitoring system, the agent will only install on Windows. The agent gathers information and uploads it to the Datadog server for processing. Once the data has been interpreted, it is displayed in the system dashboard in impressive color-coded graphs and charts.
The main benefit of the Datadog Hyper-V monitor is that it will alert you when a VM server is running out of memory. That gives you time to re-allocated VPMs to other servers and prevent the whole system from hanging or crashing completely.
The Datadog Infrastructure system is able to monitor physical servers as well as virtual environments. It can also monitor network devices and other equipment on the network.
Who is it recommended for?
This system is able to monitor multiple sites, so it is appealing for companies that centralize multi-site monitoring in one location. The system provides automated monitoring with performance expectation thresholds and alerts so it will maximize the productivity of technicians. Use the package to monitor cloud platforms and containers as well.
Pros:
- Flexible Monitoring: Capable of overseeing both physical and virtual infrastructure components.
- Memory Management Alerts: Helps prevent system overload by monitoring VM memory usage.
- Adaptable Infrastructure Monitoring: Suitable for multi-site companies needing centralized monitoring.
Cons:
- Limited Trial: A short 15-day trial period may not suffice for extensive testing of all features.
The Infrastructure module is offered in three plan levels: Free, Pro, and Enterprise. The Free version is very interesting for those with no budget, but its capabilities are limited. The Hyper-V integration costs nothing. The paid versions are charged for on a subscription basis per host on a monthly or annual cycle – the yearly payment scheme works out cheaper per month.
6. SolarWinds Virtualization Manager

First up on this list we have SolarWinds Virtualization Manager, a network monitoring tool designed for managing virtual resources. SolarWinds Virtualization Manager shows the health status of virtualized resources like Hyper-V through a color-coded dashboard. Virtual resources are categorized as Up, Down, Critical, Warning, Shutdown, Unreachable and External to tell you everything that is going on with your connected services.
Key Features:
- Comprehensive Monitoring: Tracks both on-premises and cloud-hosted virtual resources, including Hyper-V, VMware, and Nutanix AHV.
- Resource Optimization: Provides detailed insights into memory management and server resource allocation.
- Proactive Alerts: Features an advanced alert system for immediate notification of performance issues.
Why do we recommend it?
SolarWinds Virtualization Manager will monitor Hyper-V and can also watch over VMware vSphere, and Nutanix AHV systems. This tool provides more detailed tracking of Hyper-V than you would get with the company’s Server & Application Monitor package. You can slot this tool in with other SolarWinds systems, such as the Network Performance Monitor.
With SolarWinds Virtualization Manager you can track storage I/O performance. Tracking storage I/O performance allows you to address storage I/O contention, which is one of the most common issues with managing Hyper-V environments.
The main dashboard is fully customizable and can be used to view current alerts and warning messages so that you keep up-to-speed with developments in infrastructure performance. There is also a VM Sprawl dashboard that allows you to keep track of key metrics like CPU, memory, and storage. You can see how much total storage space you’ve used.

To keep your monitoring responsive, SolarWinds Virtualization Manager has an alerts system. The alerts system can monitor Hyper-V problems such as high CPU utilization and network latency to warn you about poor performance. Alerts come preconfigured out-of-the-box and can be viewed in one central dashboard view. This ensures that you don’t miss anything important and risk your VM going down.
One particularly useful feature offered by SolarWinds Virtualization Manager is capacity planning. SolarWinds Virtualization Manager can predict the CPU, memory and networking resources you will need for future Hyper-V Usage. Capacity planning forecasts are shown to you in the form of graphs so that you are completely aware of the resources you will need to support in future.

Who is it recommended for?
This is a solution that is suitable for a large business. Getting a separate package to monitor your Hyper-V system is going to be more expensive than buying a general system-wide monitoring package. So, your company would need to be heavily dependent on Hy-erV to justify the cost.
Pros:
- Versatile Compatibility: Supports a wide range of virtual environments for extensive monitoring capabilities.
- Customizable Dashboard: Allows for a tailored view of infrastructure health with color-coded status indicators.
- Capacity Planning: Offers predictive analysis for future resource needs, ensuring optimal performance.
Cons:
- Enterprise Focus: Primarily designed for large organizations, may be less suitable for smaller businesses due to cost.
SolarWinds Virtualization Manager starts at a price of $2,995 (£2,275). There is also a 30-day free trial available.
7. eG Enterprise
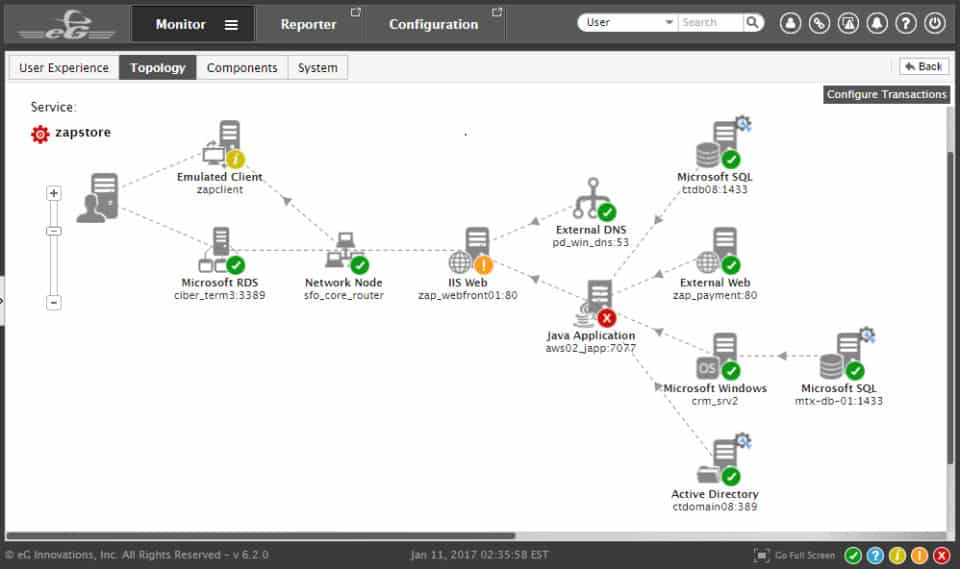
eG Enterprise is another highly-regarded web-based Hyper-V monitoring solution. eG Enterprise provides complete transparency over Hyper-V infrastructure with agent-based or agentless monitoring. The tool can measure the resource health, status, CPU usage, memory usage, disk usage, network usage, and I/O activity of servers. All of this information can be viewed through the performance dashboard in real-time.
Key Features:
- AI-Driven Diagnostics: Utilizes artificial intelligence for proactive performance tracking and root cause identification.
- Flexible Deployment: Offers both cloud and on-premises installation options to suit different organizational needs.
- Comprehensive Monitoring: Covers networks, servers, services, and applications, including extensive Hyper-V insights.
Why do we recommend it?
The eG Enterprise package monitors networks, servers, services, and applications and includes Hyper-V monitoring in its capabilities. It can also monitor VMware, Citrix, Nuatix, Red Hat, and Oracle virtualizations. This is a good tool for monitoring hybrid systems because it is equally capable of tracking services on cloud platforms.
However, what makes eG Enterprise a standout offering is its root-cause diagnostics capabilities. eG Enterprise uses pre-configured thresholds and auto-baselines for metrics to detect performance events as early as possible. Once an event has been detected, the automatic diagnosis technology pinpoints the root-cause.
The diagnostics feature looks through virtual machine-to-physical machine dependencies, application-to-application dependencies, and virtual machine maps to find out exactly what is going wrong. This saves the user lots of legwork that would otherwise be spent trying to find out what the problem is.
One advantage of eG Enterprise is that it can be deployed as an on-premises or cloud application. There are five main packages to choose from: easy evaluation, perpetual license, subscription, SaaS, and Audit Service. You’ll need to request a quote in order to view the price though.
Who is it recommended for?
This is a full system monitoring package and it is particularly suitable for mid-sized companies that have a lot of virtual environments. It can bridge cloud and on-premises systems and it also offers both cloud and on-premises deployment. The package is a little too pricey for small businesses.
Pros:
- Advanced Problem Solving: Employs auto-diagnosis to rapidly pinpoint issues across virtual and physical environments.
- Deployment Versatility: Suitable for medium to large-sized companies with complex, hybrid IT infrastructures.
- Detailed Analysis: Provides in-depth visibility into resource health and status for informed capacity planning.
Cons:
- Lack of Freeware: May not be accessible for very small environments or businesses without the budget for comprehensive monitoring solutions.
To view the price of the cloud-deployed SaaS package you need to contact the company directly. There is also a free trial that you can download here.
8. LogicMonitor
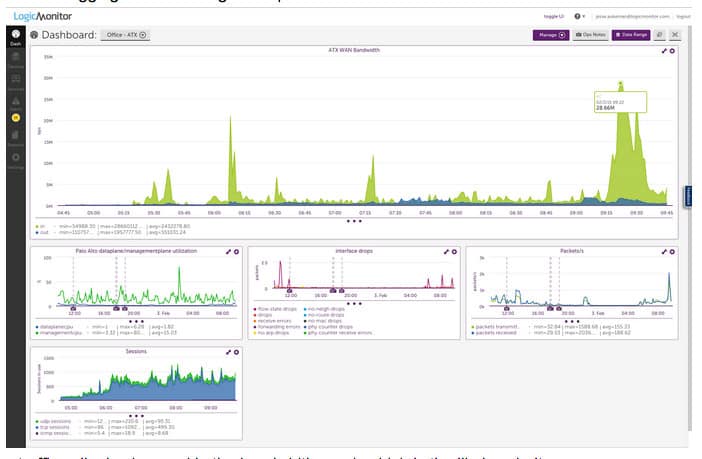
LogicMonitor is another well-respected Hyper-V monitoring solution that is very easy to configure. LogicMonitor automatically discovers Hyper-V virtual machines so that you can monitor performance metrics like CPU utilization, memory usage, and network throughput. You can view this information as graphs on the performance dashboard to identify emerging trends from a glimpse.
Key Features:
- Auto-Discovery: Instantly identifies Hyper-V virtual machines for immediate performance monitoring.
- Infrastructure Mapping: Visualizes virtual infrastructure relationships and dependencies for easier management.
- Server Health Tracking: Monitors underlying physical hardware to ensure virtual environments are well-supported.
Why do we recommend it?
LogicMonitor is a cloud-based system that is ideal for hybrid systems because it monitors both on-premises assets and cloud services. The capabilities of this system include monitoring for Hyper-V, VMware, and Nutanix virtualization. It can also monitor virtual networks if they are formed by Cisco SD-WAN and it will track containers as well.
However, LogicMonitor’s monitoring capabilities go well beyond the virtual environments and can also handle server and chassis monitoring as well. The tool automatically discovers the hardware that is being used to run your Hyper-V infrastructure. After the hardware has been found, the hardware health is monitored by looking at power supply, temperature, and fan speed. Keeping track of physical hardware ensures that your virtual infrastructure is adequately supported.

There is also a trigger-based alerts system to keep track of bad performance when it occurs. These triggers are set by Microsoft engineering to ensure that you have the best monitoring setup for monitoring Hyper-V environments. For example, you will receive an alert if virtual memory usage reaches a point that could cause performance problems.
Who is it recommended for?
This package is very strong at monitoring virtual systems, which could be hosted on-premises, on the cloud, or implemented as network virtualization. So, hyper-converged systems would particularly benefit from this monitoring package. The LogicMonitor system is hosted on the cloud, so it can monitor your entire infrastructure across sites.
Pros:
- Cloud-Based Flexibility: Ideal for monitoring hybrid systems, offering insights across on-premises and cloud assets.
- Hardware Monitoring: Extends visibility to physical server conditions, enhancing support for virtual infrastructure.
- Trigger-Based Alerts: Customized alerts based on Microsoft engineering standards ensure optimal Hyper-V monitoring.
Cons:
- Trial Duration: A longer trial period could provide more comprehensive evaluation for potential users.
LogicMonitor is a subscription service that is delivered from the cloud. There are two plans for the system: Pro and Enterprise. The Pro edition includes all of the monitoring services that you need for networks, servers, services, applications, and cloud platforms. The Enterprise plan adds on AIOps and configuration management. You can access a 14-day free trial online to assess the LogicMonitor platform.
9. Veeam One
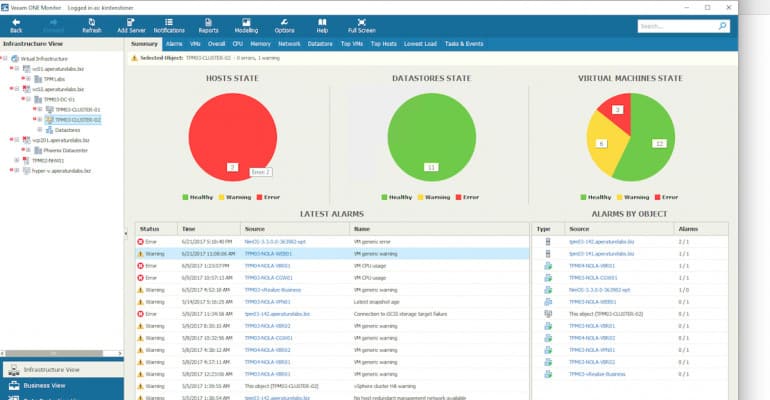
Veeam One is a performance monitoring platform for Windows that offers a reliable Hyper-V monitoring experience. Veeam One monitors your network in real-time to track the performance of Microsoft Hyper-V and VMware vSphere infrastructure. This tool monitors the status, performance, and availability of virtual infrastructure to find if there are any virtual machine performance issues.
Key Features:
- Comprehensive Monitoring: Supports both Microsoft Hyper-V and VMware vSphere, offering a holistic view of virtual infrastructure performance.
- Intelligent Diagnostics: Features over 200 preset alarms and automated root-cause analysis for proactive issue resolution.
- Capacity Planning: Provides usage forecasts and capacity planning tools to ensure resources meet future demands.
Why do we recommend it?
Veeam One is a backup and recovery service that also offers system monitoring in its higher plans. The services that this tool can back up and monitor include Hyper-V, VMware, Nutanix, and cloud services on AWS, Azure, and Google Cloud Platform. Many other systems, such as databases, can be protected with this package.
The Veeam One platform comes with over 200 preset alarms to keep you updated on changes in your virtual infrastructure. There is an intelligent diagnostics feature that works alongside alerts to identify the root-cause of performance issues. The user can even implement automated Remediation Actions which configure automatic responses once certain alerts have been raised. The intelligent diagnostics of Veeam One make it ideal for larger enterprises looking to automate Hyper-V monitoring processes.
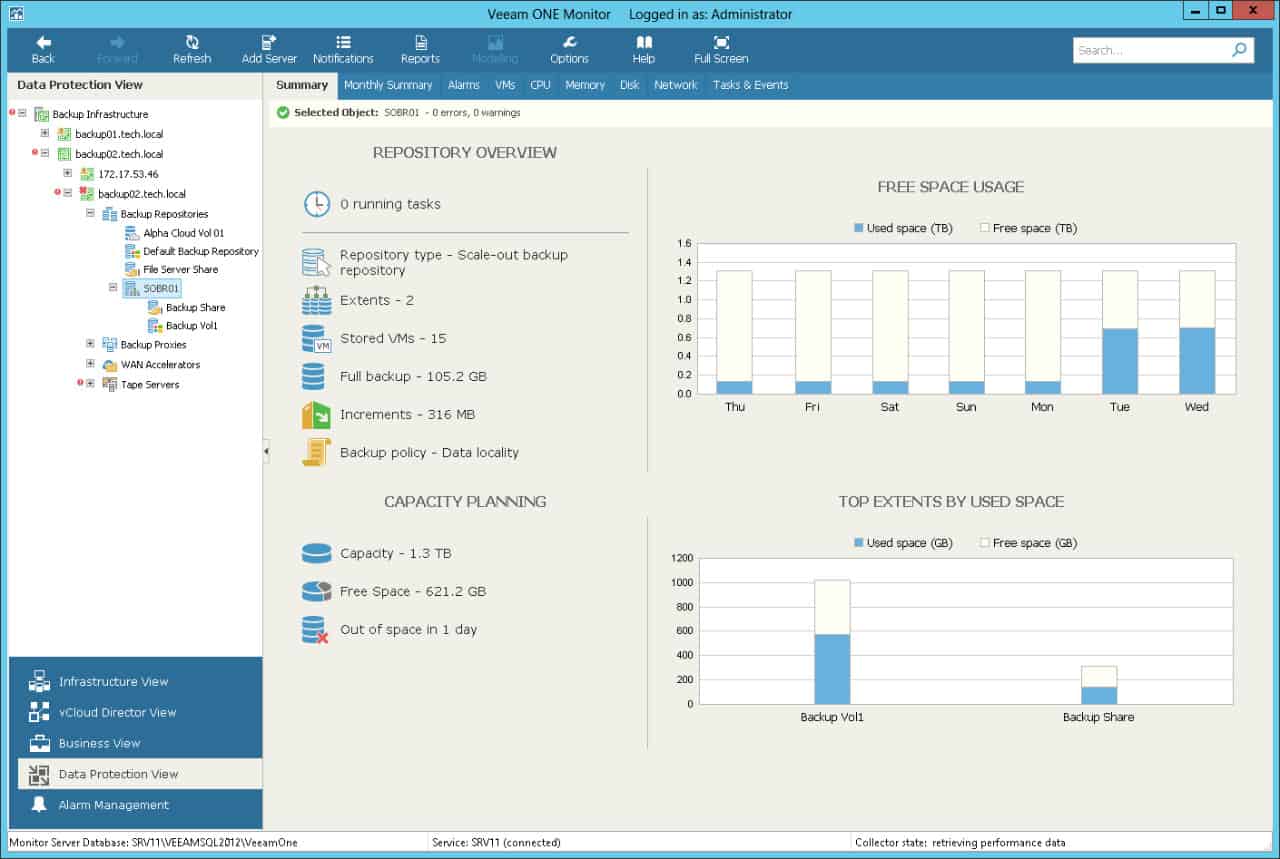
Customizable reports help to build up the depth of your Hyper-V monitoring so that you develop more sophisticated insights. Veeam One allows you to create reports based on CPU, memory, network, and disk metrics data. However, you can choose your own configurations so that you see all the information you’ll need within the report.
You aren’t limited to monitoring up-to-the-minute usage data either; you can forecast future usage as well. Veeam One forecasts your usage trends and helps you to implement capacity planning so that your usage doesn’t exceed the available space of resources. This ensures that your organization stays operational.
Who is it recommended for?
This system provides important backup services and it is probably best suited to mid-sized businesses. You need to look at the two higher plans to get monitoring for Hyper-V as well as the back system. Veeam also produces a package for small businesses – that is entirely a backup and recovery service.
Pros:
- Versatile Reporting: Enables customization of reports with detailed metrics on CPU, memory, network, and disk usage.
- Automated Remediation: Offers the ability to configure automatic responses to specific alerts, enhancing system reliability.
- Extensive Monitoring: Tracks the performance, status, and availability of virtual infrastructure effectively.
Cons:
- Interface Limitations: May not be the best choice for managing a vast number of VMs due to interface design.
There are two versions of Veeam One available: the Complete Edition and the Community Edition. The Complete Edition is the fully-featured product and the Community Edition is a limited version that is available for free. You can download a free trial version of Veeam One via this link here.
10. Dynatrace
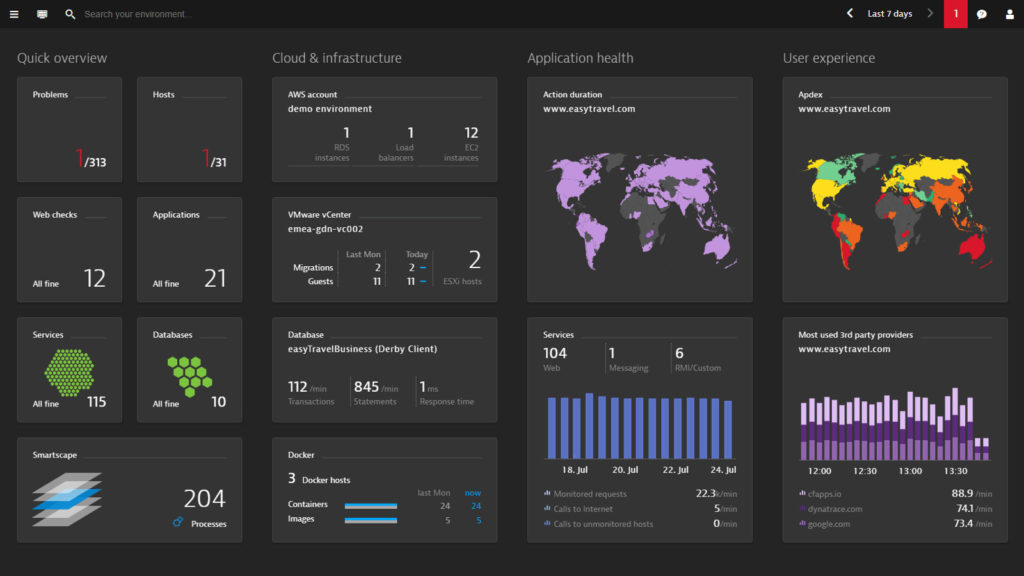
Dynatrace is an advanced APM tool with Hyper-V monitoring capabilities. With this tool you can see an interactive map of your Hyper-V resources. The map displays how your virtual and physical resources connect to each other. Applications, Services, Processes, Hosts, and Data Centers are all plotted on the map for you to navigate giving you a top-down perspective of your entire data center.
Key Features:
- Dynamic Mapping: Offers live dependency mapping for a comprehensive understanding of how virtual and physical resources interact.
- Advanced Performance Tracking: Provides detailed metrics for Hyper-V, including read/write operations, throughput, and IOPs.
- Automatic Updates: Automatically adjusts dashboards and configurations to include new infrastructure, reducing manual efforts.
Why do we recommend it?
Dynatrace offers multiple units on its cloud platform for system monitoring and protection. Its Infrastructure Monitoring unit provides performance monitoring for Hyper-V and other on-premises virtualization systems, such as Hyper-V, Red Hat, and Oracle Virtual systems and many flavors of JVM services. This tool also monitors cloud services and is good for hybrid environments.
When it comes to monitoring Hyper-V metrics, Dynatrace offers metrics such as read/write, throughput, and IOPs. If a performance issue emerges then Dynatrace automatically starts to analyze and locate the root cause. The tool will be able to identify whether the cause is at the virtual or application layer.
The Dynatrace platform is also easy to use because it stays up-to-date when you add new infrastructure. Dashboards and configurations are designed to automatically add new infrastructure so that you don’t have to waste time with manual configurations whenever you add a new device.
Who is it recommended for?
Dynatrace is able to monitor very complicated systems, thanks to its library of 650 integrations. It is particularly suited to monitoring extensively virtualized systems. This system has an unusual charge rate that is levied per hour per host. There is a higher plan that adds on distributed tracing for Web applications and microservices.
Pros:
- Cloud Integration: Ideal for monitoring complex, hybrid environments with support for a wide array of integrations.
- Root Cause Analysis: Automatically identifies the source of performance issues, whether at the virtual layer or application level.
- User-friendly: Streamlines monitoring processes with auto-discovery and updates, making system management more efficient.
Cons:
- Pricing: While offering extensive features, pricing may be prohibitive for smaller businesses.
Price-wise Dynatrace has a number of different options. There is a SaaS Pay-as-you-go model which starts from a price of $0.04 (£0.032) per host/hour. There is also an enterprise version and a Web-Scale version available as an on-premises or SaaS installation. In order to view the price of Dynatrace you’ll need to contact the sales team. You can download the 15-day free trial of Dynatrace.
11. Turbonomic
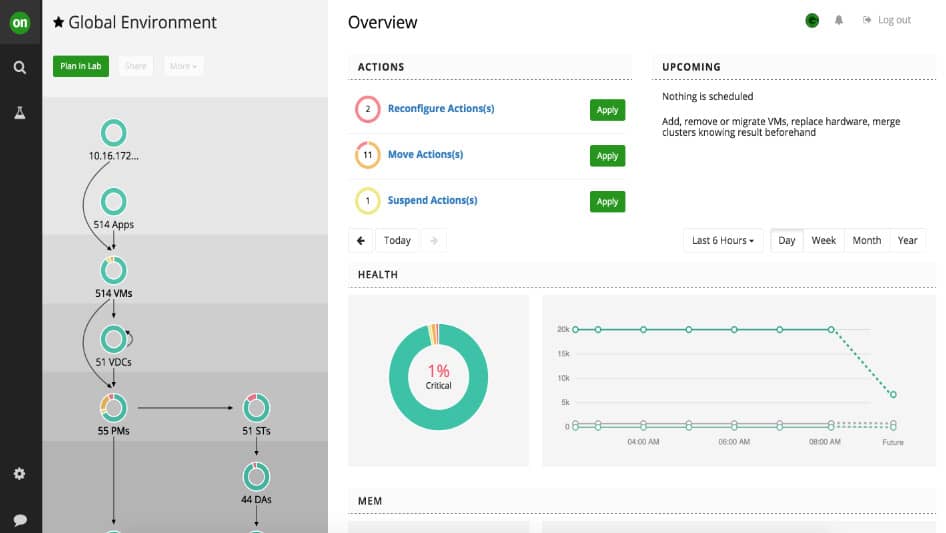
Turbonomic is a virtualization management tool that can monitor Hyper-V, vSphere, KVM, and PowerVM. The tool comes with integrations for Microsoft Hyper-V, VMware, KVM, Redhat Enterprise Linux, IBM Power VM, and Citrix. The storage and network usage of Hyper-V resources can be monitored to prevent poor performance. All of the dashboards that this information is shown on can easily be copied and shared with other key decision makers.
Key Features:
- Multi-Virtualization Support: Monitors a variety of virtualization platforms, including Hyper-V, VMware, KVM, and PowerVM.
- Intelligent Capacity Planning: Utilizes simulations to guide resource allocation and optimize virtual machine usage.
- Management Options: Offers tools for capacity planning and managing expansions, enhancing infrastructure scalability.
Why do we recommend it?
IBM Turbonomic focuses on the management of cloud accounts. The value of this system is its monitoring of cloud accounts with the aim of creating cost savings. This is achieved by spotting overprovisioned services and it also keeps precise records of metered service usage. It also manages memory allocation and VM-to-server mapping for on-premises virtualizations.
One interesting feature offered by Turbonomic is that of capacity planning. The platform simulates the environmental changes of new workloads to see if resource allocation can sustain the intended usage. The platform can then decide whether to limit or provision more capacity. The great thing about this is that it reduces the amount of time you need to spend provisioning virtual resources and optimizing the usage of virtual machines.
Who is it recommended for?
This package is closely focused on cloud systems. So, you probably wouldn’t use this package just to manage your on-premises systems, such as Hyper-V. Rather, you would get this tool if you have a lot of cloud expenditure and run a hybrid environment that includes your Hyper-V system on your site.
Pros:
- Cloud-focused: Particularly useful for organizations with significant cloud expenditures and hybrid environments.
- Resource Optimization: Helps in dynamically adjusting resources to meet workload demands, improving efficiency.
- Visualization: Provides clear visual mappings to aid in system management and decision-making processes.
Cons:
- Complexity: May require a learning curve to fully utilize all features, especially in large or complex networks.
Turbonomic may not be as intuitive as some of the other tools on this list but it provides the core monitoring features to track and manage a range of Hyper-V resources. To view a quote for Turbonomic you will need to contact the sales team directly. There is also a 30-day free trial available here.
12. EventSentry
Finally, we have EventSentry. EventSentry is a network monitoring tool that can monitor Hyper-V hosts and the virtual machines running inside them. With EventSentry the user can monitor the health of connected Hyper-V systems. For instance, you can monitor virtual disk space, event logs, services, and performance.
Key Features:
- Integrated Monitoring: Combines security and performance monitoring for Hyper-V hosts and virtual machines.
- Real-time Analysis: Tracks the health of Hyper-V systems, including virtual disk space, event logs, and performance metrics.
- Historical Data: Offers the capability to conduct historical analysis for trend identification and forecasting.
Why do we recommend it?
EventSentry is a SIEM service that provides security monitoring for cloud platforms and on-premises systems. Simultaneously, this log searching tool will implement performance monitoring. This covers network devices and servers plus network traffic analysis and Active directory monitoring. You can get Hyper-V monitored with the tool as well.
The performance and disk space monitoring potential of EventSentry is this product’s greatest asset. You can monitor the performance of Hyper-V environments in real-time and historical analysis. With regard to disk space monitoring, you can monitor a host’s disk space or individual directories.
Who is it recommended for?
This is an on-premises package that will appeal to businesses of all sizes but it is probably best suited to mid-sized organizations. The system has scaleable pricing but it is probably a little above the budget of small businesses. A big advantage of the EventSentry system is that is combines performance and security monitoring, which is a great money saver.
Pros:
- SIEM Integration: Blends network monitoring with security insights for a comprehensive oversight of Hyper-V environments.
- Disk Space Monitoring: Enables detailed tracking of host and directory disk space to preemptively address storage issues.
- Adaptable: Suitable for businesses of varying sizes, with scalable pricing to match the scope of monitoring needs.
Cons:
- Target Audience: Best suited for mid-sized organizations, potentially out of reach for smaller businesses due to pricing.
EventSentry is competitively priced for organizations of all sizes. The cost of a full license for one Windows Server or Workstation is $85 (£66) for the first year and $15.30 (£11.99) for every year after that. There is also a free trial version that you can download here.
Choosing a Hyper-V Monitoring Tool
For environments that use Microsoft Hyper-V, Hyper-V monitoring tools are essential for monitoring resource performance. Using a Hyper-V monitoring tool helps to keep virtual resources maintained and protected from performance degradation. Tools like PRTG Network Monitor, and ManageEngine OpManager offer the best Hyper-V monitoring experience for enterprise users.
The free version of PRTG Network Monitor is also a good alternative for those smaller organizations who can’t afford a more costly tool. If you stick with PRTG Network Monitor then you can simply upgrade to upscale with your virtual infrastructure to keep on top of Hyper-V servers.
Monitoring virtual resources as closely as you would physical machines is the key to keeping network resources like Microsoft Hyper-V well-maintained.
Hyper-V Monitoring FAQs
Can Hyper-V help with memory ballooning?
Hyper-V does implement memory ballooning. It is better known as Dynamic Memory and Smart Paging. In order to activate the technique, you need to check the Enable Dynamic Memory box in the Memory settings of the VM.
Can I use Hyper-V to manage virtual network adapters?
The allocation of physical NICs to virtual network adapters is fundamental to the creation of VMs and defining a virtual network adapter is a step in the creation of a virtual machine in the Hyper-V management interface.
