
Application monitoring focuses on maintaining the performance, reliability, and security of business-critical systems. In today’s digital environments, where applications underpin daily operations, even minor performance issues or outages can have a direct impact on user experience, revenue, and organizational reputation. For this reason, consistent monitoring is not optional but a core operational requirement.
At a practical level, application monitoring involves tracking metrics such as response times, resource utilization, error rates, and overall user experience. This level of visibility enables IT teams to identify anomalies early and resolve issues before they develop into larger problems. It also generates useful insights into system behavior and user activity, supporting capacity planning and long-term performance optimization.
Establishing an effective monitoring strategy goes beyond basic visibility. It requires defining meaningful key performance indicators (KPIs), selecting tools that align with the organization’s infrastructure, and implementing automated alerting to ensure timely responses to emerging issues.
In this guide, we examine these elements in detail, outlining best practices for building and maintaining a reliable monitoring framework. Whether starting from scratch or refining an existing setup, the aim is to help organizations improve application stability, support compliance and security requirements, and deliver a consistent, high-quality user experience.
What is an application?
It seems fatuous to start by explaining what an application is. You know what applications you have – they are the software packages that your users access to do their jobs. However, the word “application” is vague. Remember that protocols are also known as applications, such as the File Transfer Protocol (FTP), the Simple Mail Transfer Protocol (SMTP), and Kerberos. So what does an application monitoring system monitor, software packages, or network services?
Even the software applications that you install have many layers. Is a Web server an application or is it part of the infrastructure? A database supports the Web pages that users access. The database management system (DBMS) is an application, and so is HTTP, which delivers communications between applications. However, HTTP forms part of the communication system, so maybe that’s part of the infrastructure.
Whether an element of a system is defined as an application or infrastructure, it still needs to be monitored.
Application dependencies
Starting from a user-accessed system, you search for all of its components in the package and document them. You then look at each of those elements, which are mostly applications in themselves, and look at their components. This process results in the creation of a hierarchy of applications, down to services, and then further down to system resources.
An application monitor needs information on the components of an application and how they work together. Automated tools can identify that hierarchy automatically. Without an application dependency map, it is impossible to correctly monitor the activities of an application and spot when resources are running low.
An application performance problem is more likely to be the fault of one of the systems that support the user-facing application than that application itself.
The application dependency map provides a path to search when a front-end application’s performance becomes impaired. This record cuts out hours of research and will enable the real cause of an application’s problems. This task is called root cause analysis and a good application monitor will do all of that work for you.
Application Monitoring Best Practices KeypointUse an automated monitoring tool that will independently track and record all supporting systems and draw an application dependency map. This will provide all of your root cause analysis when problems arise. |
Platform compatibility
Cloud-based systems are rapidly taking over from in-house servers as the hosts of applications. This situation complicates monitoring tasks because services are often integrated into the platform in a protected manner that prevents tampering but also blocks monitoring efforts.
Many businesses have applications running on cloud platforms while also operating applications on their servers. This is known as a hybrid environment and requires extensive data transfers back and forth between cooperating applications that need to share information. Applications can span a platform with files managed on one system but accessed by tools delivered from a separate SaaS package operated by a different provider.
Cloud platforms include reporting services. These are built into AWS, Google Cloud Platform, and Azure and are free to use. However, siloed reporting won’t give you the benefits that cumulative statistics can bring. You need an application monitor that can gather performance data from many different platforms, correlate it, summarize it, and analyze it.
As a minimum, you need an application monitoring system that can access all of the platforms that you currently use. However, getting service with the widest possible capabilities gives you the freedom to choose other platforms to support your users in the future without having to change your monitoring system.
Application Monitoring Best Practices KeypointChoose a monitoring tool that can operate in hybrid environments and has a long list of integrations to cover as many platforms as possible. |
Delivery technologies
Cloud, on-premises, and virtual systems offer a range of delivery options. Packaging a module together with all of the services that it needs in a container makes delivery easier because the provider doesn’t have to issue extensive installation instructions to the buyer and user of these functions.
Containers offer strong security against tampering because it isn’t possible to control the operations of the carried function by infecting the operating system of the host. However, they also complicate monitoring because each instance is like a mini server and so has to be examined for performance statistics individually. A service that can aggregate activity metrics across multiple containers saves time because it removes the need to manually unify data from multiple sources.
On-premises hypervisors and the cross-platform equivalent, hyperconverged environments, are other technologies that can block access from the host’s operating system into the application’s functions. Thus, integration with each of these virtual platforms also needs to be built into your chosen application monitoring system.
Another benefit of virtual hosting for systems is that it enables the trialing of new software without the dangers of clashes in the required system settings for each. It is possible to isolate a new service with virtualization to buy time for security assessments before integrating the new product into your system. VMs and containers also allow different versions of the same software or rival systems to be tested and evaluated in parallel for performance assessment.
Containers are useful for testing in development environments and for onboarding in operations scenarios and application monitoring plays an important role in both of these situations.
Application Monitoring Best Practices KeypointLook for application monitoring tools that include the capability to query containers and virtualizations. |
Serverless systems
Cloud hosting has many formats and can be provided without a full allocation of virtual server space. Serverless systems offer efficient hosting options because the user only gets charged for the space that is used and doesn’t require CPU capacity to be reserved and paid for even when it is not in use.
Modules that are supported by serverless hosting are known as microservices and they can be delivered to developers through frameworks, libraries, APIs, or developer toolkits. The proliferation of these prewritten plug-in functions speeds up and standardizes the development of Web applications but they complicate monitoring. Without the presence of a server package, there is no adjacent space to run associated statistics extraction programs.
The difficulty of monitoring microservices was resolved by the creation of telemetry standards. These are messaging protocols that developers of Web applications can use to produce activity reporting log messages. By following these standards, application monitoring packages can provide the same level of activity tracking and performance monitoring as traditional application monitoring software packages.
The technique of monitoring microservices is called distributed tracing and there are several standards for messaging within this framework. The three main options are called OpenTracing, OpenCensus, and OpenTelemetry. The third of these was created by a merger of the first two. However, there are still many systems in circulation that follow either the OpenTracing or OpenCensus systems. Fortunately, OpenTelemetry is backward compatible, so if you have an application monitor that includes capabilities in that protocol, you also have the other two.
The location of microservices is obscured by their method of delivery. A developer can access an entire package by inserting just a line in the program. The functions that are called by that line need to be identified and monitored as well as the calling program. Application discovery supported by distributed tracing will provide a full dependency map that not only identifies the microservices behind APIs and platforms but the layers of serverless-hosted functions that compose those microservices.
Application Monitoring Best Practices KeypointDistributed tracing is becoming increasingly important for application monitoring, particularly for Web applications. Distributed tracing also gives you the capability to monitor the activities of mobile apps, which are usually backed by microservices. |
Setting up application monitoring
Even application monitoring tools that include autodiscovery need a starting point and that includes the granting of access to the platform that hosts the user-facing application that is to be explored.
The automation in an application tool lies with a system of alerts that are triggered by performance thresholds. While most application monitors are shipped with pre-set alert rules, more can be added and existing threshold levels can be adjusted. An example of the type of events that could trip an alert is the available capacity of a CPU or memory utilization.
Rather than waiting for a resource to be fully used up, a threshold would be set at a warning level, such as 75 percent, which gives notified technicians time to take action before the resource is completely exhausted.
It is also possible to create composite thresholds that will only trigger an alert if all conditions of the rule are met.
Alerts are shown in the system console. However, unattended automation can only be safely implemented if there is a mechanism to send those alerts outside the system to messaging services to which technicians routinely make access, such as email, SMS, collaboration system, or service desk ticket routing service.
Application Monitoring Best Practices KeypointAlert thresholds and notification routines need to be set up in the application monitoring system console. |
Automated responses
Some application monitors include automated responses. These need to be set up before they are active. Responses are written as playbooks in the form of an alert condition and an associated action.
The implementation of automatic actions should be conducted with caution as binary decisions lack subtlety or judgment and can render a system unusable. For example, a threshold for user access capacity could be calibrated at too low a level and automatically log all users off the system. Such a tool would be counterproductive to the aims of installing the application monitor, which is to improve efficiency.
Application Monitoring Best Practices KeypointResponse automation can be set up as actions associated with triggers but should be used with caution. |
Automated Application Monitors
The central rule in the best practices of application monitoring is to get a competent tool to perform the task for you.
What should you look for in an application monitor?
We reviewed the market for application monitoring systems and analyzed tools based on the following criteria:
- Automated discovery
- Application dependency mapping
- Hybrid system monitoring
- Distributed tracing
- Alerts
- A free trial or a demo that provides a no-cost assessment period
- Value for money from s comprehensive monitoring tool that is offered at a fair price
With these selection criteria in mind, we identified flexible application monitoring services that can interface to a range of platforms.
Here is our list of the best application monitoring systems:
- AdRem NetCrunch EDITOR’S CHOICE Improves the security and performance of applications across cloud, web, database, and Windows environments. Download a 30-day free trial.
- ManageEngine Applications Manager (FREE TRIAL)This software package provides application dependency mapping, distributed tracing, code profiling, and synthetic and real user monitoring. Available for Windows Server, Linux, AWS, and Azure. Start a 30-day free trial.
- Site24x7 Application Performance Monitoring (FREE TRIAL) A cloud-based system that implements application monitoring alongside network and server monitoring. Start the 30-day free trial.
- Datadog APM A SaaS APM with application dependency mapping, root cause analysis, and distributed tracing.
- Dynatrace Full-stack Monitoring A cloud-based service that uses AI in its infrastructure and application monitoring.
- AppOptics Infrastructure and application monitoring from a SaaS package that provides dependency mapping, distributed tracing, and root cause analysis.
You can read more about each of these options in the following sections.
1. AdRem NetCrunch (FREE TRIAL)

AdRem NetCrunch is a comprehensive tool for monitoring web services, APIs, SSL certificates, cloud services, SQL database, Windows applications, and more. It comes with a robust suite of sensors to monitor the finer metrics like response times and URL queries, so you have better control and visibility into their performance.
Key Features:
- Visualization: Comes with dashboards and maps to provide a visual idea of your applications’ performance.
- Rendering: Simulates your scripts in real-world browsers to give you a comprehensive idea of the how websites can look.
- File Metrics: Keeps an eye out for changes to your remote files and automatically checks their contents.
- Cloud Services: Monitors applications that run on AWS and Azure.
- SSL Certificate Sensor: Sends alerts when there are issues related to SSL/TLS certificates.
Why do we recommend it?
For its broad coverage. You can use this tool to monitor different metrics across applications and services that are hosted on the cloud, on your Windows environments, and in databases. What we love in particular is NetCrunch’s sensors that monitor aspects like response time, rendering, HTTP header content, and more. These sensors can also be customized to monitor the aspects that matter to you. Such coverage and flexibility can come in handy for monitoring almost any kind of application.
Who is it recommended for?
NetCrunch is a good choice for web administrators, system administrators, IT operations teams, and website owners who are responsible for ensuring the optimal performance of applications and services. It can also work well for MSPs who have to manage the applications of multiple clients.
Pros:
- Unified Visibility: Offers complete visibility into your environments
- Correlation: Its visualizations correlate diverse data for better insights
- Agentless Architecture: No installation required on devices
- Predefined Templates: Supports over 680 monitoring targets out of the box
Cons:
- Learning Curve: Some advanced customization may involve a learning curve
NetCrunch is priced at $3,600 for the Professional edition and $5,950 for the Enterprise edition. For large-scale mixed environments, the cost starts at $22,450. Download a 30-day free trial.
EDITOR'S CHOICE
Our editors have picked NetCrunch as the best tool for application monitoring for its sensor-based approach to monitoring web services and APIs. Besides providing considerable flexibility in deciding what you want to monitor, you can also have better insights into the specific metrics and how they correlate with the wider environment. Such detailed information can speed up troubleshooting and improve decision-making. Its visualizations are another plus as they break down the data and make it easy to understand. Its wide coverage is also another big bonus.
Download: 30-day FREE Trial
Official Site: https://www.adremsoft.com/netcrunch/download/
OS: Windows Server - Self-hosted server
2. ManageEngine Applications Manager (FREE TRIAL)
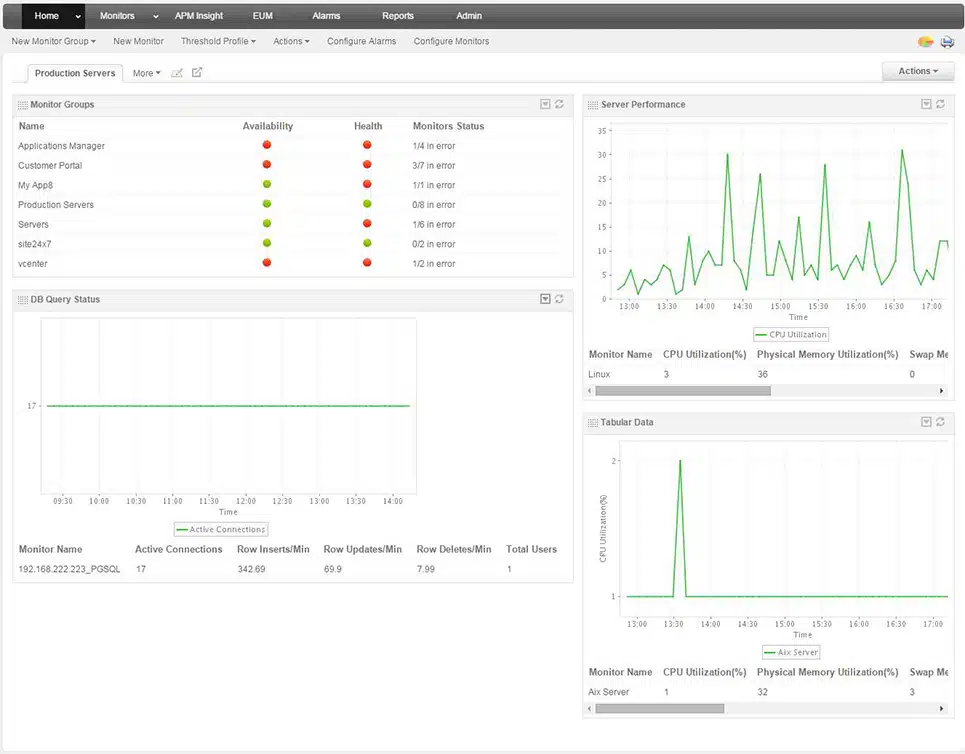
ManageEngine Applications Manager is a software package that provides cutting-edge distributed tracing and code profiling in addition to standard application resource usage monitoring. This package is able to discover all of your applications and track their supporting components. With this investigation, the Applications Manager will build up an applications dependency map that is constantly updated.
Key Features:
- Application Discovery: Automatically identifies all applications and their supporting components.
- Application Dependency Mapping: Continuously updates maps of application dependencies.
- Code Profiling: Analyzes code to optimize performance and identify issues.
- Distributed Tracing: Tracks application requests across services to pinpoint performance bottlenecks.
Why do we recommend it?
ManageEngine Applications Manager excels in offering robust application discovery, dependency mapping, and real-time performance monitoring, making it a strong contender for managing complex applications and ensuring their optimal performance.
After tracking down all of the components of your applications, the ManageEngine system provides activity monitoring through straightforward resource monitoring plus distributed tracing. These tools include performance expectation thresholds that can be adjusted. When triggered they raise alerts that let you know about evolving problems.
Live Web applications can be examined and tested with real user monitoring and synthetic monitoring. The system is also able to test and monitor mobile apps.
Who is it recommended for?
This tool is ideal for IT teams and businesses looking for comprehensive application monitoring solutions, especially those needing to manage both web and mobile applications with advanced testing and profiling capabilities.
Pros:
- Comprehensive Testing Utilities: Includes tools for testing web applications and mobile apps.
- Real-Time Monitoring: Offers live performance monitoring with customizable alerts.
- Flexible Deployment: Can be deployed on-site, or on AWS and Azure cloud accounts.
- Free and Multi-Site Editions: Provides a free version for small-scale use and paid multi-site versions.
Cons:
- Not SaaS: Requires installation on Windows Server or Linux, unlike SaaS solutions that offer easier scalability and maintenance.
ManageEngine Applications Manager is a software package that you can install on Windows Server or Linux. You can also access the system as a service on AWS and Azure. There is a free edition of the package that is limited to monitoring five applications. The paid options include single-site and multi-site versions. You can get either of the paid editions on a 30-day free trial.
3. Site24x7 Application Performance Monitoring (FREE TRIAL)
Site24x7 cloud platform that offers service in bundles. All of the bundles offered by the platform include the Site24x7 Application Performance Monitoring module. The APM connects through to the server and network monitoring modules to track the performance of the full stack.
Key Features:
- Code Profiling: Analyzes code execution to optimize performance and identify issues.
- Cloud Platform Monitoring: Monitors applications on cloud platforms as well as on-premises.
- Distributed Tracing: Tracks the activity of each application module across the stack.
- Root Cause Analysis: Pinpoints the source of issues for faster resolution.
Why do we recommend it?
Site24x7 APM provides comprehensive performance monitoring with seamless integration across server and network modules, ensuring full-stack visibility. Its robust distributed tracing and root cause analysis make it invaluable for maintaining application performance.
The Site24x7 system is able to identify application dependencies, tracking down all functions that contribute to the successful delivery of an application. As an application runs, the monitor implements distributed tracing to track the activity of each module. When functions written in plain-text languages, such as Python or PHP are reached, the monitor steps through each line of code as it runs.
Who is it recommended for?
This tool is recommended for organizations needing a cloud-based monitoring solution that offers end-to-end visibility, especially those running applications on cloud platforms and seeking detailed code-level insights.
Pros:
- Full Stack Observability: Bundled with network and server monitoring for comprehensive performance tracking.
- Serverless Function Tracing: Implements distributed tracing for serverless functions.
- Cloud Code Execution Tracking: Monitors the execution of code on various cloud platforms.
- Error Identification: Identifies the exact location of errors when problems occur.
Cons:
- No Self-Hosting Option: Only available as a cloud-based service, not for on-premises deployment.
The APM plan includes a range of tools, including website monitoring functions, such as synthetic and real-user monitoring. The system is available for a 30-day free trial.
4. Datadog APM
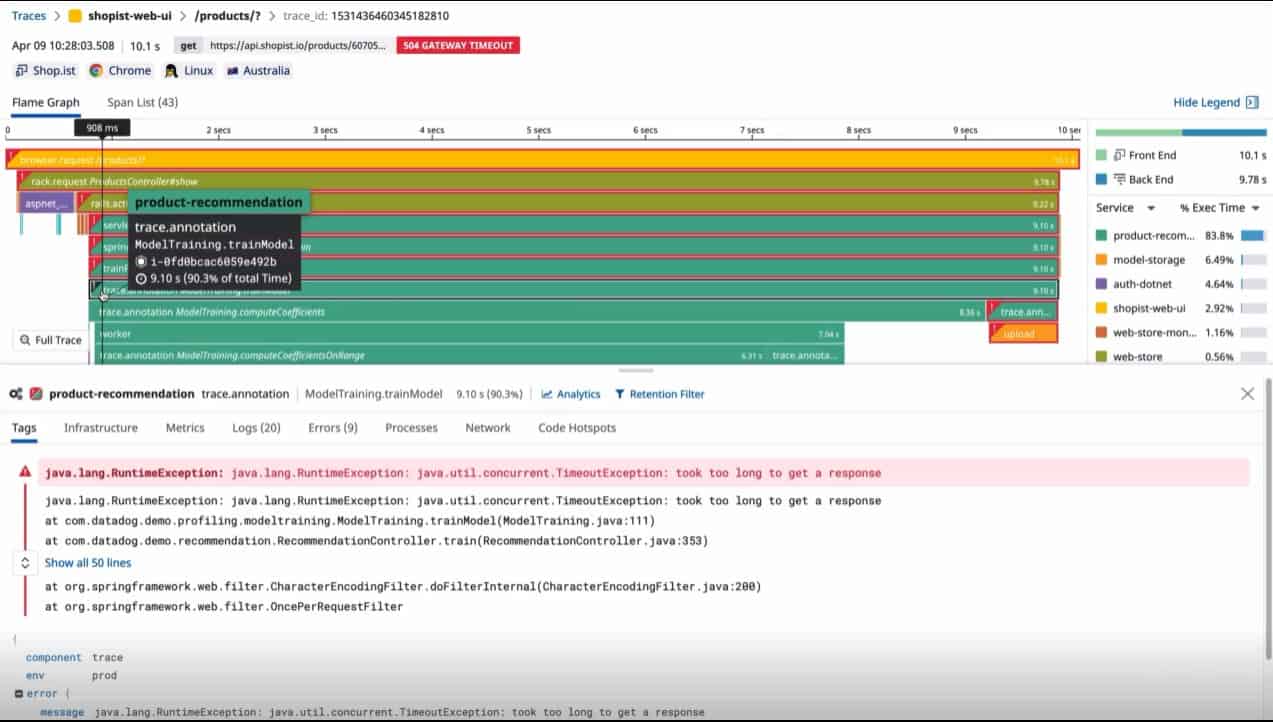
Datadog APM is part of a cloud platform that offers many system monitoring and management tools. The APM is centered on a distributed tracing service and is also available together with a code profiler.
Key Features:
- Application Discovery: Automatically identifies and maps applications and their dependencies.
- Dependency Mapping: Continuously updates maps of application dependencies for accurate monitoring.
- Distributed Tracing: Tracks requests across various services to identify performance bottlenecks.
- Code Profiling Option: Scans through code in Java, .NET, PHP, Node.js, Ruby, Python, Go, or C++ during execution.
Why do we recommend it?
Datadog APM excels in offering a comprehensive suite of monitoring tools, including distributed tracing, application discovery, and an optional code profiler, making it highly effective for detailed application performance management.
The Datadog APM includes a deployment tracker that is able to identify deployment packages with settings variation that allows different versions to be run simultaneously and compared.
Code Profiling is offered in a higher plan that still gets you the standard APM features. This will scan through code written in Java, .NET, PHP, Node.js, Ruby, Python, Go, or C++ as it runs.
Who is it recommended for?
This tool is recommended for businesses seeking an integrated monitoring solution with extensive capabilities, particularly those needing detailed deployment tracking and full-stack observability through multiple Datadog modules.
Pros:
- Modular System: Related modules available to enhance APM capabilities.
- Code Profiling: Optional feature that provides detailed tracing through plain-text programs.
- Deployment Tracker: Identifies deployment packages and allows for comparison of different versions.
- Customizable Alerts: Alerts with options for notification and routing.
Cons:
- Modular Subscription: Full-stack observability requires subscriptions to multiple modules.
Other modules from Datadog work in concert with the APM and extend its capabilities. These include an Infrastructure Monitoring package and Network Monitoring options. You can get a 14-day free trial of Datadog that gives access to all modules.
5. Dynatrace Full-stack Monitoring
Dynatrace offers a SaaS platform with a range of packages that include the Full-stack Monitoring option. This service includes the ability to monitor all layers of the application support stack from user-facing systems, through infrastructure, down to server resources.
Key Features:
- Application Dependency Mapping: Utilizes AI to identify and map application dependencies.
- Root Cause Analysis: AI-driven analysis to identify the root causes of issues.
- AI-Based Predictive Alerts: Predicts potential resource exhaustion and locking issues.
- Distributed Tracing: Tracks requests across different services for detailed performance insights.
- Code Profiling: Analyzes code to identify and optimize performance issues.
Why do we recommend it?
Dynatrace Full-stack Monitoring stands out with its comprehensive monitoring capabilities, utilizing AI for predictive alerts and root cause analysis, ensuring optimal performance across all application layers.
Dynatrace implements application dependency mapping that uses AI to connect the identification of contributing elements and lay down tracks for root cause analysis. AI is also used for predictive alerts that can calculate when all processes running on the same server are going to run down resources or cause locking. The service also provides distributed tracing and code profiling.
Who is it recommended for?
This tool is recommended for enterprises seeking an all-encompassing monitoring solution that leverages AI for predictive insights and detailed application dependency mapping, particularly useful for complex and resource-intensive environments.
Pros:
- Comprehensive Monitoring: Monitors all layers of the application support stack, from user-facing systems to server resources.
- Development Support: Provides error identification and bug tracking for development teams.
- Log Analysis: Scans log files and generates warnings through distributed tracing.
- AI-Driven Insights: Uses AI for root cause analysis and predictive alerts, enhancing proactive issue management.
Cons:
- Additional Cost for Log Management: Log management is available as an extra module, which may increase costs.
6. AppOptics

AppOptics provides Infrastructure Monitoring for hybrid environments and Application Monitoring with autodiscovery, application dependency mapping, and distributed tracing.
Key Features:
- Hybrid Environments: Monitors both cloud and on-premises infrastructure.
- Autodiscovery: Automatically discovers applications and their dependencies.
- Infrastructure and APM: Provides comprehensive infrastructure monitoring and application performance management.
- Distributed Tracing: Tracks requests across various services to identify performance bottlenecks.
- Code Profiling: Analyzes code segments to detect errors and optimize performance.
Why do we recommend it?
AppOptics is a versatile monitoring tool offering robust infrastructure and application performance monitoring, making it ideal for hybrid environments. It stands out with its automatic discovery, distributed tracing, and detailed code profiling features.
The AppOptics system is a SaaS package with a cloud-hosted console that is accessed through any standard Web browser. The monitor works with customizable thresholds that trigger notifications if performance problems are detected.
The package includes a code profiler that automatically detects the language of the framework of each application code segment. It operates on systems written on Java Virtual Machine (JVM), .NET, and WCF. It tracks through PHP, Python, Ruby, and Node.js.
Who is it recommended for?
This tool is recommended for development and operations teams seeking comprehensive monitoring solutions for both infrastructure and applications, especially those working in hybrid environments.
Pros:
- SaaS Platform: Offers a cloud-hosted console accessible via any standard web browser, ensuring ease of use and scalability.
- Customizable Alerts: Allows setting thresholds that trigger notifications for performance issues.
- Dependency Mapping: Maps application dependencies and performs root cause analysis for quick issue resolution.
- Error Tracking: Provides code profiling to track and fix errors effectively.
- DevOps Friendly: Suitable for both development and operations teams, enhancing collaboration and efficiency.
Cons:
- No Network Monitoring: Does not include features for network monitoring, which might require supplementary tools for comprehensive coverage.
