IT asset management systems and also system performance and security monitors need to know exactly what devices are connected to a network. The network is the territory that needs to be monitored and the asset discovery system is like a population count. You can’t monitor a system if you don’t know what equipment is involved.
Here is our list of the best Agentless Discovery tools for IT Asset Management:
- ManageEngine OpManager EDITOR’S CHOICE A comprehensive network monitoring tool that supports agentless discovery to identify and map all devices in your infrastructure. Its network topology map is intuitive and updates in real time. Start a free 30-day trial.
- FirstWave Open-AudIT This IT asset discovery package scans a network and catalogs all of the devices connected to it. It then scans each endpoint and generates a software inventory. Runs on Windows Server and Linux.
- ManageEngine ServiceDesk Plus This on-premises package uses SNMP to track the presence of all equipment on a network. It is then able to support a Service Desk team with functions that follow ITIL best practices. Runs on Windows Server and Linux.
- Faddom A system documentation package that implements discovery for networks that writes up an inventory and a network topology map.
- Paessler PRTG A collection of monitoring tools that starts its work by discovering all devices connected to the network and offers network, server, and application monitoring. Installs on Windows Server.
- Nagios XI This package of monitoring tools provides a unified console for a large library of network, server, and application monitors. Runs on Linux.
- Zabbix This is a free system monitoring package with an attractive and easy-to-read console and an automated discovery process. Runs on Linux.
You can read more about each of these options in the following sections.
There are several ways to record what devices you have connected to a network – an automated digital system is preferable to a manual pen-and-paper strategy. Fortunately, there are several methods that you can use to discover all of the devices on your network that is already installed and available.
Next, you need to decide whether to opt for agent-based or agentless discovery methods.
Agent-based discovery
An “agent” is a useful data collection and reporting program. For example, cloud-based network monitoring systems install an agent on one of the servers connected to your network to gather information. However, systems that rely on agents resident on endpoints aren’t really practical for discovery because you would need to already know of each device’s instance to install an agent on it.
Agentless discovery
Your network is created by several services. These include address allocation systems, such as the Dynamic Host Configuration Protocol (DHCP), the Domain Name Service (DNS), and the Address Resolution Protocol (ARP). Those systems keep a live report on the addresses of each device on your network. If a device hasn’t been allocated an address, technically, it isn’t on your network.
The easiest agentless tool that you can use to discover all devices on your network is to query one of those systems. Open a Command Prompt/Terminal window and type in:
arp -a
The results of this query will bring a list of all devices, showing the IP address and MAC address of each.
The ARP report doesn’t give you any details on each device. However, it gives you a starting point and it is an example of how easy it is to discover the devices connected to a network without the need of an agent.
Is it agent-based or agentless?
Working out whether a particular discovery system is agent-based or agentless is not so simple. A big issue is what constitutes an agent. Cloud-based systems will advertise agentless network discovery and monitoring, but how do they do that?
Cloud-based monitoring systems and IT asset management tools can, in theory, be agentless by connecting to a network through a remote terminal session and then performing queries, such as the ARP command explained above. However, that would be a cumbersome process because the connection can’t be kept open forever and the monitor would have to run a lot of different utilities through that remote terminal window.
It is just a lot simpler to use one connection to a server on the monitored network to download an agent and let that gather data and upload it. The producers of cloud-based IT asset management services stretch the definition of what an agentless system is by saying that their data collection agent is a monitoring agent that performs agentless discovery locally. So, yes, there is an agent involved, but the system is still agentless.
Even locally-installed network monitors use agents for device discovery. Here again, the sales copy will stretch the definition of “agentless.” A system that collects IT asset data without an agent is using a system of agents that was installed by someone else. By the strict definition of no agent being involved in the discovery process, there is no such thing as an agentless discovery service.
The Simple Network Management Protocol
The mechanism that gives the producers of IT asset management systems the ability to label their systems as “agentless” is called the Simple Network Management Protocol (SNMP). This uses a device agent that is installed on every network device. Endpoints also have an SNMP Agent – for example, it is included in all versions of the Windows operating system.
The SNMP system requires a central Manager that communicates with device agents. The manufacturers of network devices load an SNMP Agent on each. All that’s missing is the SNMP Manager. Network monitoring tools are, effectively, SNMP Managers.
The SNMP Manager sends out a request for reports as a broadcast. These requests are not addressed to any specific devices and so all devices pick them up and the SNMP Agent on each responds. The SNMP response is a list of statuses and also details about the device. So, once all of these reports return to the SNMP Manager, those details can easily be compiled into an IT asset inventory. Thus, an automated discovery process has been performed.
The SNMP response/request cycle repeats continuously, so the IT asset inventory is always kept up to date.
The best agentless discovery tools
When looking for agentless discovery tools for IT asset management, we first had to decide which definition of “agentless” to run with. We chose to follow the definition that regards the SNMP Agent as part of an “agentless” system.
What should you look for in an agentless discovery tool for IT asset management?
We reviewed the market for agentless discovery systems and analyzed the tools based on the following criteria:
- A central monitor that acts as an SNMP Manager
- A tool that can compile the data returned in SNMP responses
- A system that uses no agents other than the SNMP Agents
- A tool that will spot changes in the network infrastructure and update the inventory
- A service that facilitates the timing of asset retirement
- A free trial or a demo package that allows a no-obligation assessment
- Good value for money from a tool that offers efficient service at a reasonable price
With these criteria in mind, we looked for good value SNMP-based monitoring systems that will automatically compile an inventory to facilitate IT asset management.
1. ManageEngine OpManager (FREE TRIAL)

ManageEngine OpManager is an advanced network monitoring and management platform that uses agentless discovery to automatically identify all applications and devices, like servers, virtual machines, and more. It comes with 11,000+ device templates to monitor different types of devices through a single console.
Key Features:
- Discovery Rule Engine: Automates the process of adding or classifying new device types.
- Device Templates: Supports both standard and non-standard devices in your infrastructure.
- Performance Monitors: Monitors more than 3000 parameters through a single console.
- Workflow Automation: Allows you to create custom workflows and schedule them to automate routine tasks.
- Integrations: Integrates well with other tools.
Why do we recommend it?
We recommend OpManager because it comes with many advanced features that provide the visibility and control you need into all the devices, with minimal effort. It uses protocols like WMI, SNMP, and NetFlow to gather data from each device. It analyzes this data to create network topology maps, which show the dependencies and interactions of these devices. More importantly, these maps update in real time, making them relevant at all times.
This automated process saves time and effort for your team. Also, OpManager integrates well with other devices, enabling you to create automated workflows that help identify and troubleshoot issues before they impact your organization.
Who is it recommended for?
OpManager is a good choice for IT teams in medium to large enterprises that require comprehensive monitoring and network discovery with minimal effort. It also helps MSPs to have a more detailed view of their clients’ infrastructure.
Pros:
- Multiple Protocols: Supports a wide range of protocols, like SNMP, ICMP, WMI, and more.
- Real-time: Updates the topology maps in real time.
- Performance Tracking: Monitors 3000+ parameters.
- Automated Workflows: Integrates with other tools to create automated workflows.
Cons:
- Advanced Feature Availability: Some advanced features require higher-tier pricing.
OpManager supports both Windows and Linux operating systems. The cost depends on the number of devices. For example, the annual subscription for the Standard Editions starts at $95 for 10 devices and two users, while the Professional Edition starts at $145. Get started with a 30-day free trial.
EDITOR'S CHOICE
Our editors have picked ManageEngine OpManager as the best agentless discovery tool, as it comes with 11,000+ device templates for monitoring the health and performance of different devices in your network. A highlight of this tool is its discovery rule engine, which identifies new devices and automatically classifies them based on predefined rules. This feature helps to create automated workflows and schedules to enable you to stay on top of all your IT assets through a single console. Its well-designed topology maps, support for multiple protocols, and real-time updates to maps are other reasons why we highly recommend it.
Download: Get a 30-day FREE trial
Official Site: https://www.manageengine.com/network-monitoring/
OS: Windows, Linux
2. FirstWave Open-AudIT
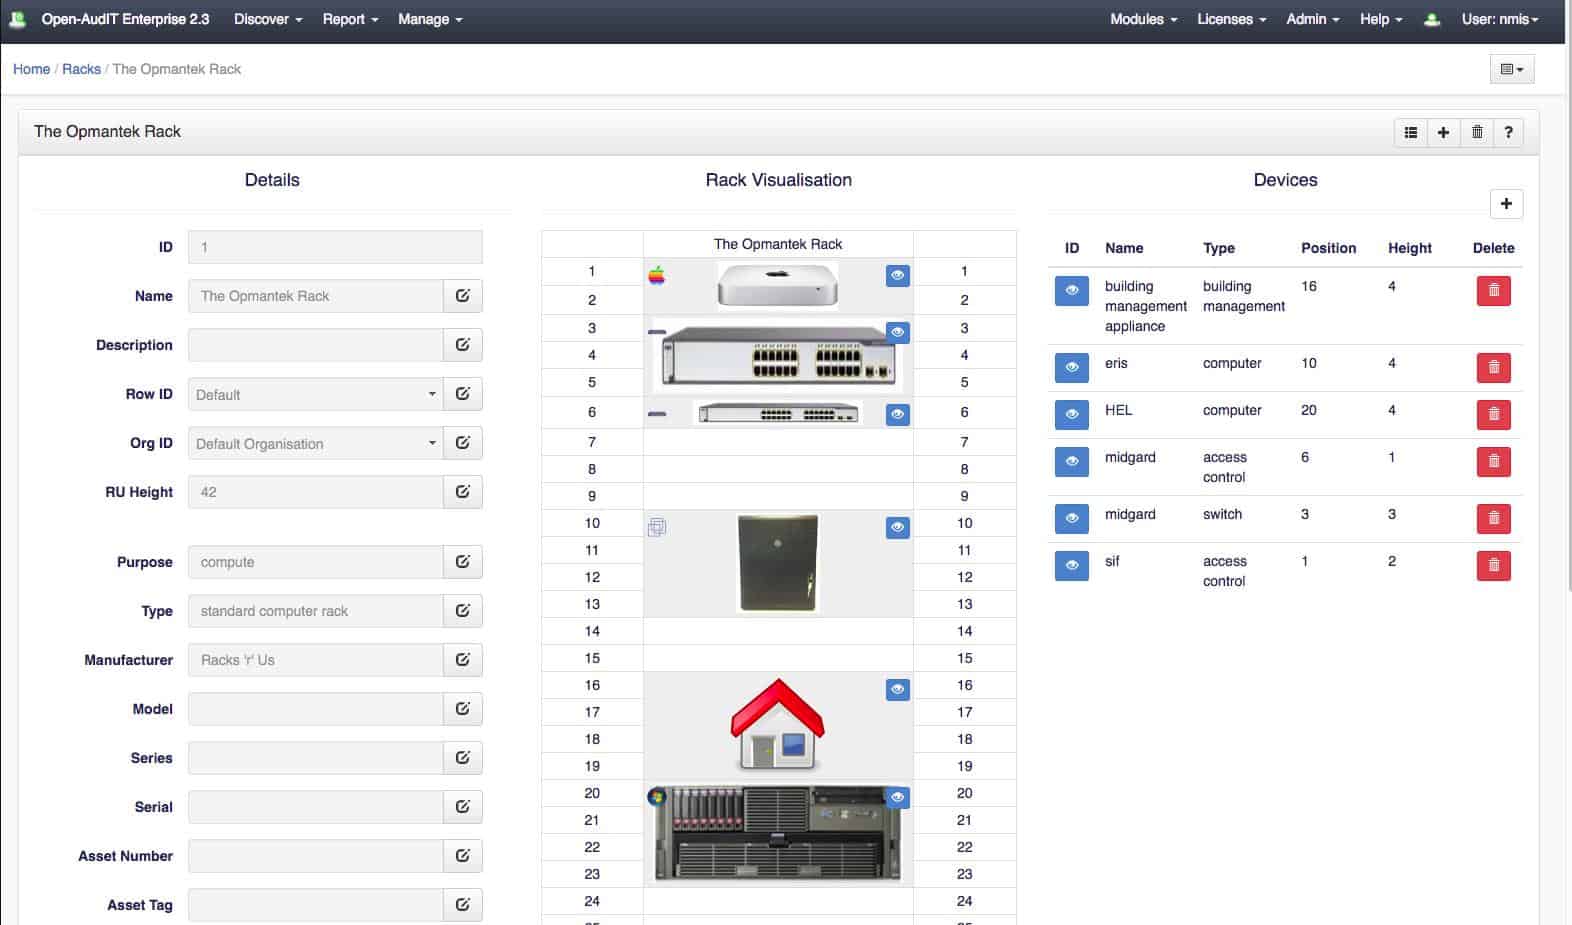
FirstWave Open-AudIT is an IT asset management and auditing system that implements autodiscovery to assemble and maintain hardware and software inventories. The discovery service uses SNMP processes to acquire information on all devices connected to the network and writes that information into a database.
Key Features:
- Hardware Inventory: Automatically discovers and maintains an inventory of all hardware devices on the network.
- Software Inventory: Tracks all software installations across the network.
- Writes to a Database: Stores all discovered data in a structured database for easy access and management.
- Constantly Re-Queries: Continuously rechecks all devices to keep the inventory up-to-date.
- Software License Management: Manages software licenses to ensure compliance and optimize usage.
Why do we recommend it?
FirstWave Open-AudIT excels in providing comprehensive IT asset management and auditing through its robust autodiscovery capabilities. Its ability to maintain up-to-date hardware and software inventories, along with detailed configuration management and network mapping, makes it a valuable tool for organizations aiming to streamline their IT operations and ensure compliance.
Apart from the discovery system, the Open-AudIT package includes a configuration manager and a network mapper. The configuration manager is a security service because it takes a snapshot of the settings of each device and rechecks all equipment periodically. The snapshot can also be used to standardize the settings of all similar devices.
The network mapper offers a range of formats that include a plot on a real-world map and a rack visualization.
Who is it recommended for?
This tool is ideal for IT departments and managed service providers who need to maintain accurate and detailed inventories of their hardware and software assets. It is particularly beneficial for organizations looking to automate their network administration and enhance their security through constant configuration monitoring.
Pros:
- Network Topology Mapper: Includes a mapper to visualize network layouts, enhancing understanding of network structure.
- Multiple Layout Views: Offers various layout formats, including real-world maps and rack visualizations, for versatile monitoring.
- Flexible Deployment: Available as an on-premises solution or as a SaaS, catering to different organizational needs.
- Configuration Management: Helps maintain security by standardizing device settings and rechecking configurations periodically.
- Network Administration Automation: Automates many aspects of network administration, reducing manual workload.
Cons:
- Feature Availability: Full features are only available in the most expensive editions, which might be a limitation for some users.
- Limited Free Version: The Community Edition is free but lacks many features of the paid versions.
The Open-AudIT software runs on Windows Server and Linux. There is also a SaaS version available. The on-premises system is offered for free as a Community Edition, which includes asset discovery but not all of the features of the paid packages. The other two options are Professional and Enterprise. You can use the Professional Edition free forever to monitor up to 20 devices. You can also get a 30-day free trial of the full Professional Edition.
3. ManageEngine ServiceDesk Plus
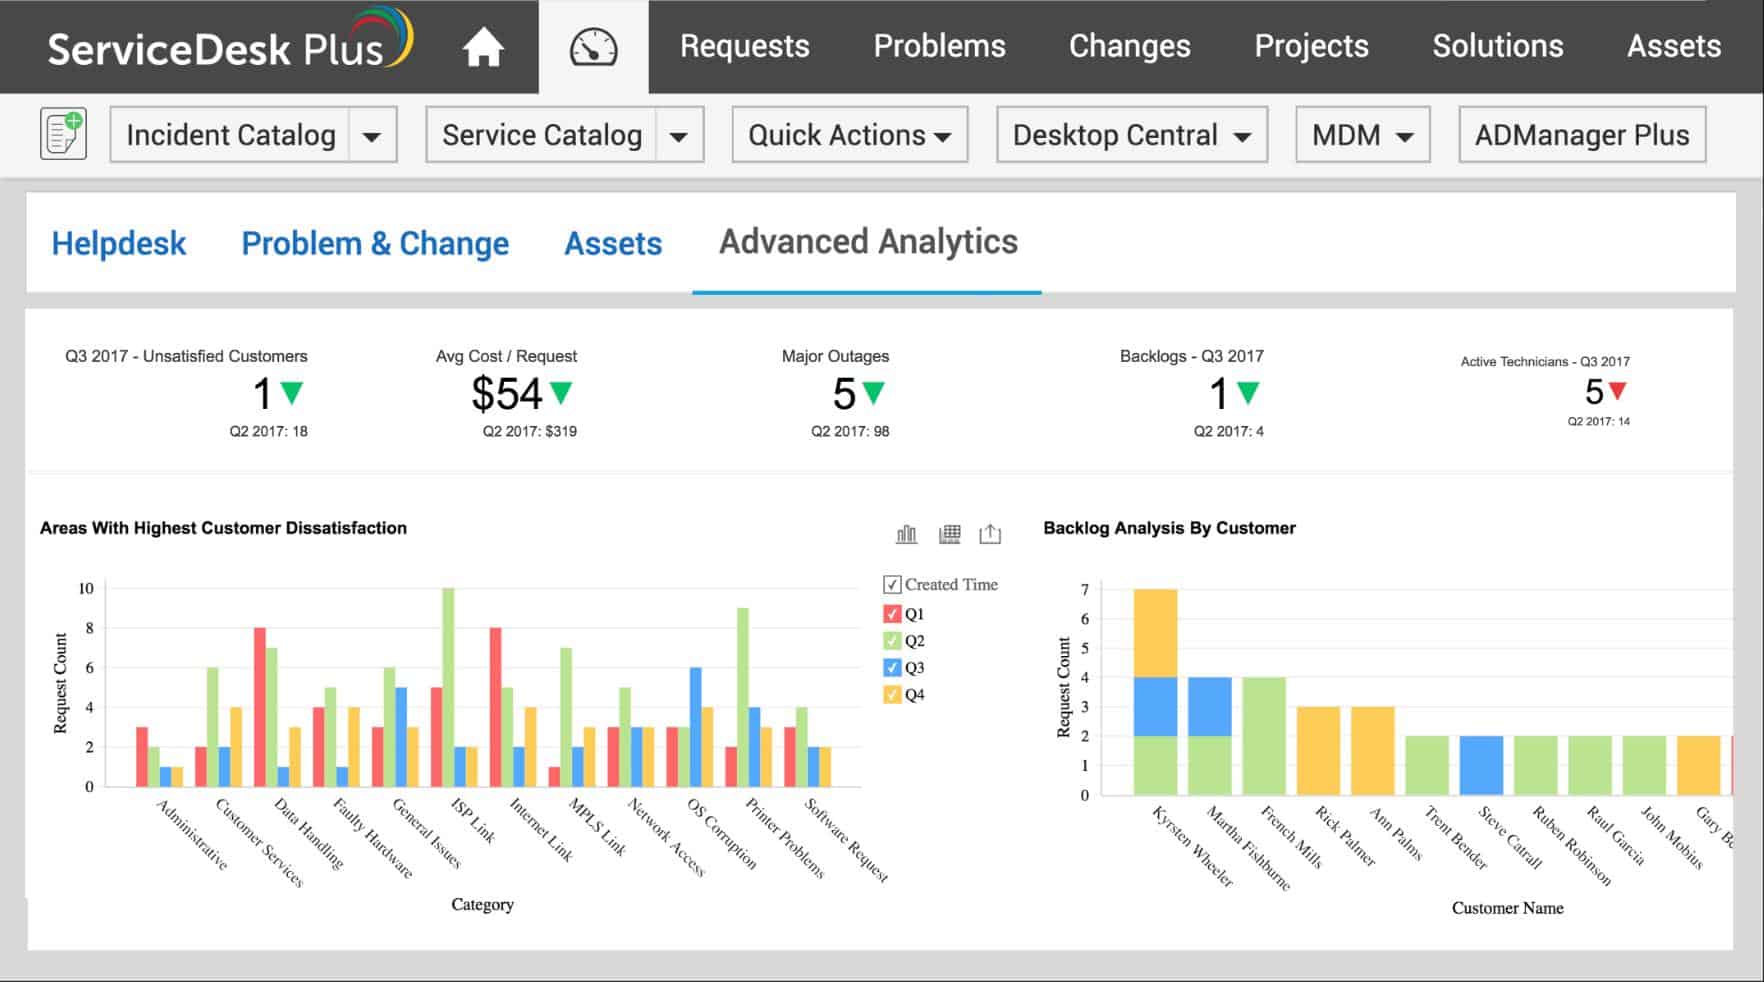
ManageEngine ServiceDesk Plus is an ITIL-based asset management system and it bases its functions on an asset inventory autodiscovery service. There are three Editions to the ServiceDesk Plus system. The first of these, Standard, is a Help Desk system. You need to go up to the next level, which is the Professional package to get the IT asset discovery service.
Key Features:
- Three Plan Levels: Available in Standard, Professional, and Enterprise editions to suit different needs.
- Automated Inventories: Automatically discovers and maintains hardware and software inventories.
- SLA Tracking: Monitors and enforces Service Level Agreements for better service management.
- Help Desk System: Provides a robust help desk system for ticket management and user support.
- Purchase Management Module: Manages procurement processes and tracks purchases within the IT asset management framework.
Why do we recommend it?
ManageEngine ServiceDesk Plus offers a comprehensive ITIL-based asset management system that combines automated inventory tracking with a full-featured help desk. The integration of SLA tracking and purchase management makes it a versatile tool for IT departments looking to streamline their operations and ensure compliance with service standards.
The device tracking system discovers endpoints, including desktops and servers, and also network devices, such as switches and routers. The tool also provides a software inventory. So, the result of the discovery process is a hardware inventory and a software inventory, both of which are continuously updated.
The Professional package also includes a Help Desk system, SLA tracking, and a purchase management module.
Who is it recommended for?
This tool is recommended for medium to large enterprises that require a detailed and continuously updated asset management system. It is especially beneficial for organizations with a strong focus on ITIL practices and those needing integrated help desk and purchase management functionalities.
Pros:
- Constantly Updated Inventories: Provides real-time updates for both hardware and software inventories, ensuring accurate asset tracking.
- Comprehensive Help Desk: Includes a fully-featured help desk system to manage tickets and user support efficiently.
- ITIL-Based Management: Adheres to ITIL standards for asset management, enhancing service delivery and compliance.
- Flexible Deployment: Available as both on-premises software for Windows Server and Linux, and as a cloud service.
Cons:
- No Network Topology Mapping: Lacks a network topology mapping feature, which may be a drawback for users needing detailed network visualization.
The on-premises software for ServiceDesk Plus installs on Windows Server and Linux. The system is also available as a cloud service. You can assess ManageEngine ServiceDesk Plus with a 30-day free trial.
4. Faddom

Faddom is an IT asset management package that implements asset discovery for both network hardware and applications. The result of each of these services is a map – a network map and an application dependency map. The package also provides a network security monitoring system.
Key Features:
- Network discovery: Produces a network map and an inventory
- Network security monitoring: Scans for malware and intruder lateral movement
- Application discovery: Creates an application dependency map
- Asset details: Examine information about every device on the network
- Supports microsegmentation planning: Creates stronger network security
Why do we recommend it?
Faddom is focused on documenting IT systems with a continuous discovery cycle. The tool is agentless and operates within a VM on one of your servers. The package is able to exploit the Simple Network Management Protocol for discovery, documentation, and mapping. The information provided by the scan provides source data from microsegmentation planning.
The discovery process repeats and so simultaneously provides security monitoring. The service will identify rogue devices, which can be an entry attempt by an intruder. The tool also logs addressing on the network, which reconciles IP addresses and MAC addresses.
Any changes to the layout of the network are automatically accounted for in the network inventory and map, which are updated with the new configuration – devices could be added, moved, or removed.
Although the network inventory provides the most detail on each device and link, the map also has some information written onto it. This is a quick and convenient way to identify each device on the layout and assess the capacity of its interfaces.
The second element in the Faddom discovery service is its Application Map unit. This scans each server and looks at running processes as each process launches subprocesses, the Faddom system notes the relationship and those details result in the creation of an application dependency map.
Who is it recommended for?
The Faddom package is intended for use on large networks. The system is pricey with a starting price of $10,000 to scan a network of up to 100 nodes. This price is out of the reach of typical SMEs. The service has three plan levels with the security features reserved for the two higher editions.
Pros:
- An on-premises package: Runs as a virtual appliance
- Discovers all network devices: Includes endpoint discovery
- Migration planning: Provides size requirements for cloud hosting
- Scrutinize external traffic: Track conversations involving remote systems
- Traffic anomaly detection: Alerts to possible malicious activity
Cons:
- Get what you pay for: Rival products cost a lot less
Faddom is an on-premises software package. It runs on a VM but that system is provided as part of the installation process, so you don’t need to buy the virtualization service separately. The Faddom system is available for a 14-day free trial.
5. Paessler PRTG
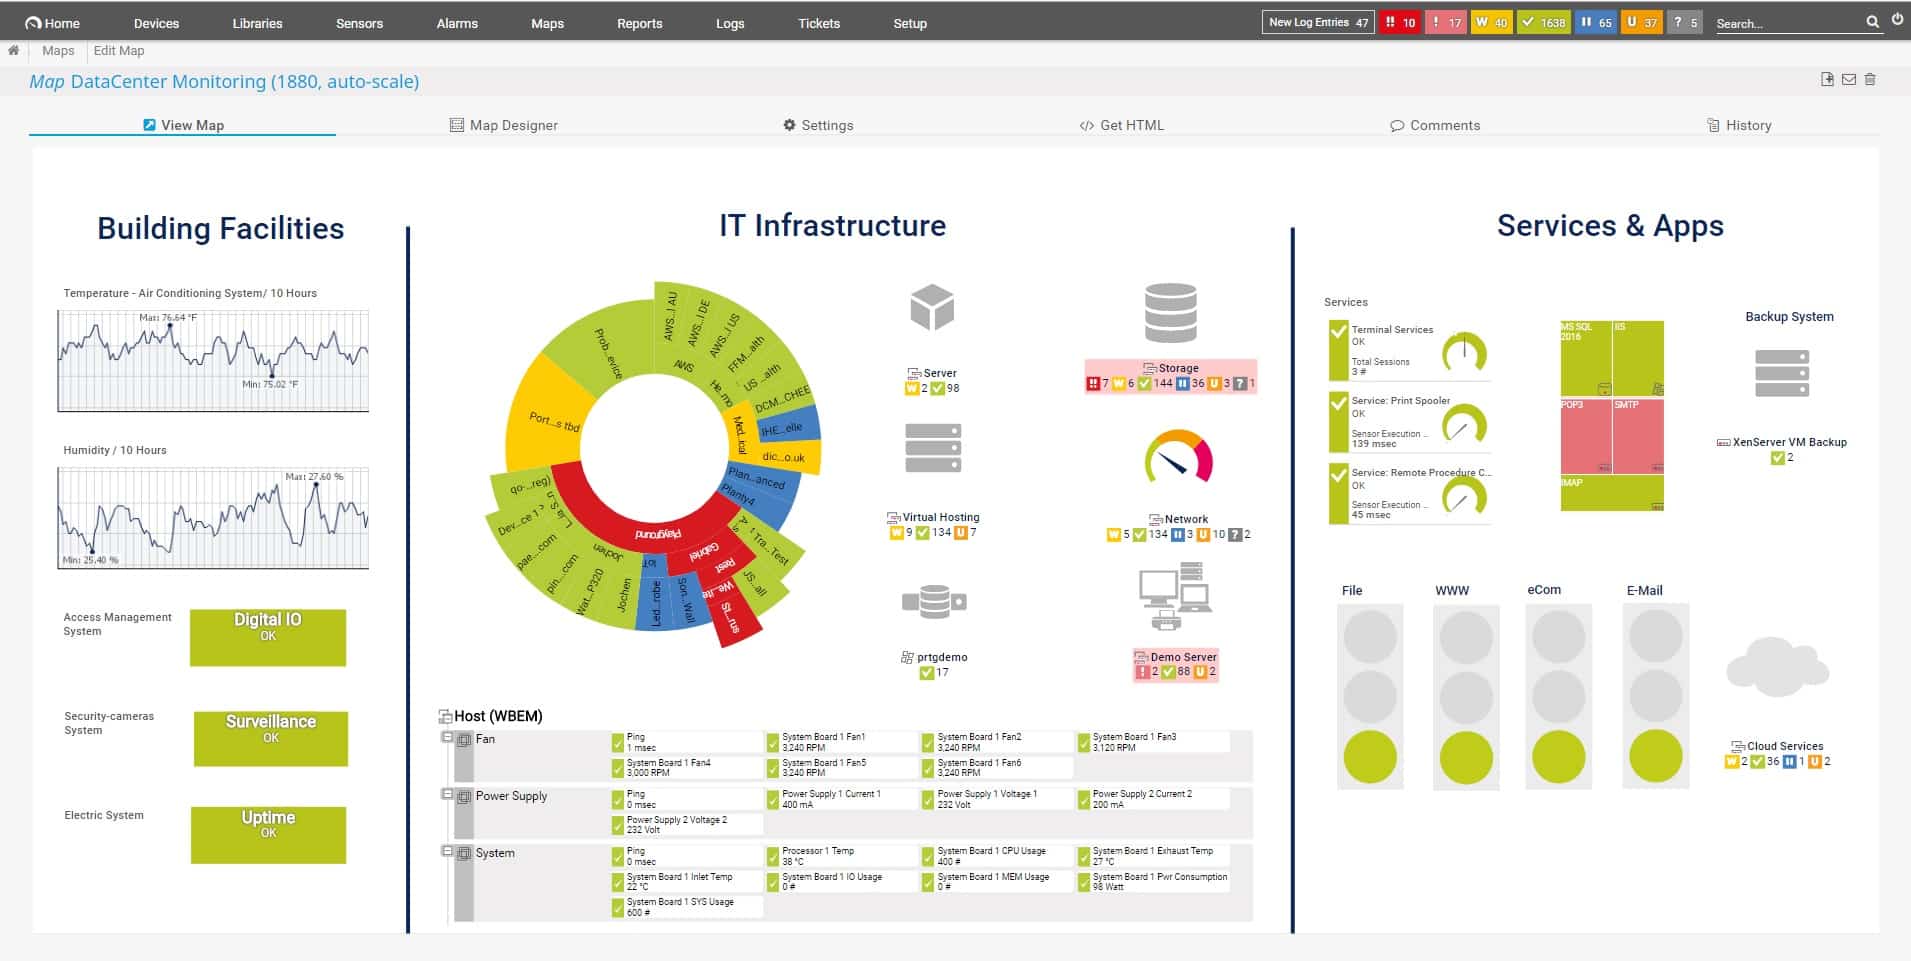
Paessler PRTG is a bundle of monitoring tools for networks, servers, and applications. Every customer is delivered the same software package but buys the right to activate a certain number of sensors in the service. If you only activate 100 sensors, you can use the system for free.
Key Features:
- Choice of Sensors: Customers can select and activate the specific sensors they need.
- SNMP-Based: Utilizes SNMP for asset discovery and monitoring.
- Network Topology Mapping: Includes tools for network topology mapping and asset dependency mapping.
Why do we recommend it?
Paessler PRTG offers a highly flexible and comprehensive monitoring solution for networks, servers, and applications. Its sensor-based pricing allows businesses to tailor the system to their specific needs, making it cost-effective. The continuous asset inventory updates and detailed network mapping capabilities make it an excellent choice for maintaining a dynamic and well-monitored IT environment.
The foundation of the monitoring system is the asset inventory, which is compiled through an SNMP-based autodiscovery mechanism. The tool also includes a network topology mapper and an asset dependency map. The package includes a lot of very useful tools, but you have to plan your requirements carefully to ensure that you only activate those systems that you need.
As SNMP cycles constantly, the asset inventory is automatically updated if a device is added, moved, or removed. Device agent notifications, called SNMP Trap messages are interpreted into alerts by the PRTG system.
Who is it recommended for?
This tool is ideal for businesses of all sizes, especially those needing a customizable and scalable monitoring solution. It is particularly beneficial for IT departments that require constant network and device monitoring, and for small businesses that can take advantage of the free version with limited sensors.
Pros:
- Performance Alerts: Provides real-time alerts for performance issues based on SNMP Trap messages.
- Updated Network Inventory: Maintains an up-to-date network inventory through continuous SNMP cycles.
- Free Option: Offers a free version for small businesses with up to 100 sensors, making it accessible for smaller networks.
- Comprehensive Tools: Includes a wide range of monitoring tools, ensuring thorough network and device oversight.
Cons:
- Large Software Package: Delivers a large software package even if only a small number of sensors are activated, which may be unnecessary for some users.
Paessler PRTG runs on Windows Server and you can assess it with a 30-day free trial that includes all sensors activated.
6. Nagios XI

Nagios XI monitors networks, servers, and applications. There is a free version of this tool, which is called Nagios Core. Although Nagios Core is widely-respected and has been forked for many other system monitoring brands, it doesn’t include an interface. The Nagios system includes automated network discovery and a constantly maintained asset inventory.
Key Features:
- Constantly Updated Asset Inventory: Continuously maintains and updates a comprehensive asset inventory.
- Extensible with Plugins: Supports a wide array of plugins to extend functionality and integrate with third-party tools.
- Stable and Reliable: Known for its stability and reliability, with well-maintained code.
Why do we recommend it?
Nagios XI offers a robust and highly extensible monitoring solution that caters to networks, servers, and applications. Its extensive plugin support and constant asset inventory updates make it a versatile and reliable tool for comprehensive IT infrastructure monitoring. The availability of a free version, Nagios Core, allows users to explore its capabilities before committing to the full version.
Nagios is remarkable for its extensions. These are called plug-ins and the community maintains a list of thousands of them that are available for free. Some of these tools add extra functions, including new monitoring screens, while others are mechanisms to link to third-party tools.
The code for Nagios XI is well maintained, making it a very stable system. Features in the package include a network topology mapper, which can be adapted by plug-ins to provide a variety of layout views. Nagios data can be channeled through to third-party tools such as Splunk for performance analysis and security monitoring.
Who is it recommended for?
Nagios XI is ideal for IT professionals and organizations that require a stable, reliable, and customizable monitoring solution. It is particularly beneficial for Linux-based environments and users who can leverage its extensive plugin library for enhanced functionality.
Pros:
- Highly Respected: Well-regarded in the industry and frequently mimicked by other monitoring systems.
- Network Topology Mapping: Includes a network topology mapper, adaptable through plugins for various layout views.
- Free Version Available: Offers a free version (Nagios Core) for basic monitoring needs.
- Extensive Plugin Support: Thousands of plugins available for additional features and third-party tool integration.
Cons:
- Linux-Specific: Only written for Linux distributions such as CentOS, RHEL, Ubuntu, and Debian.
- Complex Installation on Windows: Requires running on Windows through VMWare or Hyper-V VM, which can be complex.
- No Built-In Interface for Free Version: Nagios Core lacks a built-in interface, potentially limiting usability for some users.
The code for Nagios XI is written for Linux – specifically CentOS, RHEL, Ubuntu, and Debian distros. It is possible to run it on Windows over a VMWare or Hyper-V VM. Nagios XI is available for a 30-day free trial.
7. Zabbix

Zabbix is a great monitor for physical and virtual assets. It is open-source and completely free to use – there is no paid version. The producers of the system make an income by offering support and training packages. This tool uses SNMP for asset discovery and provides additional availability checks with Ping.
Key Features:
- Automatic Asset Inventory: Utilizes SNMP for asset discovery and Ping for availability checks.
- Virtualization Documentation: Maps and monitors virtual servers and their VMs.
- Configuration Security Checks: Scans and alerts for configuration changes in network devices.
Why do we recommend it?
Zabbix offers a comprehensive, open-source monitoring solution for both physical and virtual assets without any cost. Its automatic asset inventory and configuration security checks make it a reliable tool for maintaining a secure and well-documented IT infrastructure. The system’s flexibility with templates and plug-ins ensures detailed and customizable monitoring capabilities.
This system will also map your virtual servers and their VMs. It has a status checking process that scans configurations of network devices and alerts if changes have occurred since the last sweep.
You can adapt the Zabbix system to perform detailed monitoring for specific makes and models of network devices by applying a template. These plug-ins add extra screens to the interface and they are available for free from the community marketplace.
The system includes an alerting mechanism if performance deteriorates and alerts can be forwarded as notifications by SMS, email, or messenger service.
Who is it recommended for?
Zabbix is ideal for organizations looking for a free, open-source monitoring solution. It is particularly suitable for IT environments using Linux and those requiring detailed monitoring and alerting for network devices, servers, and virtualization platforms.
Pros:
- Performance Alerts: Provides real-time alerts for performance issues, ensuring timely responses.
- Capacity Planning and Trend Analysis: Includes tools for capacity planning and trend analysis to help optimize resource usage.
- Completely Free: Open-source and free to use, making it accessible for organizations with limited budgets.
- Extensive Community Support: A strong community marketplace offering free templates and plug-ins for customization.
Cons:
- Not Written for Windows: Primarily designed for Linux environments, which may limit its use in Windows-centric networks.
- Learning Curve: May require more technical knowledge to set up and configure compared to some commercial solutions.
Zabbix runs on Linux: RHEL, SUSE, CentOS, Oracle Linux, Debian, Ubuntu, and Raspberry Pi. there is no version for Windows, but you could install it over a VM. You can download Zabbix for free.
