Cloud analytics tools have emerged as a new model of enterprise analytics. Now companies are using analytics solutions in the cloud to visualize key business metrics remotely.
We get in-depth on each of the tools we feature below, if you are short on time, here is our list of the seven best cloud analytics tools:
- AppOptics Custom Metrics and Analytics EDITOR’S CHOICE A data gathering service that forms part of an infrastructure and application monitoring package. This is a cloud-based service and it is able to gather statistics for analysis from other cloud platforms and also from your on-site resources. Start a 30-day free trial.
- Zoho Analytics (FREE TRIAL) This platform provides business intelligence by gathering, formatting, and presenting your business activity data. Available for installation on Windows, Windows Server, and Linux or as a SaaS package. Start a 30-day free trial.
- IBM Cognos Analytics Uses AI techniques to uncover and identify patterns combined with great visuals. Has plans to suit businesses at any scale.
- Microsoft Power BI Great data visualization, create dashboards and easily share and collaborate with colleagues. Integrates machine learning.
- Board Decades of business performance management distilled into a cloud-based offering, with powerful pre-configured automated predictive modeling.
- TIBCO Spotfire AI-powered advanced analytics tool designed for enterprise users with strong search capabilities.
- Domo Pulls data from external service providers such as Microsoft Excel, Xero, Facebook, Salesforce, AWS, MySQL, and more.
What is a Cloud Analytics Tool?
A cloud analytics tool is a platform based in the cloud that allows the user to view analytics data. Through one pane of glass, you can monitor data sources, data models, processing applications, computing resources, analytics models, and storage resources. Companies use these tools for everything from network monitoring to business intelligence.
The core benefit of cloud analytics tools is that you can monitor lots of disparate services and datasets from one location. For example, you can view a range of business intelligence metrics and real-time insights before converting them into a report to send over to other stakeholders. Having this information readily available helps to make more informed business decisions and operate more efficiently.
The best cloud analytics tools
Our methodology for selecting a cloud analytics tool
We reviewed the market for cloud analytics systems and analyzed tools based on the following criteria:
- A process to extract and store performance data
- A function to sort and standardize data storage formats
- A powerful sorting engine that can process large collections of data
- AI-based heuristics to speed up analysis
- A data retention system that can archive and revive records
- A free trial or a demo account for a risk-free assessment period
- A package that offers powerful data analysis tools for a fair price
With these selection criteria in mind, we sought out suitable analytical systems that can gather data from cloud platforms and impose meaningful searches on them to produce useful business and system performance insights.
1. AppOptics Custom Metrics and Analytics (FREE TRIAL)
AppOptics is a cloud-based monitoring service for applications and IT infrastructure. The infrastructure monitoring functions are included with the applications monitor, which is called AppOptics APM. The infrastructure-only monitor is called AppOptics Infrastructure. The Custom Metrics and Analytics service can be added to either package to get greater insights into the performance of your networks, servers, and services.
Key Features:
- Two Plan Levels: Monitors applications and infrastructure
- Live Monitoring: Gathers performance statistics from monitored resources
- Includes a Data Analyzer: Perform manual analysis
- Consolidates and Stores Data for Analysis: Cloud storage space included
- Recalls Stored Data: Historical analysis
Why do we recommend it?
AppOptics Custom Metrics and Analytics is potentially a very powerful feature because you can use it to analyze any system data as long as you know how to channel it into the tool. This is an extra service to the standard, pre-written application and infrastructure performance analysis system of AppOptics.
The Custom Metrics and Analytics module enables administrators to collect extra performance metrics by activating open-source agents, or by including calls to the data-gathering processes through an API. These extra interfaces make the data collection capabilities of the Custom Metrics and Analytics service very flexible. However, they also require extra work to set up, which might prove a little too complicated for many time-pressed systems administrators.

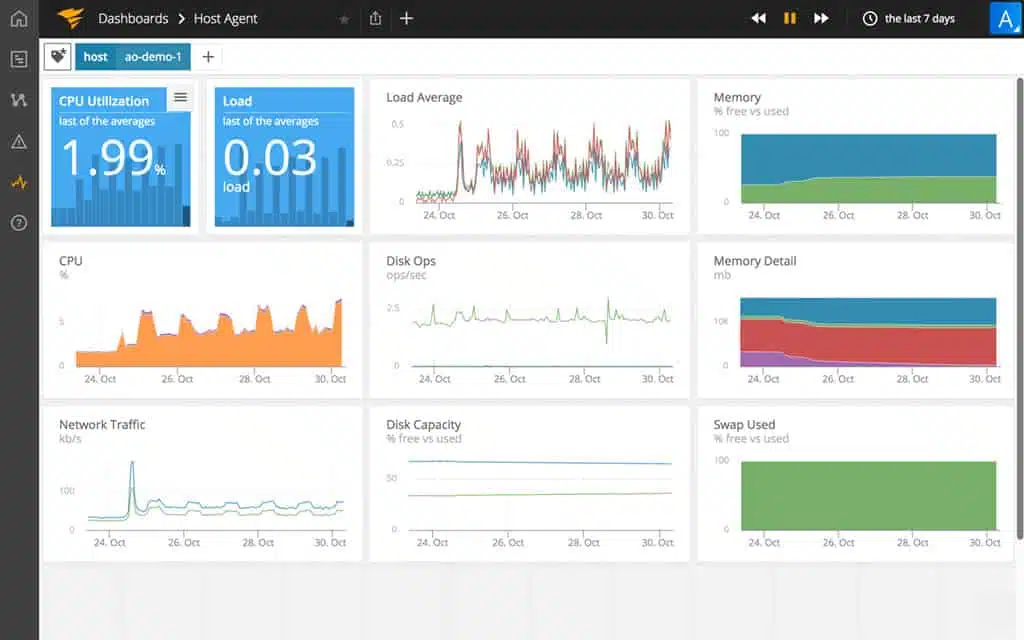
As a cloud-based service, AppOptics isn’t limited to collecting data on one site. It can also monitor remote networks, multi-site systems, and cloud servers provided by AWS or Azure. Data from several sources can be aggregated to provide a full statistical overview of your entire system, providing drill-down capabilities to get down to data from individual devices. The presentation of the collected custom data is also up for customization. The administrator can choose whether to view the gathered data as plain lists of records, as graphs, or as charts.
The extra metrics package adds to the system performance data gathered automatically by AppOptics. Many businesses will probably find that the metrics gathered by the standard service provide enough insights to properly plan their capacity and ensure continued faultless serve to their users.
Who is it recommended for?
This feature is unusual because the AppOptics system is very comprehensive and already has built-in monitoring systems for just about every technology that any business is likely to use. The cloud platform also has integrations that connect directly to the major cloud platforms. So, this customization feature would only be needed for custom-built apps.
Pros:
- Offers Great Visualizations: Provides live and historical health metrics and resource consumption
- A Cloud Service: No need to download software and host it
- Tracks All Major Resources: CPU, memory, and network usage
- Monitors Virtual Systems: Docker, Azure, and Hyper-V platforms
- Two Plan Levels: Infrastructure only or Infrastructure and APM
Cons:
- No On-Premises Version: Only available as a SaaS platform
AppOptics is charged for by subscription, with fees charged annually in advance. The full AppOptics APM is available for testing on a 30-day free trial.
EDITOR'S CHOICE
AppOptics Custom Metrics and Analytics is our top pick for a cloud analytics tool because it is a free feature provided as an extra service by a cloud-based system monitoring package. The system allows the user to mark specific details for further analysis. There is also a data manager and a data analyzer built into the package. This service can collect data from anywhere and include statistics from your on-site systems with metrics extracted from cloud platforms. This flexible package offers a lot of options for those who want to use the custom data as extra monitoring screens because those data viewing screens are customizable.
Download: Start 30-day FREE Trial
Official Site: https://my.appoptics.com/sign_up
OS: Cloud-based
2. Zoho Analytics (FREE TRIAL)
Zoho Analytics is a BI package and it competes in a crowded market. The strength of this system is its library of connectors to third-party systems. Often the difficulty of using a BI system lies with getting data into it, so the connector library saves a lot of time. As a fallback position, you can use a log forwarder.
Key Features:
- A Data Analyzer: Ingests data into a standard format
- Blends Data: Correlates different data sources
- Identifies Duplication: Spots the same data coming in from different sources
- AI-Based Data Analysis: A business intelligence (BI) service
Why do we recommend it?
Zoho Analytics provides an engine for defining data sets to spot ways in which different sources can work together. This process shifts a lot of the analytical work backwards into the data acquisition phase and can reveal insights into the data that might otherwise be missed.

Drawing data from many sources can create duplication and incompatibilities. The Zoho system suggests connections between data sets. These might not always be accurate, because coincidences are common in data. So, the dashboard will present these possible links for approval by the user.
Once the treatment of data has been set up into a model, you can channel new data from the same sources either for offline processing or working on a sliding window of live data. So the tool can also be used for near-live automated analysis, although, typically, BI tools are intended for use for historical analysis.
Who is it recommended for?
Like most BI tools, this system can be used for any data analysis tasks and so would be suitable for any team within a business. Its main market probably lies in budgeting, trend analysis, and marketing insights. The graphics that can be generated with this tool are great for business presentations to illuminate assessments.
Pros:
- A Library of Connectors: Makes sourcing data easy
- AI Processes: Identify links between different data sets
- AI for Trend Analysis: Provides projections
- Data Visualization Graphics: Create your own layouts for data
Cons:
- No Template Library: Slows down the creation of a console
Zoho Analytics is a SaaS platform but you can opt to get it as a software package for Windows, Windows Server, or Linux. The software can also be run on Docker and it is available as a service on AWS and Azure. The price structure is different for the SaaS and on-premises services. There is a free edition for the on-premises version, which is called the Personal plan. You can get a 30-day free trial of the on-premises package or a 15-day free trial for the SaaS option.
3. IBM Cognos Analytics
IBM Cognos Analytics is a business intelligence focused cloud analytics tool that uses Artificial Intelligence (AI) to pull insights from data sets. The platform is web-based and allows you to create dashboards and reports to monitor your environment. Reports can be scheduled and shared to deliver regular updates on the latest data. Both dashboards and reports come with AI recommendations to help you configure the best settings for monitoring your environment.
Key Features:
- Multidimensional Data Cubes: Clickable tables of data
- AI-Based Analytics: Can provide insights and recommendations
- Choice of Representation Methods: Offers graphical widgets for data representation
Why do we recommend it?
IBM Cognos Analytics is a useful offline analysis system. You don’t look through live data with Cognos, instead, you import data into it and so it is a data store as well as a data analysis package. The tool also has AI features but most users will appreciate the choice of data visualizations.
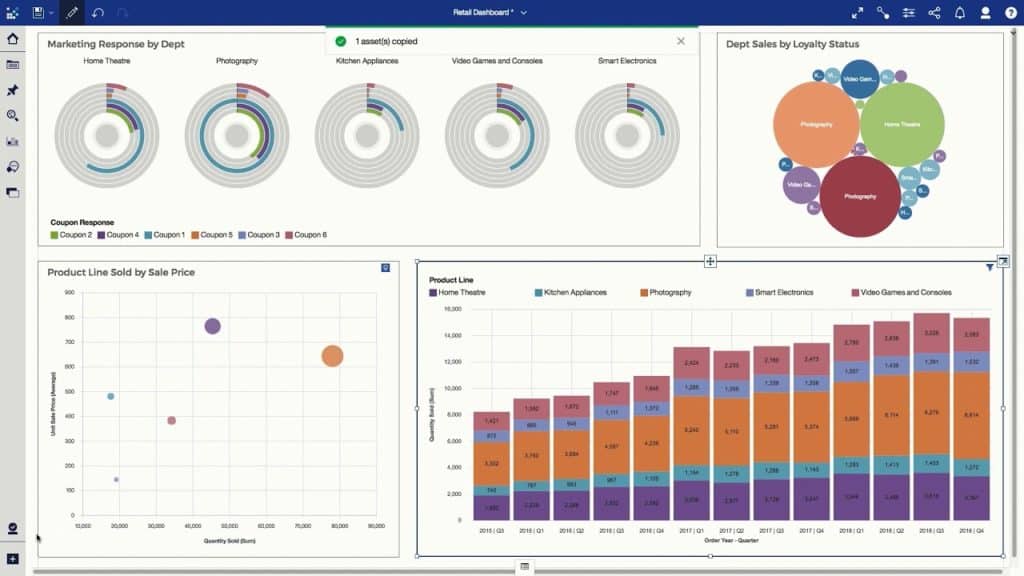
On the dashboard, you have a range of visualization options at your disposal including graphs, dials, and other unique display options that provide you with the essential data at a glance. One such display is the geospatial view which shows you a geographical map of where your services are located. For convenience, when creating a new dashboard you can copy and paste visual displays to create an even stronger monitoring experience.

To supply the platform with data, you can take information from databases on-premises or in the cloud, CSV files, and spreadsheets. The wide range of sources you can import data from is great because it enables you to bring a variety of services into one monitoring platform. You can also use machine learning to automatically discover data sources and add them to your monitoring environment.
Who is it recommended for?
This system is a good option for businesses that want to implement retrospective analysis of activity rather than live monitoring. Cognos creates layers of categorizations that users can select in the created model to see new summaries, so it should be provided to a financial director or a marketing analyst.
Pros:
- Deployment Options: Cloud hosting or self-hosting
- Can Handle Massive Data Sets: Great for enterprises with many sources of data
- Geographical Data Processing: Can show data on a map
Cons:
- Importing Large Data Sets can be Time-Consuming: Doesn’t operate on live data
There are two paid versions of IBM Cognos Analytics to purchase: Cloud and Enterprise. The Cloud version is based in the cloud and starts at $15.00 (£12.36) per user per month. The Enterprise version can be hosted on the IBM cloud or your network. However, you’ll have to contact the sales team directly for a quote. There is also a 30-day free trial.
4. Microsoft Power BI
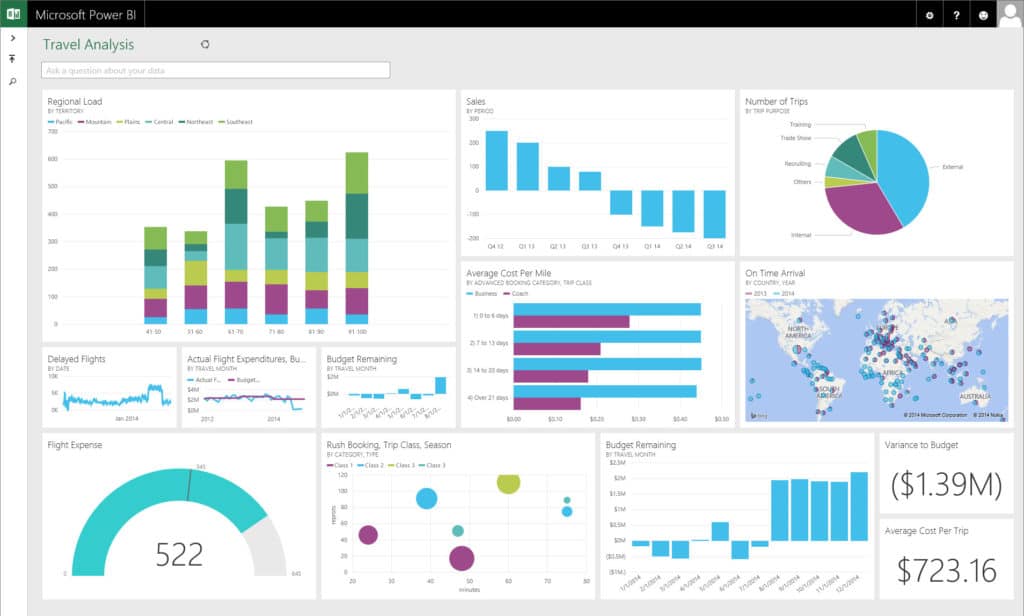
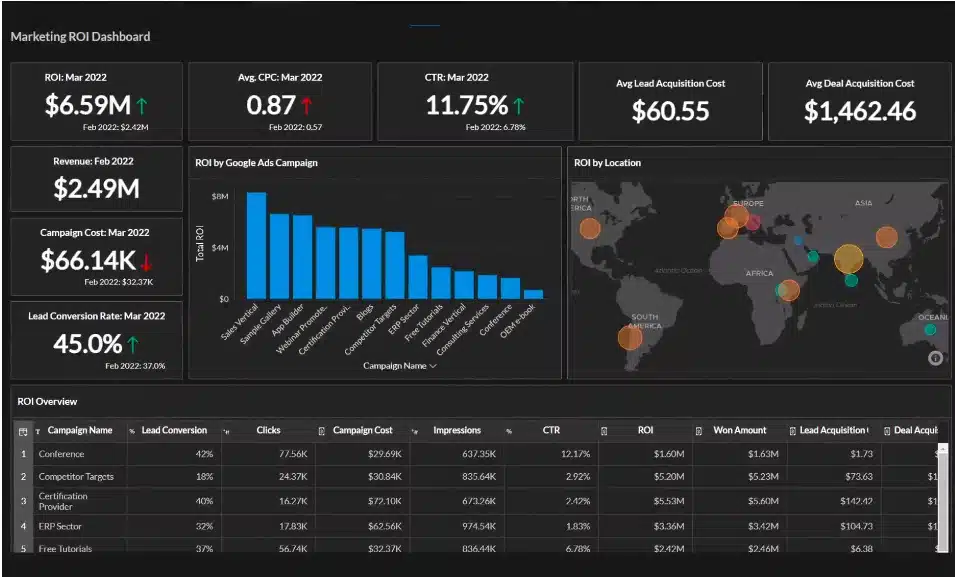
Microsoft Power BI is a business intelligence platform with advanced analytics capabilities. Microsoft Power BI provides you with a dashboard that uses visualization to display key insights taken from your enterprise. The dashboard streams analytics in real-time so that you can make informed decisions on the fly.
Key Features:
- Creates a Data Lake: Works with structured and unstructured data collections
- Integrates with Excel: Import or export data
- Produces Attractive Presentations: Choose your data graphics representation
Why do we recommend it?
Microsoft Power BI is a similar tool to IBM Cognos Analytics. You can use this tool in conjunction with other Microsoft tools, which gives it a big marketing edge over the Cognos system. This service can evolve over time, adjusting parameters and thresholds, which is also possible with the AI features of Cognos.
For more comprehensive analysis you can publish and share reports with other stakeholders in your company. The platform integrates with Excel so that you can connect Excel queries and other data straight to the dashboard.
One of the standout features included with Microsoft Power BI is the ability to use AI to build machine learning models. This means that you don’t have to be a data scientist or analytics expert to pull accurate insights from datasets. Models can be built to manage structured and unstructured data.

Who is it recommended for?
While Cognos includes a data storage system, this tool can work on streams of data fed into it over time. You can use this tool to fence a data collection and provide that to users for analysis or let the tool interpret a constantly changing data set.
Pros:
- Offers Excellent Data Visualization Capabilities: Can show maps and other illustrations through customizable widgets and dashboards
- Updates Insights in Real-Time: Reflects live changes in data
- Generate Reports: Embed PowerBI views in PowerPoint presentations
Cons:
- Requires Training: You need to take a course in order to master this system
There are two versions of Microsoft Power BI available to purchase: Power BI Pro and Power BI Premium. Power BI Pro costs $9.99 (£7.50) per month per user. Power BI Premium costs $4,995 (£3,766.60) with dedicated cloud computing and storage resources. You can download the free version.
5. Board
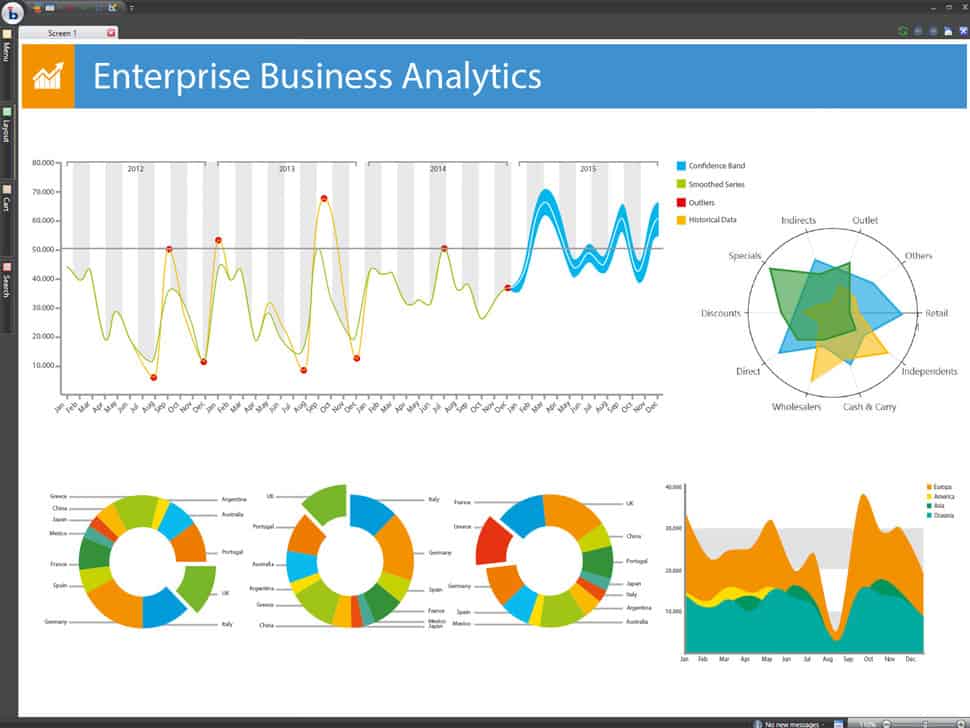
Board is a cloud analytics and business intelligence platform designed with performance management in mind. The software allows the user to create custom planning and analytics applications to improve decision making.
Key Features:
- A Planning Tool: Predictive modeling
- Fast Processing: Hosted on the cloud
- Integration for Microsoft Office: Generate reports in Office formats, such as PowerPoint
Why do we recommend it?
The IBM and Zoho system create data models. Board is more like Microsoft Power BI because it presents data from manual searches rather than providing a specific data storage structure to enhance data access speed. This is a much simpler tool than the above three systems.
The Board BEAM feature uses automated predictive modeling to produce analytics forecasts to identify future business trends. The feature comes with preconfigured statistical functions including frequency, recency, nascency, and dormancy.

To help you find the information you need quickly, Board has a search function. The search function allows you to explore data, metadata, and applications to discover additional information. Running searches is great for locating information without having to sift through the dashboard.
The reporting capabilities of Board are also excellent. Reports can be customized with a drag-and-drop interface. There is also integration with Microsoft Office so you can import datasets directly.
Who is it recommended for?
Board produces its data analyzer in three editions to suit financial, supply chain, and retail sectors. This specialization makes the service easier for non-technical users to employ. This is because the templates and data visualization libraries don’t need to be so large and therefore, are quicker to select from.
Pros:
- Focuses on Data Visualization: Makes key insights stand out
- Operates on Live Data: A report is a template that triggers a search for data to populate fields
- Applicable to Many Business Sectors: Finance, retail, supply chain, sales and HR
Cons:
- No Price List: Must contact sales for pricing
Overall, Board is a tool that is highly recommended for those looking for user-friendly cloud analytics and business intelligence solution. In order to view the price of Board you’ll have to contact the company directly. You can also download the demo version.
6. TIBCO Spotfire
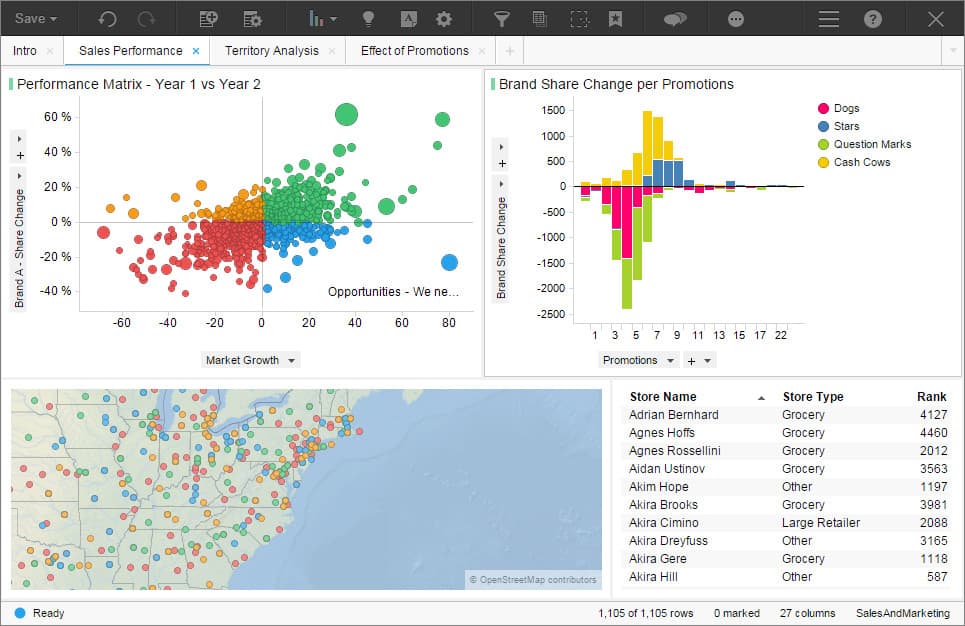
TIBCO Spotfire is an AI-powered advanced analytics tool designed for enterprise users. The analytics capabilities of TIBCO Spotfire range from visual analytics to predictive analytics, location analytics, and streaming analytics. For example, visual analytics provide you with interactive visual displays with graphs whereas predictive analytics forecast future business data.
Key Features
- AI-Based Analysis: Can also calculate forecasts
- Location Identifier Option: Manage geographical data
- Customizable Display Screens: Pick your favorite data representation graphics
Why do we recommend it?
TIBCO Spotfire doesn’t require data to be imported and stored before it can be analyzed. It is able to operate on live data, which can even be in motion. The system can access existing data stores and operate on them without changing or duplicating that original data.
For further customization, TIBCO Spotfire includes APIs to enable you to create customized visualizations, and apps to monitor your enterprise data. There are also out-of-the-box templates to enable you to set up the program quickly. The configuration options are one of TIBCO Spotfire’s greatest assets.

There are four main versions of TIBCO Spotfire to purchase: TIBCO Cloud Spotfire, TIBCO Spotfire Platform, TIBCO Cloud Spotfire Entreprise, and Spotfire for Amazon Web Services.
Who is it recommended for?
TIBCO is very good at high-speed data processing. Essentially, this is more of a very sophisticated reporting tool. As such, this is a high-end tool that would be beyond the budgets of small businesses. A metered service for the analysis of AWS-hosted data is more affordable.
Pros:
- Offers Out-of-the-Box Templates: Makes it easy to get started quickly
- API Library: Connects to many applications to channel data
- Trend Analysis: Clarifies patterns in data
Cons:
- No Price List: You have to speak to a sales consultant
To view the price for TIBCO Spotfire Platform and TIBCO Cloud Spotfire Enterprise you’ll have to contact the sales team directly. TIBCO Cloud Spotfire ranges from $25 (£20.60) per month to $125 (£103) per month. Spotfire for Amazon Web Services starts at a price of $0.99 (£0.82) per hour. You can download the 30-day free trial.
7. Domo
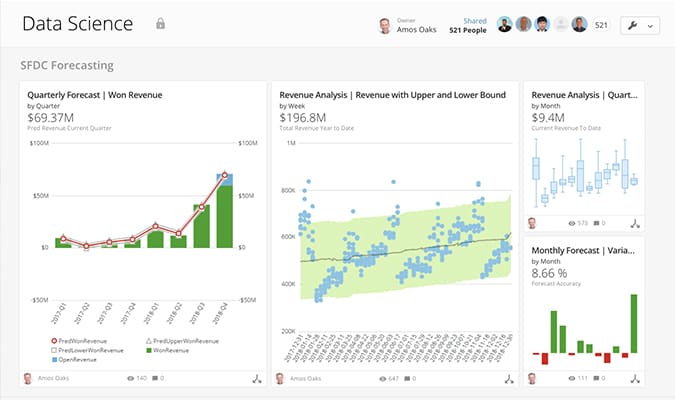
Domo is a cloud analytics software platform designed to integrate data from external sources and visualize it in one location. Domo pulls data from external service providers such as Microsoft Excel, Xero, Facebook, Salesforce, AWS, MySQL, and more. All integrated data is automatically updated so that you see up-to-the-minute information and “one living source of truth.”
Key Features:
- Can Gather Data from all the Major Cloud Platforms: Continues to gather live updates
- Attach SQL or Excel Backends: Mine static data
- Combine Data Sources: Construct workflows around data analysis
Why do we recommend it?
Domo is an interactive system that can access data in its present location without needing those records to be duplicated and restored within the tool. In fact, the system can read in data, process it and then save transformed data to other locations. The tool can blend data from multiple sources.
The dashboard is customizable so you can choose which part of the screen shows what data. To customize the dashboard all you need to do is drag cards into the location you want. You can also use out-of-the-box templates if you want to save time.

You have complete control over the data you see in Domo. Magic ETL allows you to sequence and combine data sources with a drag-and-drop interface. For example, you can join data from MySQL and Excel. Another perk of this setup is that you don’t have to learn SQL to interact with your datasets. You can also deploy custom R or Python scripts if you want to add additional analytics functions like forecasting.
Who is it recommended for?
Domo has many use cases, of which cloud data analysis is one. The tool can also be used for task automation and data orchestration. It is possible to use this tool to verify input data or process information between applications. The framework can also be used to create new applications.
Pros:
- Highly Scalable Cloud Solution: Charged by data throughput
- No-Code Data Processing: Create a data processing system without needing to write code
- Uses Drag and Drop Features: Makes constructing analysis templates easy
Cons:
- Plan Descriptions Without Prices: Must contact sales for pricing
Of course, there are also real-time alerts and push notifications to keep you updated on any changes. With apps available for iOS and Android you can stay in the loop no matter where you are. To view the pricing of Domo you’ll have to contact the sales team directly. You can download the 30-day free trial.
Choosing a Cloud Analytics Tool
Depending on your use case, there are a plethora of cloud analytics tools at your disposal. We think the AppOptics offering from SolarWinds will cover most networks types and sizes. Whether you want to martial the business intelligence capabilities of Microsoft Power BI or the performance monitoring prowess of a tool like IBM Cognos Analytics, there are plenty of choices.
When picking out a solution, decide which tool matches your use case the best. If you lack experience with AI but want to use an intelligent platform we recommend Microsoft Power BI as you’ll be able to create machine learning models even if you’re not a data scientist.
Cloud Analytics FAQS
What is a cloud analytics tool?
Cloud analytics tools process activity data that has been extracted from cloud platforms. Usually, you wouldn’t use an analytics tool on live data because data collected over time provides the types of insights that a system manager needs for tasks such as capacity planning, performance analysis, and market testing.
Which tools are used for analytics?
There are many tools available on the market for cloud analytics, but we recommend:
- AppOptics Custom Metrics and Analytics EDITOR’S CHOICE
- IBM Cognos Analytics
- Microsoft Power BI
- Zoho Analytics
- Board
- TIBCO Spotfire
- Domo
Is SQL a data analysis tool?
SQL is a query language for relational databases and it is certainly very powerful for data analysis. Many cloud analytics tools that present a GUI interface with buttons to access functions might actually be a rational database with SQL queries set up as triggers on those buttons behind the scenes.
