
Google Cloud Platform (GCP) is a comprehensive cloud computing environment that allows organizations to build, run, and scale applications across a global network of data centers. Its suite of services spans computing, storage, networking, machine learning, data analytics, and developer tools, offering the flexibility to support diverse workloads and modern business needs.
Among GCP’s primary services are Compute Engine, which provides scalable virtual machines; App Engine for deploying serverless applications; Cloud Storage for durable and secure data storage; and BigQuery, a managed platform for running fast, large-scale analytics. Its AI and ML capabilities, such as Vertex AI, help companies leverage data for predictive modeling, automation, and intelligent decision-making. Networking solutions like Cloud Load Balancing and Cloud CDN ensure high availability and low-latency delivery of applications worldwide.
Keeping GCP workloads running smoothly requires effective performance monitoring. Metrics like CPU load, memory usage, and network throughput are critical for identifying bottlenecks, resource overuse, or potential downtime. Google Cloud Monitoring and Cloud Logging provide actionable, real-time insights into system operations, allowing teams to detect and address issues quickly.
Proactive monitoring also supports cost management by highlighting underused resources or inefficiencies, helping organizations optimize their cloud spend. By combining these monitoring tools with alerting and reporting, businesses can maintain high performance, ensure security, and meet regulatory compliance requirements.
Using GCP’s monitoring ecosystem, or complementing it with third-party solutions, enables companies to operate resilient cloud infrastructures, deliver reliable services to users, and scale their applications efficiently as demand grows.
Here is our list of the best GCP monitoring tools:
- Site24x7 GCP Monitoring EDITOR’S CHOICE A comprehensive monitoring tool for all GCP services that can simultaneously monitor services of other cloud platforms plus on-site systems. This is a cloud-based service. Start a 30-day free trial.
- ManageEngine Applications Manager (FREE TRIAL) An on-premises software package that monitors applications, virtualizations, services, and servers on-site or on the cloud. Available for Windows Server and Linux. Start a 30-day free trial.
- Paessler PRTG (FREE TRIAL) A collection of network, server, and application monitors that includes cloud service monitoring. Available for installation on Windows Server or as a cloud-based service. Start a 30-day free trial.
- Datadog Infrastructure A cloud-based package of monitoring tools for applications, virtual environments, services, and server resources that includes a plug-in for GCP monitoring.
- Dynatrace A cloud-based monitoring system for applications and services that includes AI technology to track the performance of cloud services including GCP.
- Opsview A monitoring system for servers and applications. This tool is able to monitor all resources whether they are on-premises or in the cloud and it has a special extension for the Google Cloud Platform. It installs on Linux or is available as a cloud-based service.
The Best Google Cloud Platform monitoring tools
It is very rare for a business to only have GCP infrastructure and no other IT resources. Unless you are one of those few all-GCP businesses, you have a lot of other technology that you need to monitor.
We didn’t focus on tools that only monitor GCP for this review. Having to use several different monitoring systems to cover all of your IT systems is a waste of time and money. Modern systems are interconnected and the applications that you use on Google or the Compute Engine cloud storage accounts will feed through to other services on the cloud and on your site. You need to be able to trace through all the connected hardware and software that your business uses so that you can get an overview of all of your resources connected together.
In the search for useful monitoring tools, we looked at systems that had excellence in GCP monitoring as part of a wider IT resource monitoring service.
Our methodology for selecting a GCP monitoring system
We reviewed the market for Google Cloud Platform monitoring tools and analyzed the options based on the following criteria:
- The ability to integrate with the activity reporting functions of the GCP platform
- Application dependency mapping
- Infrastructure monitoring
- Live activity tracking and stored event data for capacity planning
- Alerts and notifications for performance problems
- A free trial or a demo package that creates an opportunity to test the system before paying
- Good value for money from a monitoring tool that saves time and is offered at a reasonable price
Using this set of criteria, we looked for Google Cloud Platform monitoring systems that are able to monitor other resources as well, providing a central console for all infrastructure monitoring.
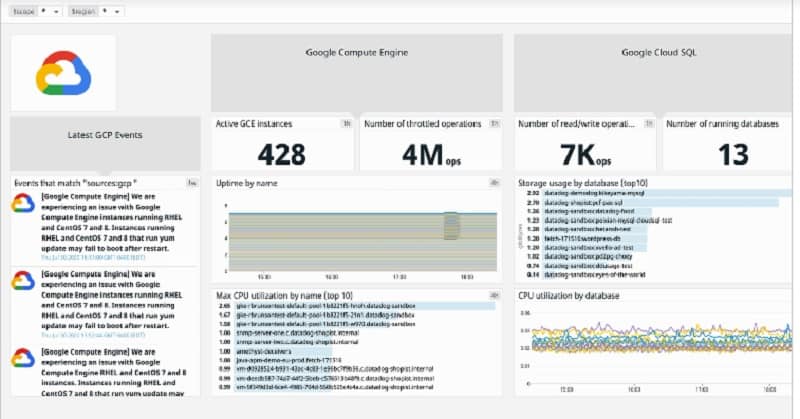
1. Site24x7 GCP Monitoring (FREE TRIAL)

Site24x7 GCP Monitoring specializes in monitoring cloud infrastructure and services but it can also track the performance of on-premises applications and their hosts. This tool is able to thread together the connections between all of your infrastructure, so you will see how your GCP services interact with other resources.
Key Features:
- Multi-Cloud Tracking: Monitors GCP, AWS, and Azure services.
- Comprehensive Monitoring: Tracks platforms, databases, IAM, and containers.
- On-Site System Monitoring: Also monitors the performance of on-premises systems.
- Autodiscovery: Automatically detects and monitors various Google Cloud services.
Why do we recommend it?
Site24x7 GCP Monitoring is delivered from a cloud platform. Site24x7 plans include a range of monitoring systems, which include monitoring for networks, servers, cloud systems, and applications. You add on an integration to get details supervision of GCP activity and resource availability. Link together all of the monitors to get full-stack observability.
The system includes an autodiscovery feature and that is able to detect Google Compute Engine (GCE), Google App Engine (GAE), Google Kubernetes Engine, VPC, Cloud IAM, Cloud Audit Logging, Cloud SQL, and BigQuery instances, among others. The system can also track AWS and Azure services.
The Site24x7 Infrastructure service includes AI-based processes to identify the root cause of problems and also to fine-tune performance thresholds. Those thresholds trigger alerts that can be forwarded as notifications by email and SMS. The system also includes an automated remediation service that can kick in with processes that you specify should performance issues occur.
The Site24x7 Infrastructure system is based in the cloud and you access the dashboard through any standard browser. The screens in the console are customizable, which means that you can gather together data in one place, deciding whether data should be shown as lists of statistics or as graphs.
The Infrastructure plan is very flexible. As well as monitoring applications and services, it is able to give you server and network monitoring. An account gets you credits for a number of monitoring functions and you decide where to apply them. You can also add on extra monitoring credits for a fee.
The inclusion of physical asset monitoring means that you can view your entire IT system within the Site24x7 monitor from cloud applications all the way through your network to its performance on endpoints in your offices.
Who is it recommended for?
This system is affordable for small businesses because Site24x7 sizes its base plans with low capacity. Larger businesses pay add-on fees for more capacity. There is no limit to the number and type of assets that the system can monitor. One account can monitor multiple sites.
Pros:
- Wide Coverage: Supports monitoring of Google Cloud services as well as servers and networks.
- User-Friendly Interface: One of the most user-friendly network monitoring tools available.
- Real-Time Insights: Uses real-time data for device discovery and visualization.
- User Monitoring: Bridges the gap between technical issues, user behavior, and business metrics.
- Free Trial Available: Offers a freeware version for testing.
Cons:
- Learning Curve: Requires time to fully learn and utilize all features due to its detailed nature.
The Infrastructure plan is changed for on a subscription and you can experience it on a 30-day free trial.
EDITOR'S CHOICE
Site24x7 GCP Monitoring is our top choice for its comprehensive and versatile monitoring capabilities. This cloud-based tool specializes in monitoring not only Google Cloud Platform (GCP) but also other cloud services like AWS and Azure, along with on-premises systems. Its ability to thread connections between all infrastructure components ensures you get a holistic view of your entire IT environment.
The system’s autodiscovery feature detects various Google Cloud services and offers real-time data for device discovery and network mapping. I personally like the AI-based processes that help in identifying root causes and setting performance thresholds. Customizable dashboards and flexible monitoring credits make it suitable for businesses of all sizes, offering both breadth and depth in monitoring capabilities.
Download: Download a 30-Day Free Trial
Official Site: https://www.site24x7.com/
OS: Cloud-Based
2. ManageEngine Applications Manager (FREE TRIAL)

The ManageEngine GCP Filestore Monitoring module, part of the Applications Manager, monitors applications and servers and is able to supervise cloud resources as well as on-premises systems. The Applications Manager will monitor CPU statistics on your Google Compute Engine account and it also has storage monitoring capability if you subscribe to storage space from GCP.
The service is also able to track virtualization performance and identify the relationships between virtual servers and virtual machines. The ManageEngine system will watch over how your GCP services connect to your on-premises applications and create an application dependency map to facilitate root cause analysis if things go wrong.
Key Features:
- Windows and Linux Support: Runs on both Windows Server and Linux.
- Comprehensive Monitoring: Monitors on-site and cloud systems, including GCP.
- Application Dependency Mapping: Creates maps to facilitate root cause analysis.
- Filestore Management: Monitors GCP Filestore services.
Why do we recommend it?
ManageEngine Applications Manager checks on server resources and platforms as well as the applications that run on them. It will track the activity of GCP accounts and the services that are included in the PaaS structure. If you install your own software on your GCP account, the Applications Manager will monitor them as well.
Applications Manager has an AI system for adjusting performance thresholds. This prevents the system from triggering alerts unnecessarily. Those alerts can be forwarded to you by email, SMS, or Slack notification.
Who is it recommended for?
ManageEngine provides a Free edition for small businesses and that will monitor GCP among the edition’s five asset monitoring allowance. The lowest plan is reasonably priced and accessible to small businesses. Larger business scale up capacity by paying a higher price. There is a multi-site version available as well.
Pros:
- Deployment Flexibility: Offers on-premise and cloud deployment options.
- Interdependency Highlighting: Maps interdependencies between applications to show performance impact.
- Log Monitoring: Tracks metrics like memory usage, disk I/O, and cache status for comprehensive database health monitoring.
- Automatic Detection: Automatically detects databases, server hardware, and devices for real-time asset management.
Cons:
- Feature Complexity: Requires time to fully explore and utilize all features and options.
Applications Manager is an on-premises software package that is available for Windows Server and Linux. There are three editions of Applications Manager: Free, Professional, and Enterprise. The Free version only includes five monitors. The Professional edition is for a single site and the Enterprise edition is suitable for large businesses that require a large volume of monitoring activity. You can test Applications Manager on a 30-day free trial.
3. Paessler PRTG (FREE TRIAL)

Paessler PRTG is a collection of monitors that cover networks, servers, and applications. It is on-premises software, but it is not limited to just monitoring the site on which it is installed. It is also capable of monitoring remote sites and cloud services, such as those supplied by Google Cloud Platform.
Key Features:
- Multi-Site Monitoring: Monitors both on-premises and cloud platforms.
- Connection Performance Checks: Ensures optimal connection performance to cloud services.
- Windows Server Support: Runs on Windows Server.
- Customizable Sensors: Allows creation of custom sensors for specific monitoring needs.
Why do we recommend it?
Paessler PRTG is a flexible package of monitoring services and it includes cloud monitoring systems. This package is better prepared for AWS and Azure monitoring than GCP. However, it is possible to create your own sensor to connect to GCP. The package also includes sensors to check on connections to cloud platforms.
The PRTG system is able to check on the connections to GCP servers and make sure that all of your services are available. When you exploit your GCP services in conjunction with other applications, whether from other cloud services or site-based systems, you can see how they flow together and observe their dependencies.
PRTG has performance thresholds that trip in service quality drops or device capacity gets used up. These trigger alerts, which should buy you time to fix problems and head off potential disaster. The alerts can be sent out as email or SMS notifications.
The PRTG dashboard presents performance metrics as lists of information and also as graphs and charts. The system is customizable because Paessler charges for PRTG in blocks of sensors. The delivered software package includes all capabilities and you decide which sensors to turn on until you have used up the allowance that you bought.
Who is it recommended for?
PRTG is a very large bundle of sensors. You pay for an allowance and then decide which sensors to turn on. This enables you to control costs by eliminating the monitoring services that you don’t need. Paessler offers the system for free if you only activate 100 sensors.
Pros:
- Comprehensive Cloud Support: Supports various cloud environments, making it ideal for multi-cloud setups.
- User-Friendly Interface: Drag-and-drop editor simplifies building custom views and reports.
- Flexible Integration: Easily integrates with helpdesk systems and third-party messaging platforms.
- Customizable Monitoring: Highly customizable sensors allow tailored monitoring solutions.
- Freeware Version Available: Robust freeware version available for up to 100 sensors.
Cons:
- Technical Focus: Designed for network professionals, which may not be ideal for non-technical users.
PRTG is available for installation on Windows Server and there is also a version available as a cloud-hosted service. You can get the on-premises version on a 30-day free trial that includes all sensors activated.
4. Datadog Infrastructure
Datadog Infrastructure is able to monitor cloud-based resources and also on-premises infrastructure. It examines the exchanges between those applications and services that support your user-facing software back down to the hosting server. The system is based in the cloud, so it isn’t restricted to monitoring services on one site. It is able to monitor cloud-based servers and services just as easily.
Key Features:
- GCP Integration: Integrates seamlessly with Google Cloud Platform.
- Multi-Cloud Monitoring: Also monitors AWS and Azure services.
- On-Site Resource Monitoring: Provides comprehensive monitoring for on-premises infrastructure.
- Forecasting Capabilities: Supports forecasting for capacity planning and system migrations.
Why do we recommend it?
Datadog Infrastructure is a cloud-based package and it is a close competitor of the Site24x7 platform. The Infrastructure plan is the core monitoring system of the Datadog platform because it can be expanded by integrations. It monitors some applications, such as Web servers and it includes an integration for GCP.
The Datadog system is marketed as a standard package but it also has a library of integrations. These are free extensions to the system that add on extra sensors and also new screens in the system dashboard. There is an integration for Google Cloud Platform, so you can be sure that this monitoring system is very well set up to help you manage your GCP services.
As well as showing performance data live, the Datadog system collects metrics and stores them for capacity planning and other historical analysis tasks. The dashboard supports forecasting for planning and the system is also useful for parallel execution for comparison between systems when planning system migrations to the cloud. This ability applies to all of the services that the system monitors.
Who is it recommended for?
Those looking for a cloud-based monitoring platform will likely trial both Datadog and Site24x7 side by side. The Datadog system prices its modules individually, whereas Site24x7 creates bundles. If you need to get a full-stack monitoring system, Site24x7 probably offers a better deal. For individual modules, you would prefer Datadog.
Pros:
- Cloud Environment Monitoring: Offers out-of-the-box monitoring for various cloud environments including Google Cloud and Azure.
- User-Friendly Interface: Features an excellent and easy-to-use interface.
- Holistic View: Monitors both internal and external systems, providing a complete view of network performance and accessibility.
- Scalable Pricing: Allows businesses of any size to scale their monitoring efforts with flexible pricing options.
Cons:
- Short Trial Period: A longer trial period would be beneficial for thorough testing.
The Datadog Infrastructure service is charged for by subscription and there are three editions: Free, Pro, and Enterprise. The Free plan is limited to monitoring five hosts and it has a one-day data retention period. The Pro edition includes most of the monitoring services that you will need for GCP but advanced, AI-based features are reserved for the Enterprise edition. You can get a 14-day free trial of either of the paid plans.
5. Dynatrace
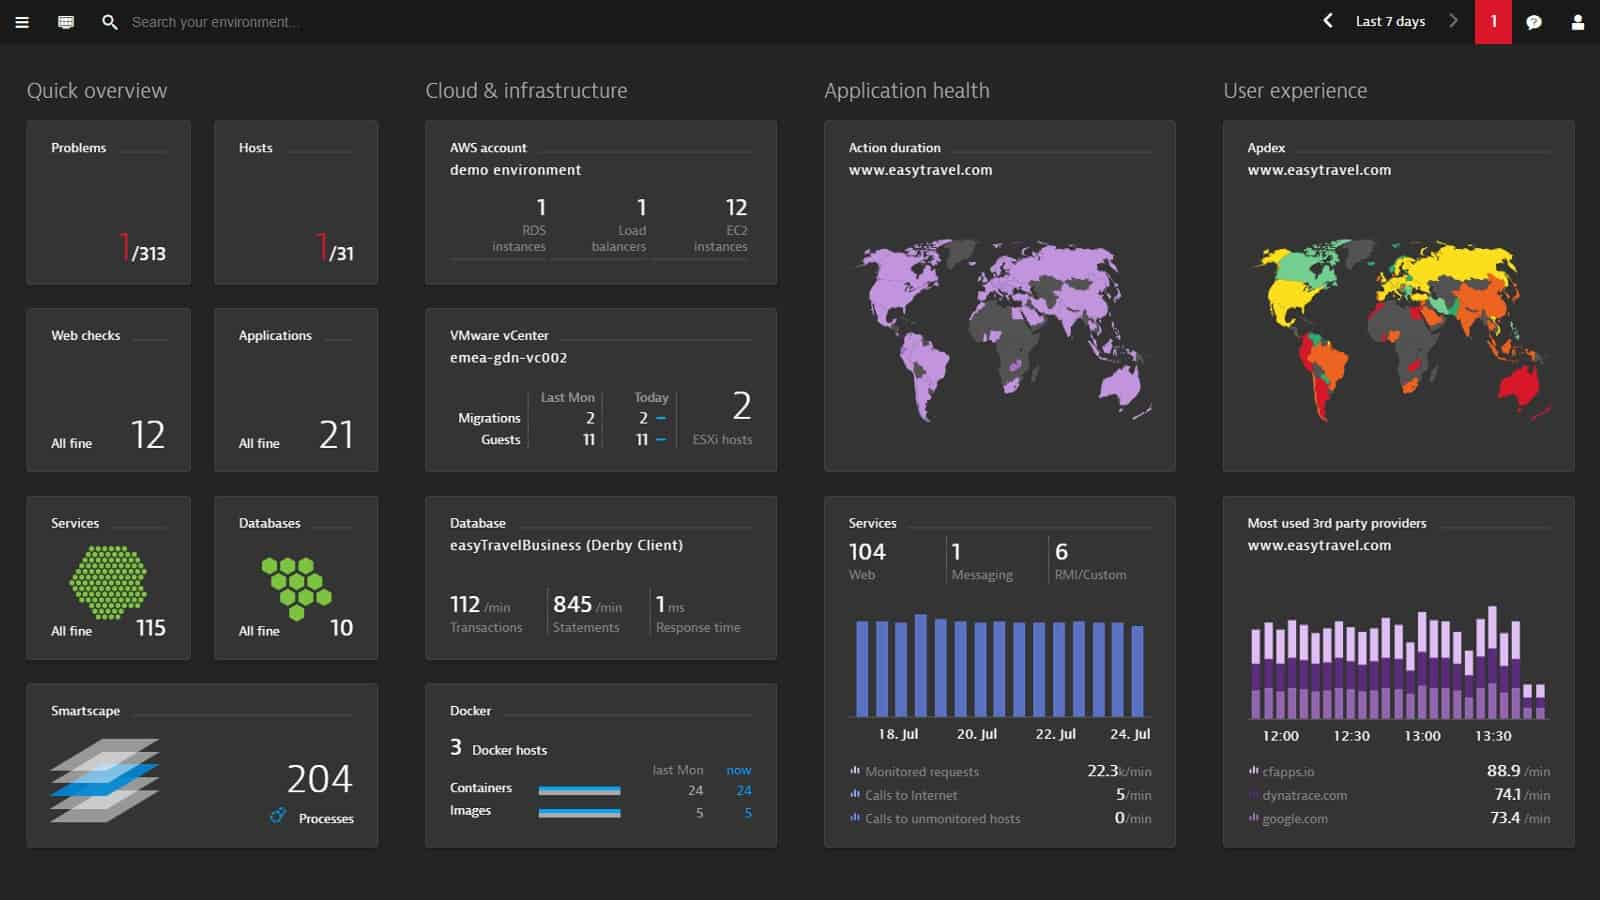
Dynatrace is a monitoring system for applications and services that are located on-site or in the cloud and it particularly excels at monitoring Google Cloud Platform. The company is a Google Partner and has been able to produce a system that is fully integrated into GCP.
Key Features:
- GCP Monitoring: Strong capabilities for monitoring Google Cloud Platform.
- Multi-Cloud Support: Also monitors AWS and Azure services.
- Full-Stack Observability: Monitors both infrastructure and applications.
- AI-Driven Automation: Utilizes AI for setup, performance baselining, and root cause analysis.
Why do we recommend it?
Dynatrace is very similar to AppOptics. The big difference is that this monitoring system is delivered from the cloud and it includes AI processes to interpret resource demands. Like AppOptics, you can opt for just an infrastructure monitoring service or get full-stack observability from a higher plan that adds on application monitoring.
This innovative monitoring service is itself delivered from the Cloud. Dynatrace is able to collect operating statistics from the platform and it also gathers user experience statistics, which can be another source of indications of system problems.
The Dynatrace system includes a lot of AI-driven automation. That includes the setup phase for the software. It scans your GCP accounts and registers all of the facilities that you subscribe to. It then assembles application dependency maps and identifies other internal structures, such as virtualization operations.
The application dependency maps put all research in place so that, if a performance issue arises somewhere in the system, the root cause analysis module of the monitor can quickly identify where problems are based.
Dynatrace also uses AI for performance baselining. This establishes a normal level of operation and is a standard against which the system can judge problems. Any deviation from standard performance raises an alert and triggers system investigation. The Dynatrace system automates as much of the monitoring tasks as possible.
The overview that Dynatrace gives of your system stretches out beyond Google Cloud Platform as it links up with all of your subscriptions for services like AWS and Azure. It is also able to include any applications and services that you host on your own servers.
Who is it recommended for?
Dynatrace provides an unusual billing rate because it is priced per hour. The system is charged per server per hour with the Full-Stack Monitoring plan sized for 8GiB servers. The plan is double the price of the Infrastructure Monitoring edition. You get GCP monitoring in that package and it is affordable for businesses of all sizes.
Pros:
- Comprehensive Cloud Monitoring: Excels at monitoring complex Google Cloud and hybrid cloud environments.
- Customizable Interface: Features a sleek, customizable interface ideal for Network Operations Centers (NOCs).
- Real-Time Monitoring: Provides real-time LAN and WAN monitoring, supporting virtual environments.
- AI Trend Detection: Leverages AI to detect performance trends and monitor baseline performance.
Cons:
- Enterprise Focus: Better suited for larger networks and enterprise organizations.
- Short Trial Period: A longer trial period would be beneficial for thorough testing.
Dynatrace is charged for by subscription at a rate per hour. The service is offered in a number of plans and to get monitoring for GCP you would need to consider the Full-stack Monitoring and Infrastructure Monitoring packages. You can get a 15-day free trial to assess the system for yourself.
6. Opsview
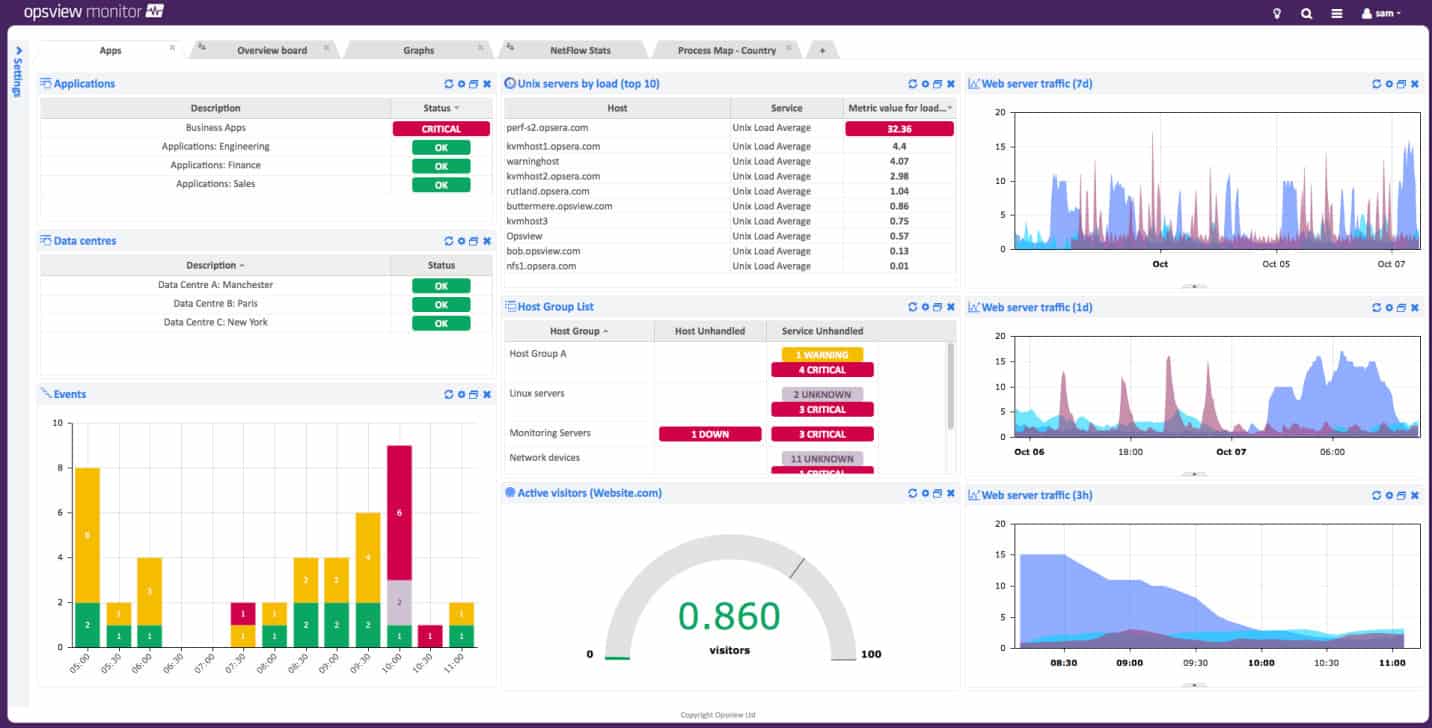
Opsview is able to present a single view of hybrid systems, monitoring resources anywhere, including cloud platforms. The standard monitoring bundle of Opsview can be extended by plugins, called opspacks. There is an opspack for GCP. It is free and it adds on extra sensors and new screens to the core Opsview service.
Key Features:
- Opspack Extension for GCP: Adds extra sensors and new screens specifically for Google Cloud Platform.
- Comprehensive Resource Monitoring: Monitors storage, processors, and databases on GCP.
- Connection Mapping: Maps connections between resources for detailed dependency tracking.
- Hybrid System Monitoring: Presents a single view of both on-premises and cloud resources.
Why do we recommend it?
Opsview is a similar package to the Datadog Infrastructure and Site24x7 platforms because it provides infrastructure monitoring from the cloud and it is also a rival to AppOptics because it can be run on premises. This system has an expansion for GCP monitoring and will track compute, storage, and database facilities.
The GCP opspack gives you monitoring capabilities for Compute Engine, Cloud Storage Buckets, and Cloud SQL Database instances. These functions are in addition to all of the other system monitoring features in the standard areas of the Opsview service.
The Opsview service searches through applications like a Web crawler and passes across sites and through different cloud platforms to string together an application dependency map. The system is particularly strong at chaining back from websites through services and APIs to get a full picture of the entire backend that supports those sites.
The system is able to identify virtual systems and map connections there, such as the relationship between virtual servers and virtual machines.
Who is it recommended for?
Opsview doesn’t publish its price list, which makes it difficult for small businesses to assess its suitability. This system is offered as a cloud platform and also for on premises installation on Linux. The ability to expand the package with free plug-ins makes it very flexible.
Pros:
- Versatile Monitoring: Supports server, application, and cloud monitoring across multiple platforms.
- Simple GCP Integration: Easily integrates Google Cloud through a free opspack extension.
- Flexible Deployment: Available as a cloud platform or for on-premises installation on Linux.
- Free Version Available: Offers both free and paid versions for different needs.
Cons:
- GCP Focus: Not the best option for enterprises heavily relying on Google Cloud.
Opsview is offered in three versions. There is the SMB plan for small businesses and the Enterprise plan for large organizations. Both of those versions install on Linux servers. There is also the Opsview Cloud plan, which is hosted. You can get a demo of the cloud service.
Google Cloud Platform monitoring FAQs
Is a monitoring service provided by Google Cloud Platform?
You get an account management console with a GCP subscription but that doesn’t offer monitoring. The Google Cloud App is a mobile app that includes monitoring and alerting services. For a fully comprehensive monitoring package, you need to subscribe to Google Operations Suite, which includes a Cloud Monitoring service for GCP, AWS, and Azure.
Why is Google monitor important?
Monitoring GCP performance is important so that you can be sure that you have subscribed to the right capacity of service or that those expandable resources are not running up the tab unexpectedly.
What are the best practices for monitoring?
The key to successful monitoring is to use an automated tool. Even if you only have one system to monitor, you can’t sit and watch it all the time that it is turned on and if you have cloud services, you would need to watch them around the clock because they are always active. Automated tools include alerts for problems, so you can assume that everything is running smoothly unless you are notified otherwise.
