For years, network administrators have used HWMonitor from CPUID to manage their physical infrastructure, look for performance issues, and troubleshoot
Operational hardware is the bare minimum you need to stay productive throughout the working day. However many enterprises are failing to monitor their hardware sufficiently. Amongst conscientious enterprises, the hardware monitoring tool HWMonitor is a household name but even so, at scale, it runs into limitations.
Here is our summary list of the best alternatives to HWMonitor:
- Paessler PRTG Network Monitor EDITOR’S CHOICE This tool monitors networks, servers, and applications. On servers, it covers all hardware statuses and includes alerts for out-of-bounds conditions. Start a 30-day free trial.
- Atera (FREE TRIAL) A system monitoring and management package aimed at managed service providers. Start a 30-day free trial.
- ManageEngine OpManager (FREE TRIAL) A network monitor that uses SNMP to keep tabs on the statuses of network devices. Available in Windows Server and Linux versions. Start a 30-day free trial.
- Site24x7 (FREE TRIAL) This cloud-based monitoring platform includes sensors for tracking server health and an SNMP function that checks the status of components on network devices. Get a 30-day free trial.
- WiNFO An infrastructure monitoring tool that covers hardware statuses. Runs on Windows.
- AIDA64 A hardware monitor for Windows that is available in four editions.
- SysGauge A lightweight hardware performance monitor that runs on Windows. Available in free and paid editions.
- PA Server Monitor A monitoring tool for Windows Server, and Linux operating systems. Priced per monitored device.
- Open Hardware Monitor A lightweight, free server monitor that is available for Windows and Linux.
- Progress WhatsUp Gold A network monitor that includes device status monitoring. Can be extended to include server monitoring.
What is HWMonitor?
HWMonitor is a free hardware monitoring program that monitors the speed, voltage, temperature, fans of PCs connected to your network. The tool can tell if a device is overheating or performing poorly. HWMonitor is designed to work with ARM processes from popular providers like AMD, Intel, and VIA.

Performance data is displayed in a list table format, that shows health sensors with the data recorded from connected devices. All you need to do to find the performance data you’re looking for is to scroll down to the relevant section.
For visualizations, there is a Graphs Generator that automatically creates graphs of usage data which is saved to a log folder. You can interact with the size of graphs by clicking on Option. While this isn’t as sophisticated as some other proprietary products it does help give you a top-down perspective.
Why use HWMonitor?
The main reason you should use HWMonitor is that it is lightweight. The basic layout of the table design makes it easy to scroll and find the data you need. You won’t get lost or sidetracked by other features. It is relatively easy for you to view all the hardware information you need on-screen without too much searching.

Another good reason to use HWMonitor is that it is updated regularly. While many tools CPU monitoring tools are updated inconsistently HWMonitor has new updates every few months. Regular patches help to tighten up the monitoring experience and eliminate bugs found by users.
Beyond the technical abilities of HWMonitor the low price point is another reason to consider the tool. The standard version of HWMonitor is available for free, putting it in the reach of SME’s and larger organizations. However, there is a Hardware Monitor Pro version that includes additional logging capabilities, remote operation, and graphing. The price of HWMonitor Pro is $22.40 (£17.69) for 10 remote connections and $39.33 (£31.05) for up to 20 remote connections.
HWMonitor limitations
The only issue with HWMonitor is that it only shows you data points like temperatures, voltages, and frequencies. It doesn’t have the depth of monitoring features that other competitor tools have. Similarly, it doesn’t have the production value or visualization features that some other popular hardware monitoring providers have.
So we’ve had a look at the best alternatives and ranked them according to their feature and benefits, ease of use, and overall performance.
The best HWMonitor alternatives
Our methodology for selecting an HWMonitor alternative
We reviewed the market for systems like HWMonitor and tested tools based on the following criteria:
- A system that can extract hardware status data from network equipment and computers
- Monitors for temperature and fan speed
- Continuous status tracking
- Nice to have the ability to read data from the motherboard
- Options for hardware monitoring integrated into operations monitoring
- An opportunity to try out the package without paying thanks to a free trial or a demo session
- A good deal from a tool that provides a useful set of functions at a suitable price
1. Paessler PRTG Network Monitor (FREE TRIAL)
Paessler PRTG Network Monitor is a network monitoring tool that can also monitor hardware. With PRTG Network Monitor you can monitor the CPU, RAM, and hard drives of network devices. Devices that the tool monitors include computers, switches, routers, and printers. The tool pings devices in your network to assess response time and availability. The tool is thus a good choice if you want to monitor the performance of a wide-cross section of devices connected to your network.
Key Features:
- A range of hardware sensors
- Network, server, and application monitoring
- Performance alerts
- Network mapping
- Device status tracking
Why do we recommend it?
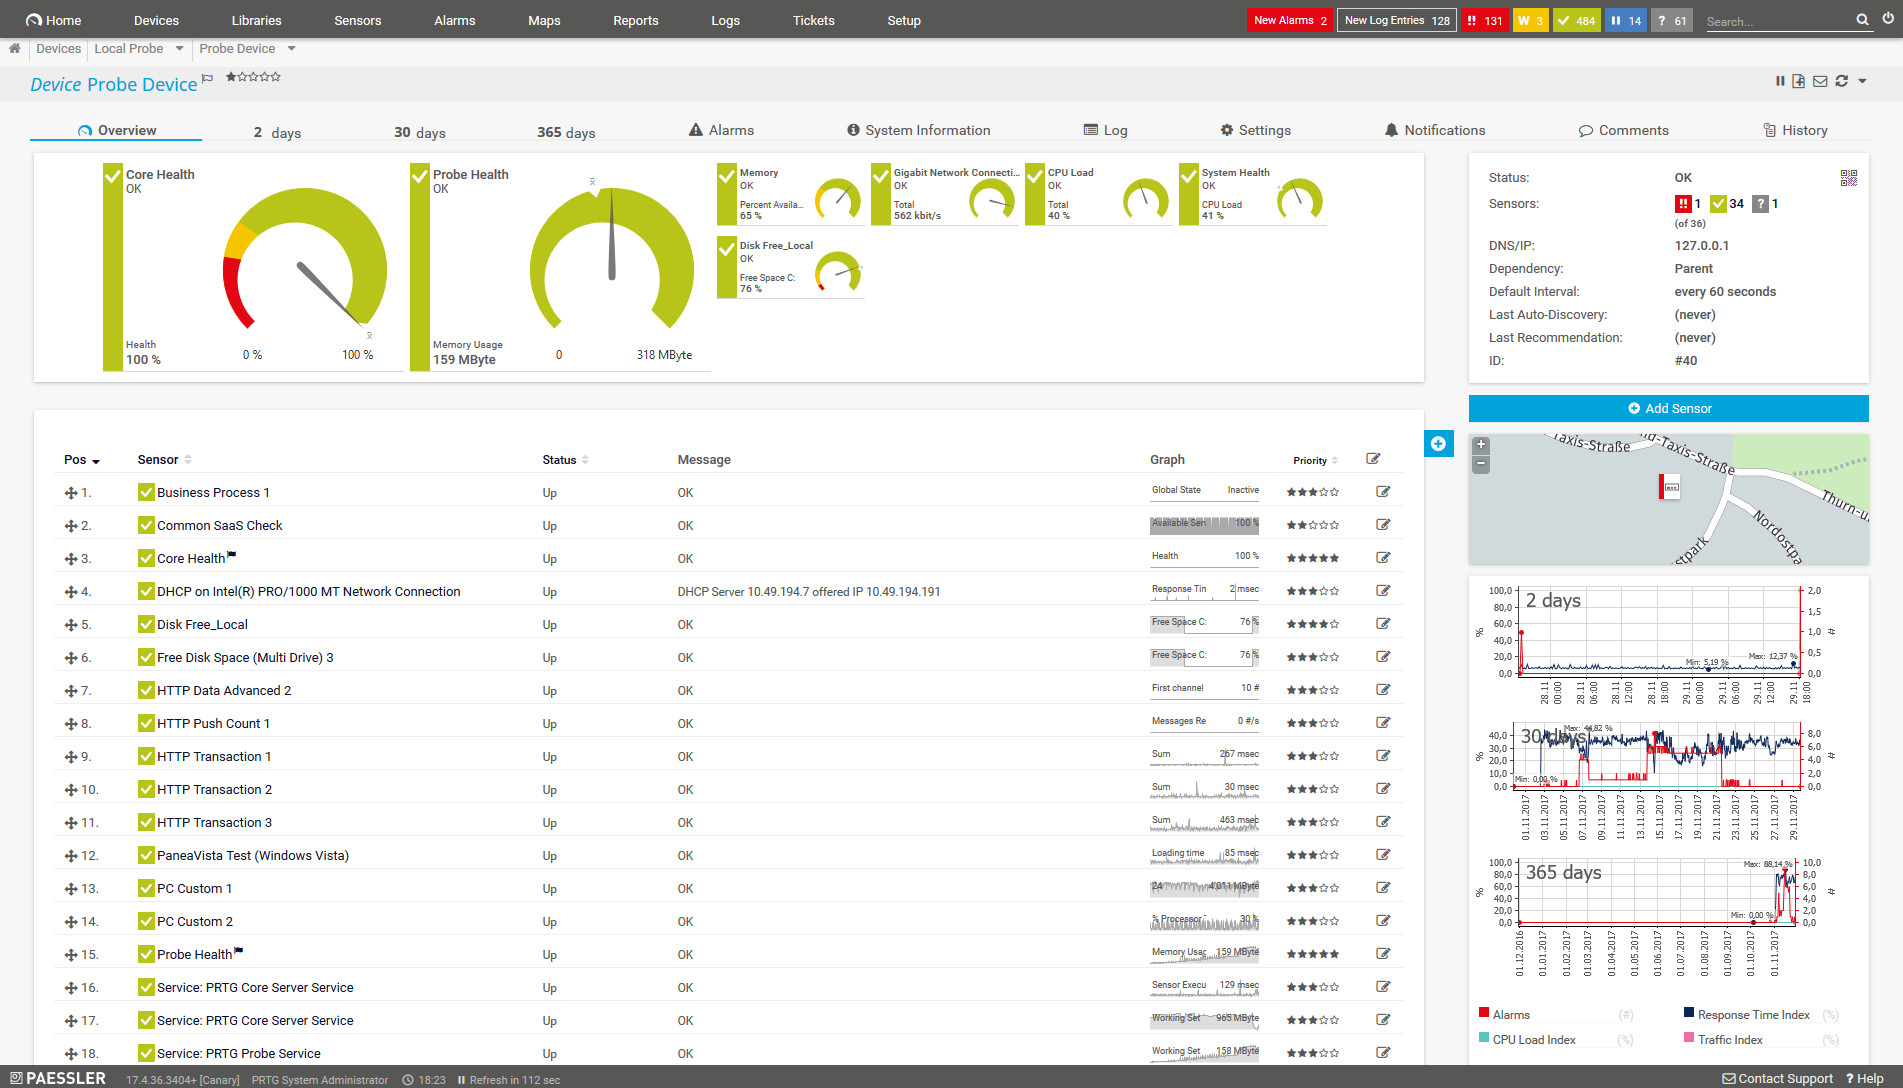
Paessler PRTG Network Monitoring is a bundle of monitoring tools and the package includes sensors that collect data on the physical statuses of server hardware. Check on CPU temperature, fan status, power source, and battery status, and server room humidity. This package will also track server resource availability and application activity.
The alerts system on PRTG Network Monitor is exceptional. Sensors can be customized to notify you if a device is experiencing performance issues or outright fails. Notifications are sent as emails, text messages, and push notifications. Push notifications are available for Android and iOS devices so that you are always aware of current developments.
PRTG “Core service” is available on Microsoft Windows 2012 R2, 2016, 10, 8, 2008 R2, and 2008. For cash-strapped SME’s PRTG Network Monitor is a good choice because it uses a scalable pricing model. The product is free for monitoring with less than 100 sensors.
Who is it recommended for?
The PRTG system is suitable for businesses of all sizes. The package can be tailored to monitor the technologies that each buyer has, so no one has to pay for features that they are never going to use. PRTG runs on Windows Server and it can monitor the hardware of other servers across the network.
Pros:
- Uses a combination of packet sniffing, WMI, and SNMP to report network performance data
- Fully customizable dashboard is great for both lone administrators as well as NOC teams
- Drag and drop editor makes it easy to build custom views and reports
- Supports a wide range of alert mediums such as SMS, email, and third-party integrations into platforms like Slack
- Supports a freeware version, great for small businesses
Cons:
- Is a very comprehensive platform with many features and moving parts that require time to learn
Paid versions of PRTG Network Monitor start at $1600 (£1,263) for 500 sensors and go up to $60,000 (£47,369) for unlimited sensors with 5 server installations. You can download the 30-day free trial.
EDITOR'S CHOICE
Paessler PRTG Network Monitor is our top pick for an HWMonitor alternative because this package is highly customizable and offers monitoring units that extend far beyond device hardware sensors. While HWMonitor focuses primarily on monitoring hardware statistics like CPU, GPU, and temperature metrics, PRTG offers a more expansive network monitoring solution. It not only tracks hardware performance but also monitors bandwidth, servers, applications, and network devices in real-time. PRTG’s customizable dashboard enables technicians to focus on specific metrics, enabling IT teams to detect issues before they escalate. Its pre-configured sensors, including SNMP, WMI, and custom sensors, allow for integration with various devices and systems. This versatility makes it ideal for businesses seeking a single tool to monitor all IT infrastructure. One of PRTG’s most appealing features is its alerting system, which notifies users via email, SMS, or push notifications when performance thresholds are breached. This proactive approach minimizes downtime and ensures optimal system performance. Additionally, PRTG offers detailed reports and historical data analysis, helping teams identify long-term trends and plan for future capacity. Another advantage is its scalability, suitable for small businesses and large enterprises alike. The free version supports up to 100 sensors and you can get all of the sensors for free for 30 days on the trial, allowing organizations to test its capabilities.
Download: Get a 30-day FREE Trial
Official Site: https://www.paessler.com/download/prtg-download?download=1
OS: Windows Server or SaaS
2. Atera (FREE TRIAL)

The remote monitoring and management (RMM) functions of Atera cover all hardware on a client’s site, not just endpoints. The tool supports the work of managed service providers (MSPs) and so it includes administration functions as well as monitoring utilities.
Key Features:
- Designed for managed service providers
- Remote monitoring
- Endpoint management
Why do we recommend it?
Atera is a cloud platform of remote monitoring and management tools. This system is able to monitor servers and also networks and applications. Among the hardware monitoring properties of this tool are systems that track CPU and attributes that are reported by SNMP, such as CPU temperature, power source status, and fan activity.
The Atera system is a cloud-based service that includes server time and space for processing and storage, so the MSP that signs up for this package doesn’t need to have any major infrastructure on its own site. The remote systems being monitored do need to have agent software installed, however. The MSPs managers and technicians access the Atera dashboard through any standard web browser. Atera also produces free apps for mobile devices to give access to the system.
The hardware monitoring sections of Atera supervise CPU, memory, and disk space, noting the potential capacity of each and monitoring utilization. Admin functions included in the tool extend to maintenance tasks, such as system backup and restore and disk cleaning and defragmentation. Other controls in the system enable a technician to audit all software on a device, install new service and programs, and shut down and startup servers and endpoints.
Technicians get remote desktop access to endpoints as part of the Help Desk support suite in Atera. This section of the Atera package also includes remote access for system exploration, patch management, and script execution for automated administration and onboarding tasks.
Who is it recommended for?
Atera is available in two versions: for IT departments and for managed service providers. The system’s plans are charged by a subscription per technician., so it is very scaleable and even independent contractors can use it. The package includes a ticketing system to aid notification of problems by users.
Pros:
- Minimalistic interface makes it easy to view the metrics that matter most
- Flexible pricing model makes it a viable option for small businesses
- Includes multiple PSA features, great for helpdesk teams and growing MSPs
- Can track SLAs and includes a time tracking option for maintenance tasks
Cons:
- Is highly focused on MSPs, smaller companies may not be able to utilize the multi-tenant tools available
The Atera system is charged for by subscription with fees applied per technician. The MSP can decide whether to pay for the service monthly or annually – the yearly plan works out cheaper. The subscription model of Atera makes this service very scalable and suitable for MSPs of any size. Pricing starts at $129 per technician. You can check out the features of Atera with a free trial.
3. ManageEngine OpManager (FREE TRIAL)
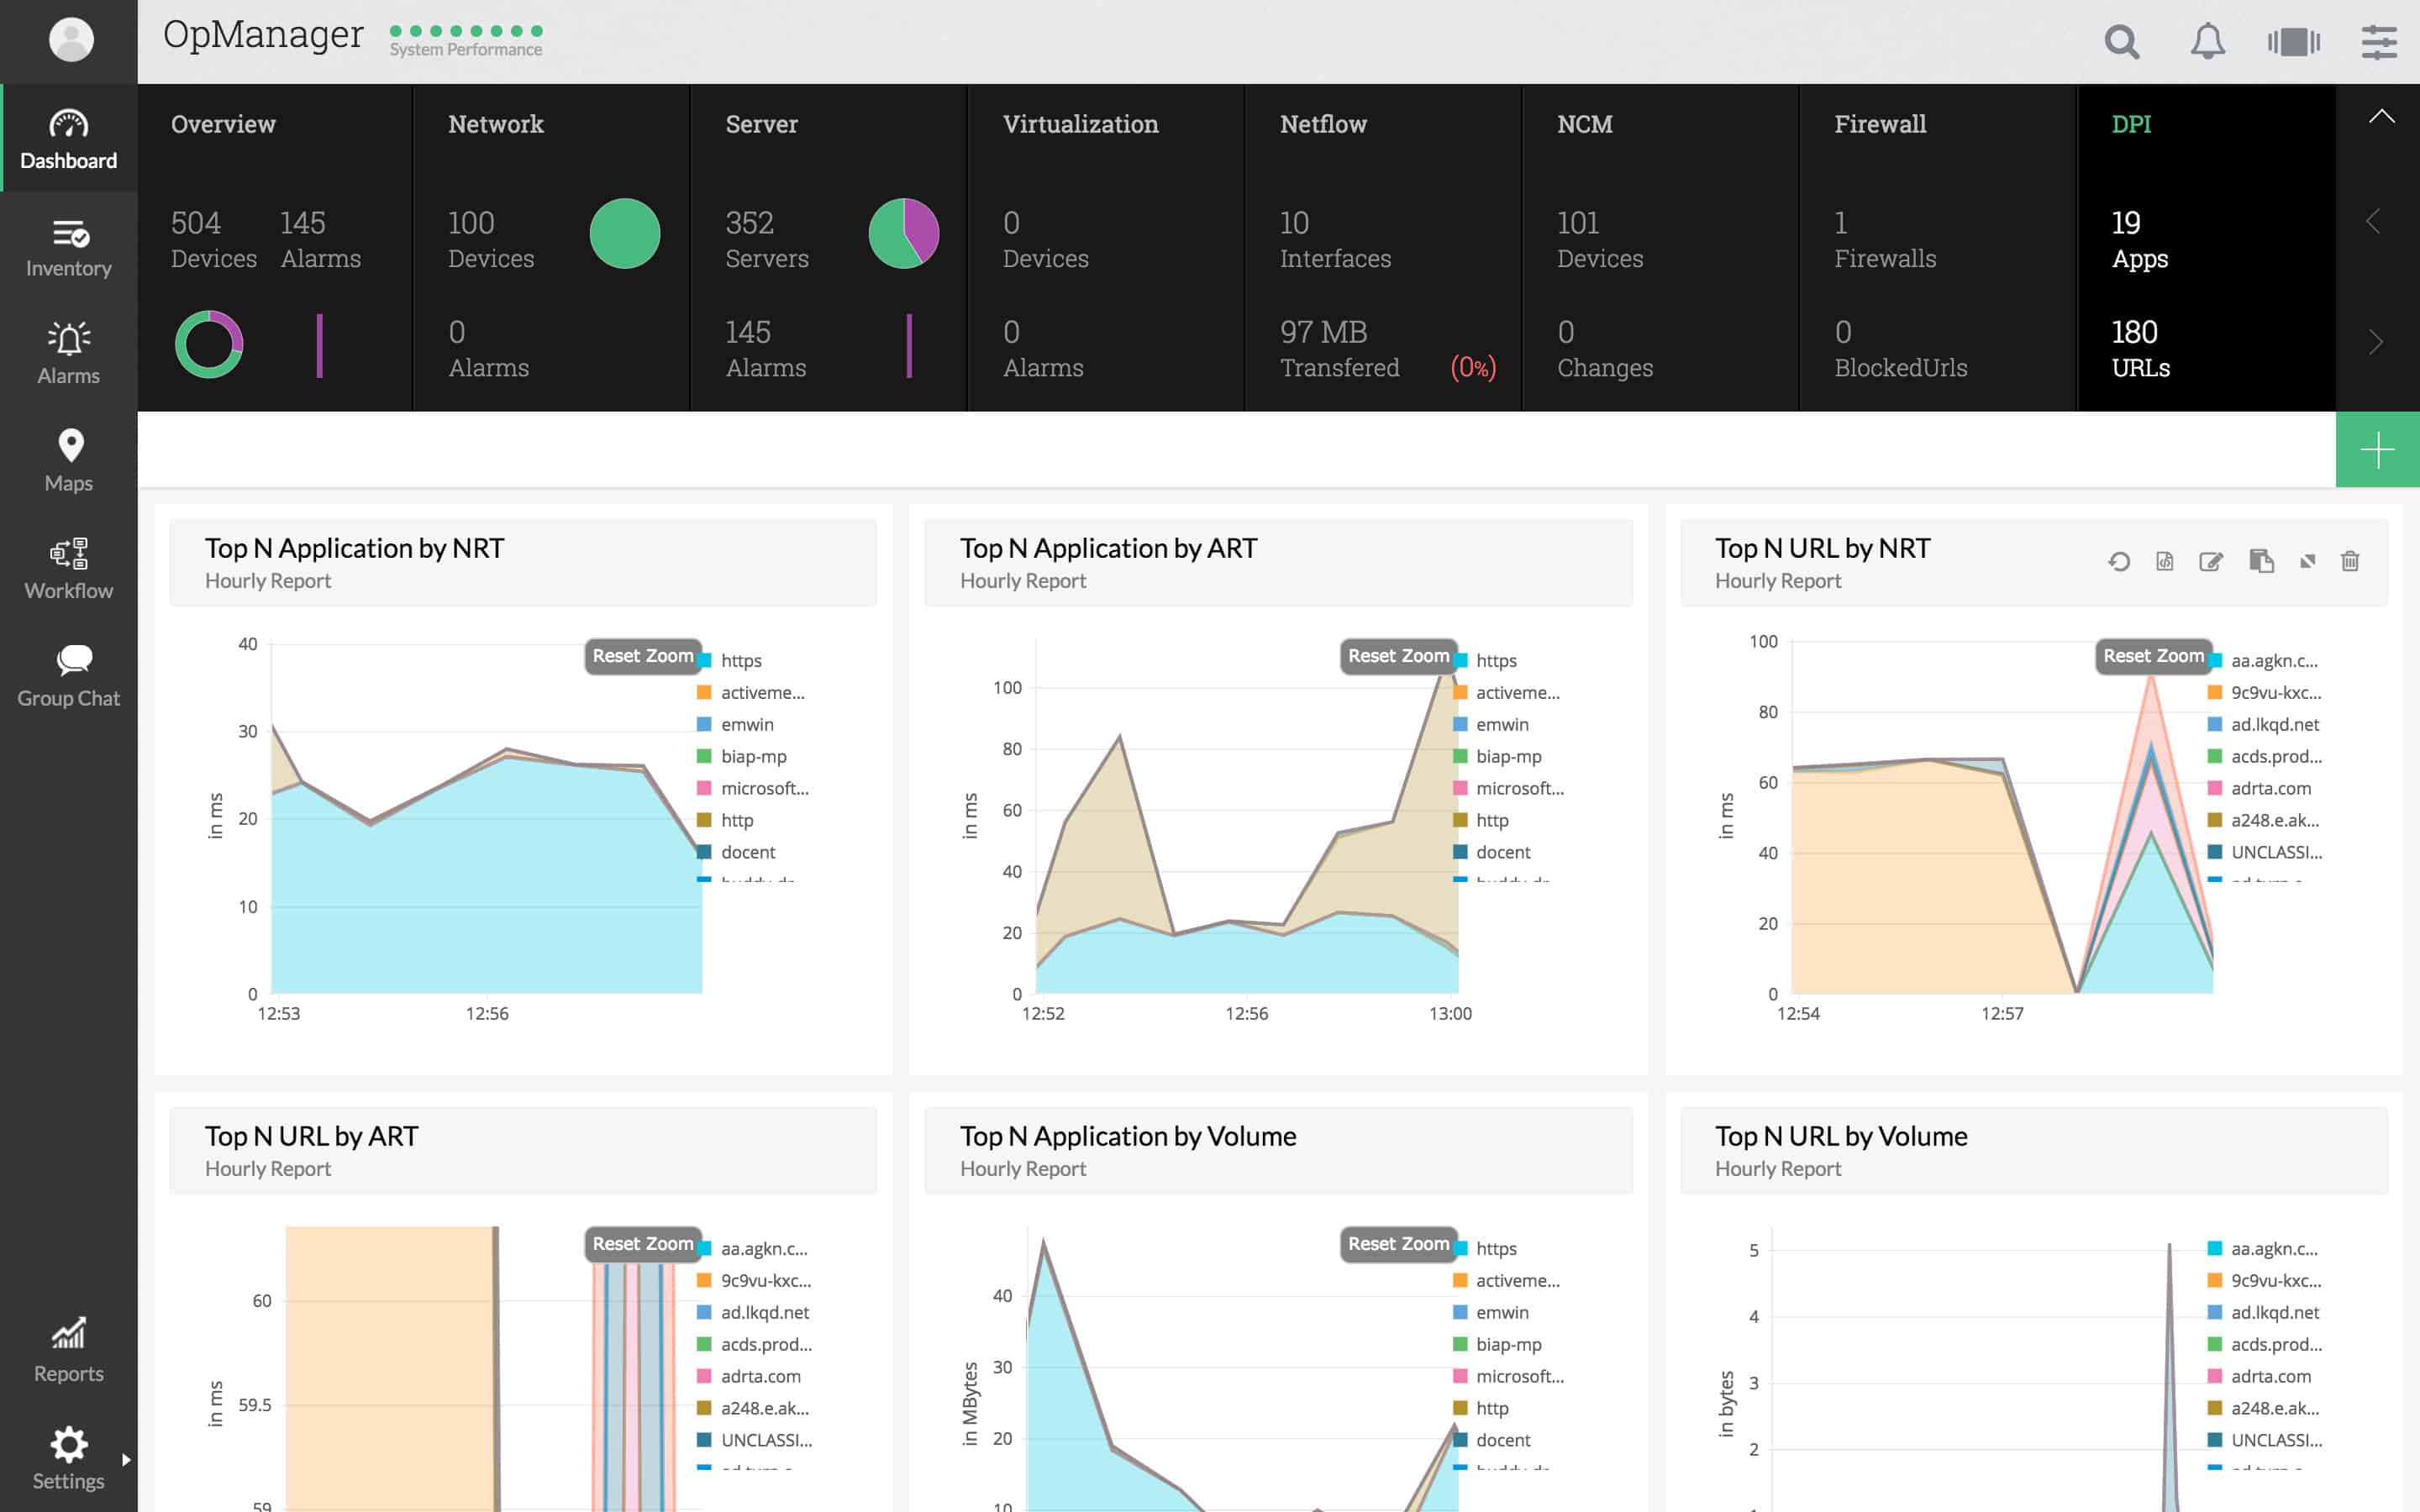
ManageEngine OpManager is a hardware and network monitor for Windows and Linux. The tool uses SNMP to ping devices and pulls performance data. Things you can monitor with ManageEngine OpManager include temperature, fan speed, voltage, and processor status. The software is compatible with VMware, Dell, Cisco HP, and more so you maintain complete transparency.
Key Features:
- Network and server monitoring
- Hardware statuses
- Free version
Why do we recommend it?
ManageEngine OpManager monitors networks and servers and it reports the hardware statuses of network devices and computers. These reports are derived from the Simple Network Management Protocol, which has agents on all network devices and can be activated on workstations and servers. This reports on CPU load, memory availability, CPU temperature, and power supply and fan status.
As a top network monitoring tool, ManageEngine OpManager also has an alerts system. Alerts are sent via email and SMS to make sure that you don’t miss anything important. When devices go down or match certain parameters alarms are raised. Alarms are divided into 4 categories; Service Down, Attention, Trouble, and Critical. These are shown as dials on the left-hand side of the alarms page.
Who is it recommended for?
This package has a Free edition. However, it is limited to monitoring three devices, which isn’t much. The Standard edition is reasonably priced and suitable for small businesses. There are two higher plans for larger businesses. The software for this tool runs on Windows Server, Linux, AWS, and Azure.
Pros:
- Designed to work right away, features over 200 customizable widgets to build unique dashboards and reports
- Leverages autodiscover to find, inventory, and map new devices
- Uses intelligent alerting to reduce false positives and eliminate alert fatigue across larger networks
- Supports email, SMS, and webhook for numerous alerting channels
- Integrates well in the ManageEngine ecosystem with their other products
Cons:
- Is a feature-rich tool that will require a time investment to properly learn
There are three versions of ManageEngine OpManager available to purchase; the Standard Edition, Professional Edition, and Enterprise Edition. The Standard Edition costs $245 (£193.42) for 1000 devices. The Professional Edition costs $345 (£272.37) for 1000 devices with additional features like VMware monitoring and hyper-v monitoring. The Enterprise Edition costs $11,545 (£9,114.56) for 10,000 devices with additional features.
4. Site24x7 (FREE TRIAL)

Site24x7 delivers a system monitoring platform whose bundle also includes endpoint hardware monitoring. The service continuously follows hardware conditions on computers, including elements such as CPU and disks. It can also connect middleware monitoring with the observation of the underlying services. That is a particularly useful capability for organizations running virtualization platforms such as VMware or Hyper-V.
Key Features:
- Tracking of server resources
- Live status monitoring
- Monitoring of network hardware
Why do we recommend it?
Site24x7 is a broad platform rather than a tool limited to hardware monitoring alone. That wider scope allows it to automatically relate application activity to the resources that support it, which provides full-stack observability. Its hardware monitoring also extends to network devices and remote cloud servers.
Although Site24x7 is cloud-based, it is not confined to monitoring cloud systems. An administrator installs an agent at each site, after which the Site24x7 service can monitor all assets in that location. The package includes a discovery routine that populates the dashboard with records for all hardware on the site, covering network devices as well as endpoints.
The tool polls for status information, presents a live readout in the console, and checks results against acceptable performance thresholds. If a threshold check fails, the system raises an alert. A problem in one component can ripple through dependent systems all the way up to user-facing software. However, the administrator only needs to identify which alert appeared first in order to find the root cause of a performance issue.
Who is it recommended for?
Site24x7 is offered in plans that are sized and priced for small businesses. Larger organizations are also supported through capacity expansion packs. Every plan provides full-stack observability for applications, servers, networks, cloud systems, and Web assets. As a result, a single subscription gives a buyer all of the IT asset monitoring services it needs.
Pros:
- Automatic asset discovery
- Dependency mapping
- Root cause analysis
Cons:
- No on-premises option
Site24x7 is offered in multiple plans and bundles, with the base price of each plan set for the smallest businesses. Other companies should expect to pay for additional capacity, so the headline price should not be assumed to be the amount they will actually pay. The Infrastructure Monitoring package starts at $9 per month. Start off with a 30-day free trial.
5. HWiNFO
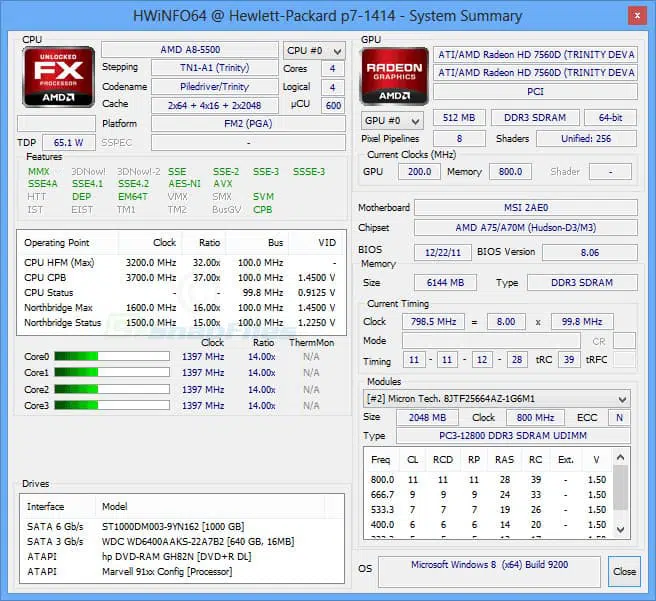
HWiNFO is a hardware monitoring tool with real-time system monitoring capabilities. The hardware components you can view with this tool include CPUs, GPUs, drives, mainboards, and peripherals. In terms of data, you can monitor the RAM, logical CPU number, temperature, memory speed, and battery charge of connected devices.
Key Features:
- Free to use
- Computer internal statuses
- Graphics card add-on
Why do we recommend it?
HWiNFO is a hardware monitor for computers running Windows. The package can report on devices across a network and each license type gives the right to monitor a certain number of devices. The number of devices you can monitor is dedicated by a multiple of the number of licenses you buy.
Similar to other network monitoring tools, HWiNFO offers features like alerts and reports to keep the user updated. Alerts are customizable so that you can monitor parameters of your choice. Likewise, you can generate reports in XML, CSV, and HTML to share findings with your team.
There are also add-ons to enhance the core monitoring experience of HWiNFO. Add-ons available for HWiNFO include RivaTuner/MSI Afterburner/EVGA Precision On-ScreenDisplay, Rainmeter plug-in, HWiNFOMonitor, LCDHost plug-in, and more. Each add-on adds a new feature to the program. For example, the HWiNFOMonitor extension adds a customizable sidebar that adds additional graphs for you to monitor.
Who is it recommended for?
The basic HWiFO package is free for personal use. Businesses have to pay for it. The formula for calculating the number of licenses that you need to buy for your site is 5 + (n*5), so two licenses let you monitor 15 computers. Educational institutions get a 50 percent discount.
Pros:
- Pulls hardware data in real-time
- Supports built-in virtualizations
- Very detailed, good for overclockers and gamers
- Features customizable alerts and simple reporting
- Can even run on DOS
Cons:
- Doesn’t support multiple machines
- Lacks a centralized management dashboard
- Good for single machines, not designed for company-wide device hardware monitoring
HWiNFO is the natural successor to HWMonitor and offers clear-cut but detailed hardware and system monitoring experience. The program is available on Windows in 32-bit and 64-bit. You can download HWiNFO for free.
6. AIDA64
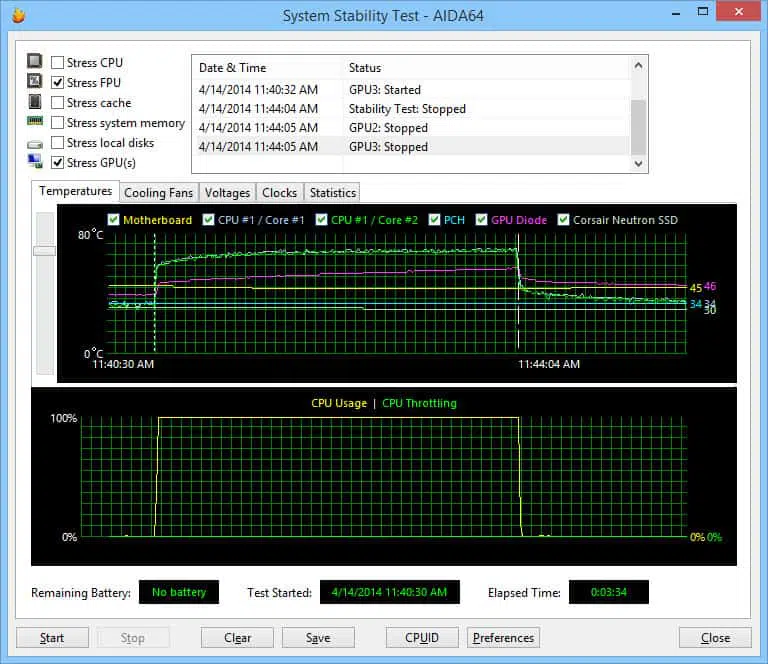
AIDA64 is a piece of hardware monitoring software that offers temperature, CPU, fan, speed, and disk monitoring. The tool works by using a hardware detection engine to find information on the software being used by connected devices. Being able to see what software devices are using remotely increases transparency. As an added bonus, AIDA64 also provides stress testing for your computer, hard disk, SSD, and OpenCL GPU.
Key Features:
- Hardware statuses
- Device stress tests
- Performance graphs
Why do we recommend it?
AIDA64 is available in several versions that will monitor PCs and mobile devices. The tool reports on hardware statuses and software activity. It can also spot whether the system clock has been tampered with for overclocking. You can install the software on a tablet and then check each device that you connect that tablet to.
One of the reasons why AIDA64 is so widely used is because of its benchmarking abilities. Benchmarks are used to measure how fast a computer completes processes and tasks. In other words, benchmarks allow you to test for the signs of poor performance and spot hardware issues like hardware degradation.
AIDA64 is available for Windows 95, 98, 2000, XP, PE, 2003, Vista, 2008, 7, 2008 R2, 8, 2012, 8.1, 2012 R2, 10 and 2016. There are four versions of AIDA64 that you can purchase; Extreme, Engineer, Network Audit, and Business. The Extreme version is aimed at home users and starts at $39.95 (£31.54). The Engineer version adds command-line automation and starts at $199.90 (£157.80).
Who is it recommended for?
This system’s different versions make it suitable as a standalone on-device package or a system that can be used by roaming hardware technicians. The system is able to communicate directly with the CPU and motherboard on each device, extracting hardware statuses while bypassing the operating system.
Pros:
- Designed to detect and monitor devices at scale, good for large companies and enterprises
- Can save collected information in database format
- Simple alert system is easy to use
- Acts as a lightweight RMM with options to restart machines remotely
Cons:
- Less intuitive than leading products
- Interface could use improvements, graphs can be hard to read
The Network Audit version has network inventory, command-line automation, and change management for $100 (£78.94). Finally, the business edition includes all of the above with remote management for $199.90 (£157.83). You can download the free trial.
7. SysGauge
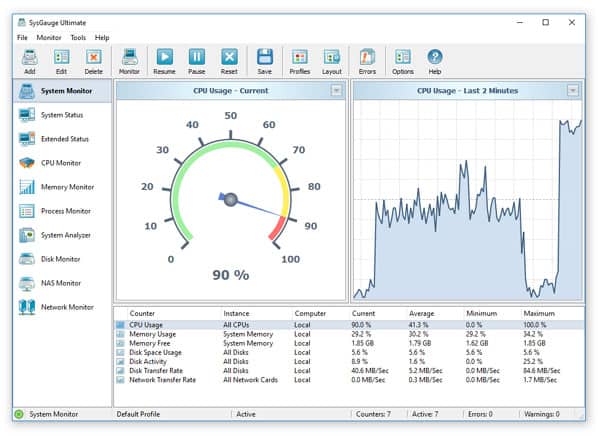
SysGauge is a system monitoring solution with a range of CPU monitoring functions. The CPU Monitor module shows information such as CPU usage, user CPU usage, kernel CPU usage, CPU interrupt rate, CPU frequency, and more. The display Is broken down into graphs and text data. The visual display is relatively basic but it is easy to read.
Key Features:
- CPU Monitor
- GUI interface and command line system
- Operating system monitor
Why do we recommend it?
SysGauge has a busy console that contains graphs, dials, and text. The tool reports on the hardware statuses of the device on which it is installed and it can also monitor remote computers across the network. The software is available for PCs and servers but it will only install on Windows.
The program is also highly customizable. For instance, you can use the System Monitor module to configure CPU monitoring profiles for your users. Then you can select the local and remote computers that you want the user to be able to monitor. In the paid versions of SysGauge there is also a command-line interface, where you can monitor CPU usage directly.
SysGauge is available for Windows as a 32-bit and 64-bit application on Windows XP, Vista, 7, 8, 10, 2003, 2008, 2012, 2012 R2, and 2016. The SysGauge platform is free for 10 monitors or less.
Who is it recommended for?
This tool is suitable for use by small businesses. You can monitor up to 10 computers for free and larger businesses need to pay for more capacity. However, the wider capabilities of systems such as ManageEngine OpManager and SolarWinds Server & Application Manager are more likely to appeal to very large enterprises.
Pros:
- Covers both system and hardware monitoring
- Simple and easy-to-navigate interface
- Built-in visual graphs are basic but insightful
Cons:
- Only available for Windows
- Notification features could be easier to set up and implement
There are three paid versions of SysGauge: SysGauge Pro, SysGauge Ultimate, and SysGauge Server. SysGauge Pro comes with 50 monitors for $50 (£39.48). SysGauge Ultimate supports up to 100 monitors for $125 (£98.70). SysGauge Server is also $125 (£98.70) and supports up to 200 monitors with extra remote control capabilities. You can download SysGauge for free.
8. PA Server Monitor
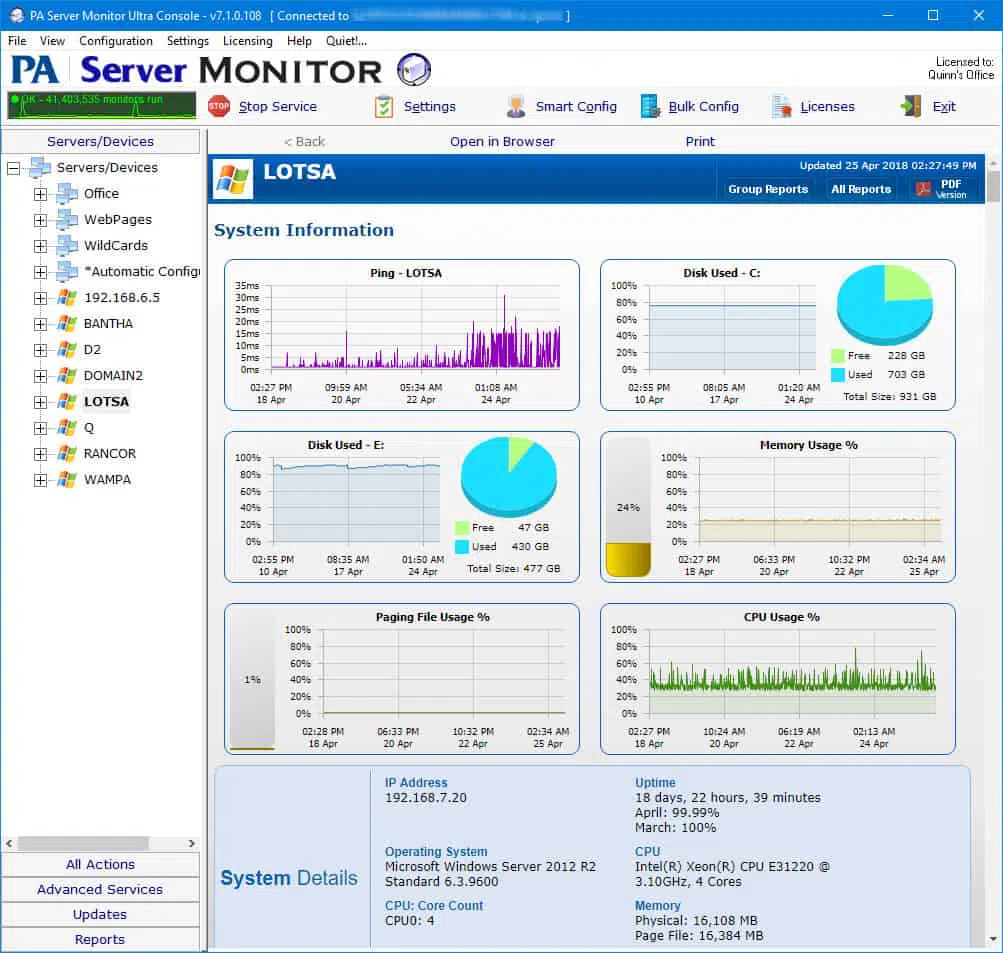
PA Server Monitor is a hardware and server monitoring tool that can monitor Windows and Linux devices. PA Server Monitor shows you the ping, CPU, memory, and disk data on your local environment. There is also remote monitoring to monitor remote computers and other devices. The user interface is slightly outdated but still provides a high-quality monitoring experience with the potential to monitor over 1,000 servers or devices.
Key Features:
- Memory, disk, and CPU activity
- Performance graphs
- Monitors up to 1,000 devices
Why do we recommend it?
PowerAdmin Server Monitor provides network monitoring as well as monitoring for computers. The system is a little like a smaller version of ManageEngine OpManager. It will monitor the activity, capacity, and physical statuses of network devices and computers running Windows and Linux. This system uses SNMP and also includes network testing utilities.
The software also has more advanced features like alerts. Alerts are sent automatically by email or SMS once a specific trigger condition has been met. The program can be configured to automatically restart a service or run a custom script to respond to issues. The automation offered by the alerts system decreases your response time when addressing performance issues.
For further detail, you can translate network usage data into reports. Reports come in the form of status reports for devices complete with uptime data. Reports are available in HTTP and can be sent by email to the rest of your team. You can also develop maintenance schedules to deactivate monitoring outside of business hours.
Who is it recommended for?
The PowerAdmin system can be used for ongoing network and server monitoring because it processes SNMP Traps and log messages into alerts. This is a little more sophisticated than a straightforward hardware monitor because it also tracks operations. This system is able to monitor activities on multiple sites from one console.
Pros:
- Uses very few system resources, great for older hardware
- Can support over 1000 hosts and devices
- Flexible licensing makes the product affordable for all organizations
Cons:
- Outdated interface
- Lacks alerting integrations into popular messaging tools
- Could use upgraded graphs and visualizations
There are four versions of PA Server Monitor available to purchase; Lite License, Pro License, Ultra License, and Corporate Ultra. You need to purchase a license for every monitored server or device. The Lite License range starts from $49 (£38.68) each for devices 1-9 up to $4 (£3.16) for 1000+ devices. For more information on pricing options, you will need to check the comparison table on the site. You can download the free trial version.
9. Open Hardware Monitor
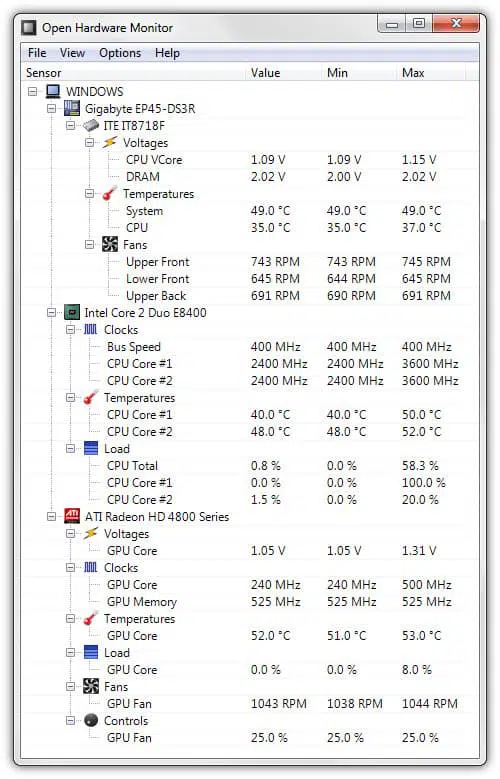
Open Hardware Monitor is a lightweight hardware monitoring utility that is popular amongst Windows users.
Key Features:
- Motherboard monitoring
- CPU activity
- Graphics card checks
Why do we recommend it?
Open Hardware Monitor is an on-device utility for PCs running Windows. The tool reports on the hardware statuses on the computer on which it is installed, which means that it doesn’t operate as a remote monitoring system. However, this software is available for use free of charge.
The program is open-sourced and can monitor temperature, CPU load, fan speed, voltage, and clock speed. All of this information can be viewed in the form of a basic table. While there isn’t much in the way of fancy features or presentation, Open Hardware does a good job of showing your computer’s performance in one window.
Who is it recommended for?
As you can’t get remote monitoring out of this tool, t can only report to the user or a roaming engineer. This makes the software suitable for home use or for small businesses with only one location. The software is written for Windows but it can be run on Linux and macOS over Mono.
Pros:
- Open-source community-supported project
- Quickly displays hardware specs in real-time
- Available cross-platform for both Windows and Linux
Cons:
- Hasn’t been updated in quite a while
- Lacks a centralized management dashboard
- Doesn’t have any alerting or reporting capabilities
If you’re looking for a basic hardware monitoring experience Open Hardware Monitor has you covered. The program simply shows you the metrics you need and nothing more. Open Hardware Monitor is available for Linux, WindowsXP, Vista, 7, 8, 8.1, and 10. Check out the free download.
10. Progress WhatsUp Gold
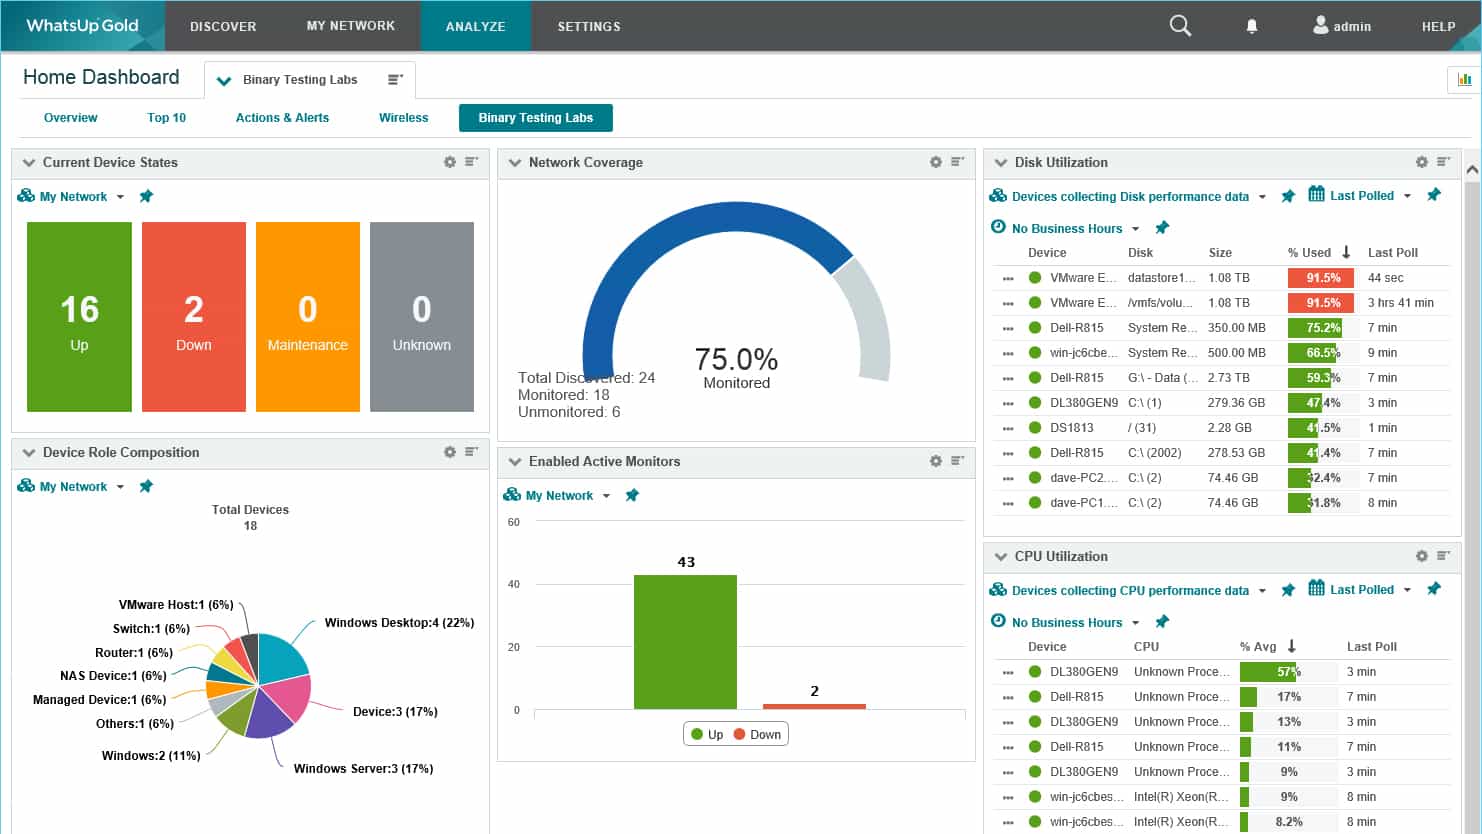
WhatsUp Gold is a hardware monitor widely used by SME’s and large organizations. WhatsUp Gold can monitor the temperature, fan status, and power supply of your devices. The APC performance monitor tracks the power usage of connected devices automatically once they have been discovered. The program is also capable of monitoring any printer that supports IETF Printer, MIB, RFC 3805.
Key Features:
- Endpoints and network devices
- Power supply statistics
- Alerts for performance problems
Why do we recommend it?
Progress WhatsUp Gold is a network monitoring system. This is an SNMP-based package and so it can extract hardware information within the SNMP agent reporting structure, which is called a MIB. If you activate SNMP on your computers, you can also check on their hardware. This tool provides alerts for performance issues or hardware problems.
One of the most useful features included with WhatsUp Gold is the ability to automatically discover your entire network. All connected devices are located and plotted on a topological map. From here you can view their status with up devices shown in green and failed devices shown in red.
The alerts system is also extremely useful. You can create custom alerts to notify you when a certain parameter has been met. Alerts are sent by email, SMS, Slack, web alarms, and IFTTT posts to make sure that you don’t miss out on anything.
Who is it recommended for?
Progress WhatsUp gold is a full network performance monitoring package. It installs on Windows Server and includes an autodiscovery function that populates a network inventory. The system will also create a network map. It will continuously report on network activity while also gathering hardware status reports.
Pros:
- Uses simple visualizations to help provide at-a-glance insights
- Supports modular pricing, allowing companies to pay only for features they intend to use
- Can monitor LANs, WANs, and cloud-based applications such as container environments
Cons:
- Available only for Windows Server
- Modular upgrades might not be a good fit if you intend on utilizing all aspects of a networking monitor
There are three versions of WhatsUp Gold that you can purchase: Premium Annual Subscription, Premium License, and the Total Plus License. The difference between the Premium and Total Plus license is that the latter has network traffic analysis, application monitoring, virtualization monitoring, configuration management, and more. However, you’ll have to contact the vendor directly if you want to view pricing information. Progress offers a free trial.
HWMonitor alternatives: SolarWinds Server & Application Monitor, PRTG Network Monitor, and HWiNFO
HWMonitor is a versatile tool in its own right but if you’re looking for something different or more modern, Paessler PRTG Network Monitor, Atera, and HWiNFO stand in as great alternatives. If you have the budget then SolarWinds Server & Application Monitor offers a full-featured hardware monitoring experience that is easy to configure.
However, if a low-price point is essential then Paessler PRTG Network Monitor’s free edition is ideal. It offers higher-quality displays and visualization than HWMonitor for the same price. That being said if you would prefer something a little more simple HWiNFO stands as the natural successor to HWMonitor with alerts and plugins for those additional monitoring capabilities.
HWMonitor FAQs
How do you read HWMonitor?
HWMonitor displays data in categories. Each category has a node point that can be expanded. Some categories have subcategories. In order to see all of the subcategories, click on the plus symbol (+) next to the category name. When a category expands, that plus sign turns into a minus sign (-). Click on the minus sign to collapse a category’s display down to its heading.
Is HWMonitor safe?
HWMonitor just reports on the output of sensors that are already embedded in the hardware of your computer. It cannot damage your equipment.
How do you run HWMonitor stress test?
An HWMonitor stress test involves pushing the performance of your computer by identifying resource-heavy processes and running them all at once. You would use HWMonitor to measure the results of the stress test.
What is VRM temp in HWMonitor?
VRM temp refers to the temperature of the voltage regulator module (VRM). This is difficult to spot in HWMonitor because the VRM doesn’t always have a temperature sensor built into it – this depends on the decisions of the manufacturer. Thus, HWMonitor doesn’t have a slot in to display format for this temperature and its position can change depending on the motherboard brand being monitored. You have to guess which is the VRM temperature – some users have reported TMPINT2 as this value.
Related: The Best Hardware Monitoring Tools & The Best CPU Temperature Monitors
