JavaScript, being a dynamic and loosely-typed language, is especially prone to errors. If not syntactical, there’s a high chance that you’ll get a logical error
Unfortunately, many of these errors are challenging to diagnose. The frustrating thing is that often you won’t get an error message or any clue about where the errors are occurring. The process of finding and resolving bugs or errors in computer software is called code debugging.
Here’s our list of the best Tools to Monitor and Debug JavaScript:
- Aikido EDITOR’S CHOICE An advanced code testing platform that secures all the code, from the IDE to the cloud. It monitors all your code for security vulnerabilities and CVEs. Start the free trial.
- Site24x7 Real User Monitoring (FREE TRIAL) This package of features on a cloud SaaS platform provides a range of tools for analyzing JavaScript programs by tracking errors as they arise when users of a Web application activate faulty code. Start a 30-day free trial.
- JS Bin An open-source collaborative web development debugging tool for JavaScript HTML, CSS, and a few others.
- ESLint An open-source tool that lets you find and fix problems in your JavaScript code.
- Sentry A well-known application monitoring and debugging platform that helps developers diagnose, fix and optimize the performance of JavaScript codes and others.
- GlitchTip An open-source bug tracking platform that collects every error from your project in real-time and stores them in one place.
- Raygun A cloud-based platform that provides error, crash, and performance monitoring for your JavaScript and other web and mobile applications.
- Rollbar Another commercial JavaScript monitoring and debugging tool whose primary goal is to help development teams deliver high-quality software.
- Airbrake Αn error monitoring and performance management platform for your entire application stack to enable you to deploy code and fix issues faster.
Debugging is undoubtedly not an easy task. The difficulty of software debugging varies significantly with the system’s complexity and depends, to some extent, on the programming language(s) used and the available tools. In the case of JavaScript, its asynchronous nature makes it challenging to locate problems. This makes debugging JavaScript and pinning down the root cause of your errors difficult. But fortunately, most modern browsers have a built-in JavaScript debugger. But the challenge is that built-in debuggers can be turned on and off, forcing errors to be reported to the user.
As software and electronic systems have become more complex, production environments mean more potential issues every time new code is deployed. That’s where a standard JavaScript debugging and monitoring tool comes into play. You need a reliable JavaScript debugging tool that provides peace of mind so you can deploy codes fearlessly and fix issues faster. With a debugger, you can also set breakpoints and examine variables while the code is executing. Thankfully, due to the plethora of JavaScript debugging tools available, troubleshooting is usually straightforward.
Choosing the Right JavaScript Monitoring & Debugging Tool
With various JavaScript monitoring and debugging tools, choosing the right one for your development project can be challenging; first, you need to identify your use cases and look specifically for the tools that best address your needs. When making your selection, you need to consider some key factors: Does the tool promote team collaboration and time efficiency? Does it generate test reports? Does it take care of everything, or would you still need to use third-party tools? What debugging tactics are employed? Debugging tactics can involve interactive debugging, unit testing, static code analysis, integration testing, log file analysis, control flow analysis, memory dumps, and monitoring at the application or system level.
Your goal should be to get a comprehensive collection of capabilities in one tool, rather than relying on several different tools to do the task. Of course, depending on your use case, some tools might be better than others, but all will save you time in the debugging process. In this article, we’re going to review the seven best JavaScript monitoring and debugging tools to guide you in the process of choosing the right one for your project.
The Best Tools to Monitor and Debug JavaScript
Our methodology for selecting the best JavaScript monitoring & debugging tools:
We’ve broken down our analysis for you based on these key criteria:
- Comprehensive Feature Set: The tool should offer a wide range of features including error detection, performance monitoring, and real-time analytics to ensure developers can capture and resolve issues effectively.
- Ease of Integration: It’s essential that the tool integrates seamlessly with existing development environments and popular third-party applications to enhance workflow and efficiency.
- Real-Time Monitoring Capability: The ability to monitor applications in real time and receive immediate notifications about issues is crucial for maintaining system health and user satisfaction.
- Scalability: The tool must be able to handle the growth of the application it monitors, from small projects to large-scale enterprise systems.
- User Reviews and Community Support: Feedback from current users and the availability of community support can indicate the reliability and usability of the tool, which are important factors in choosing the right solution.
1. Aikido (FREE TRIAL)

Aikidio is an end-to-end code-monitoring tool that analyzes all your code for vulnerabilities, CVEs, exploits, and other attack patterns. It integrates well with all popular IDEs to catch and fix issues as you write the code. It supports all major programming languages and IDEs, making it ideal for any organization.
Key Features:
- PR Checks: Blocks the vulnerable changes before they merge.
- Autofix: Automatically fixes issues using AI, and even supports one-click fixes for developers.
- CI Gates: Enforce security standards in your CI/CD pipeline.
- Open-source Scanning: Monitors your open-source code for vulnerabilities.
- Code Quality: Automatically reviews every line of code for bug risks and quality issues.
Why do we recommend it?
We recommend this tool because of its focus on ensuring top-notch code quality and application security, regardless of the programming language or the IDE used. This means you can ship cleaner code, bug-free, and secure applications to your clients.
Another notable aspect for us is AIkido’s ability to prioritize risks, so you can address the most important ones first. Its ability to reduce false positives and provide contextual information for each alert makes it highly useful for troubleshooting. It also integrates well with leading platforms.
Who is it recommended for?
It is recommended for organizations that create apps, particularly software development and SaaS companies. It is also a good choice for DevOps and developer teams that have a quick turnaround time.
Pros:
- Remediation: Uses AI to quickly remediate issues and save time.
- Built-in Compliance: Maps findings with relevant frameworks to identify compliance gaps.
- CI/CD Integration: Integrates well with popular CI/CD pipelines.
- Contextual Alerts: Sends relevant alerts with the required context.
Cons:
- Expensive: Some teams may find the higher plans expensive.
Aikido offers a free plan limited to two developers and 10 repos. The paid plans start at $350/month for the Basic plan, $700 for the Pro plan, and $1,050 for the Advanced plan, respectively. There’s also an Enterprise plan with custom pricing. Start a free trial.
EDITOR'S CHOICE
Aikido has been ch0osen as the best JavaScript monitoring and debugging tool by our editors because it can catch issues while you code. Since it integrates well with any IDE, it identifies potential security issues, bugs, and poor code quality during the coding process. To counter these issues, it offers one-click remediation that can be a big time-saver for developers. Also, other alerts are grouped and sent within the relevant context, so they are meaningful without adding to fatigue.
Download: Start FREE Trial
Official Site: https://www.aikido.dev/pricing
OS: Cloud-based
2. Site24x7 Real User Monitoring (FREE TRIAL)
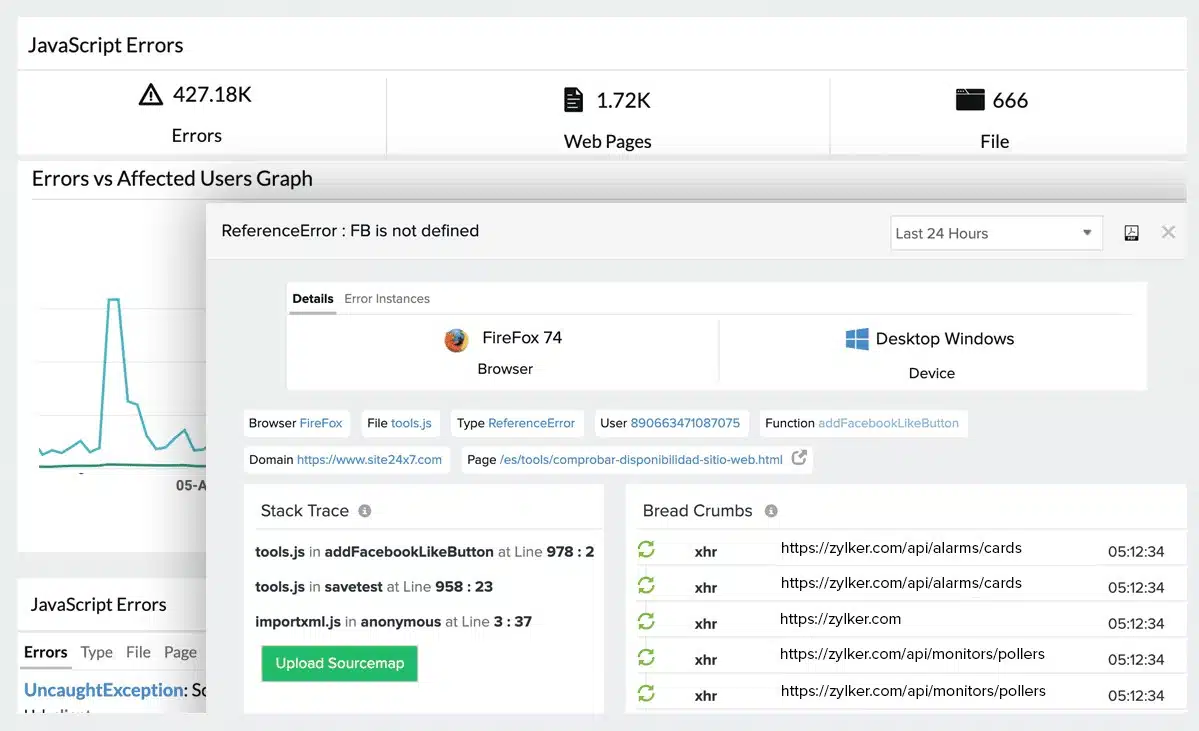
Site24x7 Real User Monitoring provides a way to spot JavaScript errors that crop up once a Web application has gone live. JavaScript error tracking is just one of the features in the Real User Monitoring unit. The error report includes details of the environment at the time that the error was logged.
Key Features:
- JavaScript Error Tracking: Identifies and logs JavaScript errors to help debug and optimize web applications post-deployment.
- Integrated APM Insight: Offers seamless integration with APM Insight for detailed root cause analysis and code diagnostics.
- User Journey Tracking: Monitors and records user interactions across the site, providing insights into page popularity and user behavior.
Why do we recommend it?
Site24x7 Real User Monitoring is crucial for developers and web managers due to its comprehensive tracking of JavaScript errors and integration with application performance management tools. This tool not only pinpoints errors but also provides insights into the execution environment, helping teams to quickly resolve issues and enhance user experience.
The tool also provides runtime measurements for factors such as resource usage. The unit records the circumstances of each component’s launch. This is useful information because previous steps could be at fault for an error that emerged while JaveScript was running. For example, it could be that required inputs were incorrectly set up.
Who is it recommended for?
This tool is ideal for developers and site administrators who need to maintain optimal performance and troubleshoot issues in real-time on live websites. It’s especially useful for those who manage complex sites where JavaScript plays a crucial role in user interaction.
Pros:
- Detailed Error Reporting: Provides in-depth details of JavaScript errors, including environmental conditions at the time of the error.
- Comprehensive Integration: Seamlessly works with other Site24x7 tools for enhanced monitoring and troubleshooting capabilities.
- User Behavior Insights: Gathers data on user navigation patterns, helping to optimize the user journey and improve site design.
Cons:
- Requires Familiarity with APM Tools: To fully leverage the capabilities of the integrated APM Insight, users need to be familiar with application performance management concepts and tools.
- Could Overwhelm New Users: The breadth of data collected and features offered might overwhelm new users or small teams without dedicated IT support.
Two other units on the Site24x7 platform assist with Java monitoring. The first is the APM Insights module, which can step through Java code and examine JVMs. The other is Synthetic Monitoring, which lets you launch tests, which can include complicated actions through the site, recorded and replayed. The combination of these three services makes the Site24x7 platform a good choice for JavaScript monitoring and troubleshooting. You can assess the system by activating a 30-day free trial.
3. JS Bin
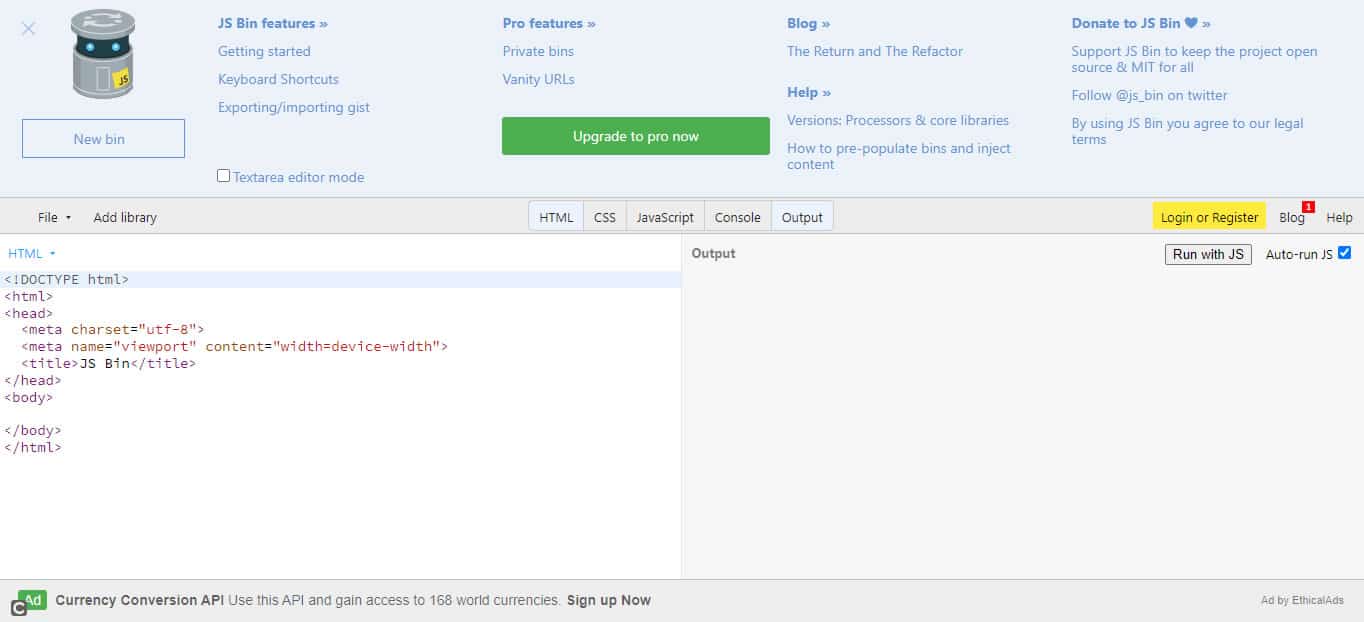
JS Bin is an open-source collaborative web development debugging tool for JavaScript HTML, CSS, and a few others. It was specifically designed to help JavaScript and CSS folk test code snippets within some context and debug the code collaboratively right on the JS Bin website.
Key Features:
- Real-Time Collaboration: Allows multiple users to work on the same piece of code simultaneously and see updates in real time.
- JavaScript Linting: Provides code linting tools within the editor to help identify and fix errors in JavaScript, HTML, and CSS code.
- Remote Rendering: Enables viewing the output of code on any device, ensuring compatibility and responsiveness across platforms.
Why do we recommend it?
JS Bin is recommended for its excellent real-time collaboration features, which are invaluable for teams and educational environments where live coding and instant feedback are crucial. Its simplicity and ability to see changes immediately make it a favorite tool among web developers, especially for those working in JavaScript and CSS.
JS Bin stands out as one of the best JavaScript collaborative debugging tools out there. It allows you to test and debug scripts right along with other people. As you type into one of the editor “panels”, you and anyone watching your bin will see the output being generated in real-time in the output panel. JS Bin is noted for its simplicity, and you can see any changes made to your JavaScript code in real-time.
JS Bin provides no accurate monitoring capabilities and no privacy protection, which means that unless you pay for a ‘private bin’, your code is technically exposed to the public. Nevertheless, the simplicity, debugging features, and open-source model make it ideal for independent JavaScript developers and small teams who just need to check their code quickly.
Who is it recommended for?
Ideal for freelance developers, educators, and small development teams who need a straightforward, effective tool for testing and sharing code snippets. JS Bin’s collaborative features also make it suitable for remote teams and coding workshops where participants need to view and edit code collectively.
Pros:
- Simplicity in Design: The user interface is clean and easy to navigate, allowing developers to focus on coding without unnecessary distractions.
- Live Code Sharing: Features like CodeCast make it possible to share coding sessions in real time, enhancing collaborative debugging.
- Versatile Viewing Options: Supports both in-editor and full-preview modes, allowing developers to see their code’s effect instantly.
Cons:
- Lack of Privacy: Without a paid private bin, all code is public, which can be a concern for projects requiring confidentiality.
- Limited Monitoring Tools: Does not provide in-depth monitoring of code performance, which can be a drawback for more advanced development needs.
4. ESLint
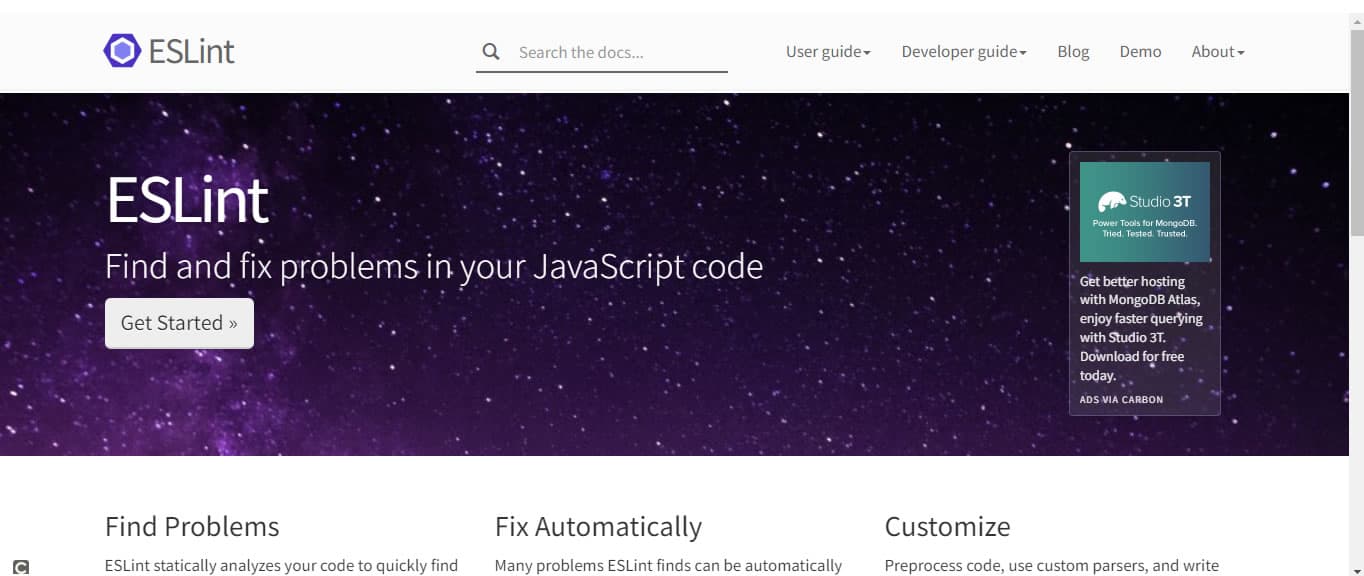
ESLint is an open-source tool that lets you find and fix problems in your JavaScript code. ESLint, as the name implies, is a JavaScript linting utility–a static code analysis tool used to flag programming errors, bugs, stylistic errors, and suspicious constructs. ESLint covers both code quality and coding style issues to make code more consistent and avoid bugs.
Key Features:
- Problem Detection: ESLint performs static code analysis to quickly identify errors and potential issues in JavaScript code.
- Automatic Correction: Capable of automatically fixing a wide range of problems, ensuring that fixes are syntax-aware and do not introduce new errors.
- Customization: Allows developers to tailor the linting rules to specific project needs, ensuring flexibility and adherence to coding standards.
- Pluggability: Supports extensible rules and formatters, making it highly adaptable for various development environments.
Why do we recommend it?
ESLint is highly recommended due to its comprehensive ability to not only detect but also fix coding errors automatically. Its customization capabilities allow developers to enforce specific coding standards and practices, making it an invaluable tool for maintaining code quality across large and complex projects.
As of 2024, ESLint is the most downloaded JavaScript linter. The primary reason ESLint was created was to allow developers to create their own linting rules. It is designed to have all rules wholly configurable and pluggable.
Who is it recommended for?
ESLint is ideal for JavaScript developers of all skill levels who are looking to improve code quality, enforce consistency, and avoid common coding errors. It is particularly beneficial for teams seeking to maintain a unified coding standard across multiple projects.
Pros:
- Advanced Error Detection: Offers thorough scanning of JavaScript code to find and highlight errors efficiently.
- Syntax-Aware Fixes: Automatically corrects code with an understanding of JavaScript syntax, avoiding the introduction of new errors.
- Highly Configurable: Provides extensive options for customizing rules and behaviors to fit the specific needs of a project.
Cons:
- Learning Curve: The vast array of configurable options and the need to understand linting rules might be daunting for beginners.
- Setup Complexity: Initial configuration and setup can be complex, particularly when customizing rules for specific project requirements.
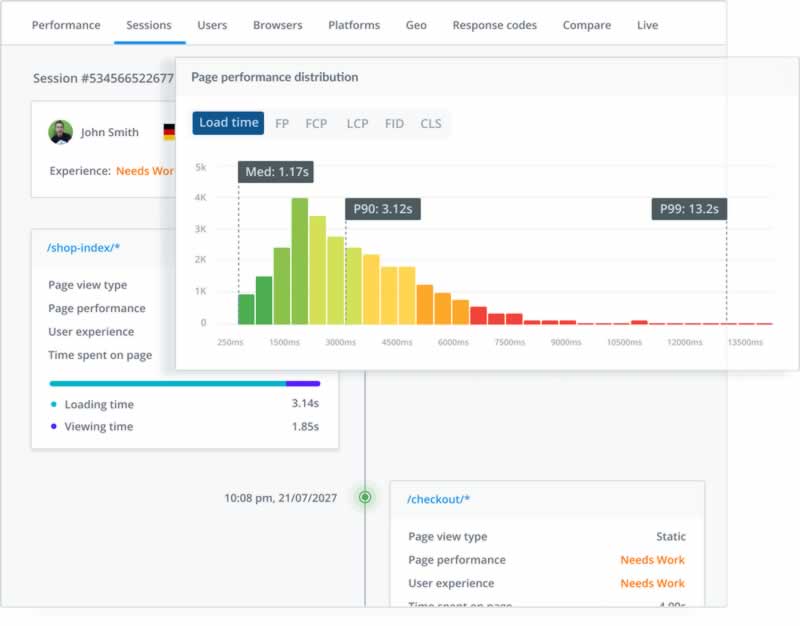
5. Sentry
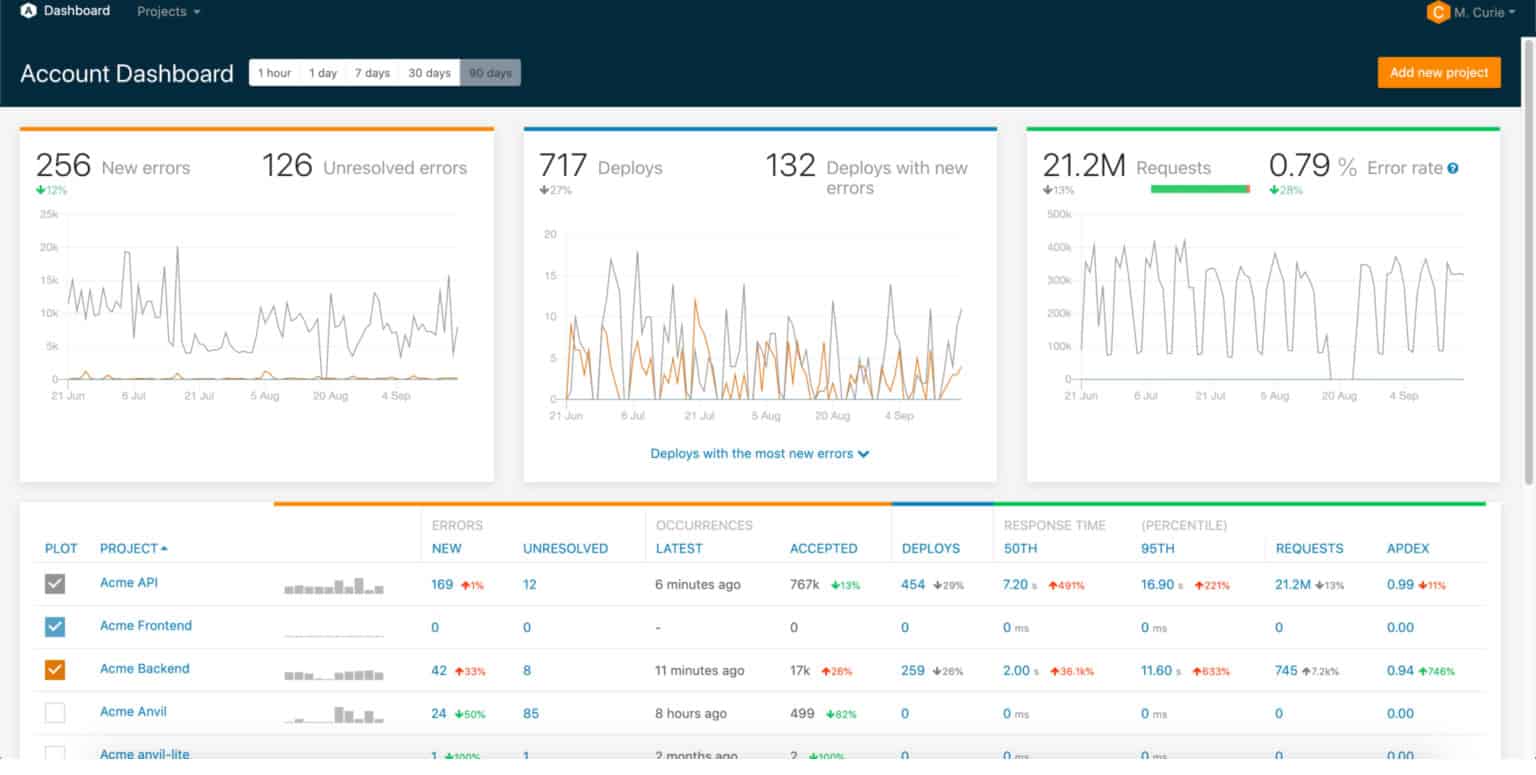
Sentry is a well-known application monitoring and debugging platform that helps developers diagnose, fix and optimize the performance of JavaScript codes and others. The service compiles bugs and code errors into a searchable list and allows you to identify areas of your code to make it easier to reproduce the mistakes. In addition, sentry’s stack tracing feature helps to stimulate your development environment, enabling you to debug errors and better understand the root cause and where they are occurring in the code.
Key Features:
- Application Monitoring: Provides comprehensive monitoring for JavaScript and other programming languages, enabling efficient error and performance tracking.
- Stack Tracing: Offers stack tracing capabilities to recreate issues and understand the context and root cause of errors in the code.
- Integration with SCM Tools: Directly integrates with source code management tools to identify problematic commits and streamline debugging.
Why do we recommend it?
Sentry is highly recommended for its robust debugging capabilities, which help developers quickly diagnose and resolve issues within their code. Its detailed stack tracing and integration with development tools allow for a deeper understanding of errors, improving code quality and application performance over time.
The Sentry has a suite of JavaScript monitoring tools that hooks into your runtime environment to do the heavy lifting of debugging for you. Sentry for JavaScript gives you the full context in the form of full stack traces, support for source maps that unify your code, and direct integration with your source code management tool to help you identify suspect commits. In addition, sentry’s Issue Details page gives you the device, OS, and browser of your users to enable you to gain complete visibility into what led up to your JavaScript incident. And with Sentry’s query builder called Discover, you can debug JavaScript with pre-built searches that filter your JavaScript events, unique errors, errors by URL, and client.
Sentry’s licensing plans include both freemium and premium options. A free trial is also available for both the Team and Business editions. Additionally, if you approach Sentry directly, Enterprise size services are available if you require large-scale considerations such as complete platform error monitoring and cross-project insights.
Who is it recommended for?
Sentry is ideal for development teams of all sizes that require reliable application performance monitoring and error tracking. Its scalable options from freemium to enterprise levels make it suitable for startups to large organizations looking to maintain high standards of software reliability.
Pros:
- Comprehensive Error Insights: Provides detailed error information including device, operating system, and browser data to fully understand user incidents.
- Advanced Search Capabilities: Features a powerful query builder that allows developers to filter and pinpoint issues efficiently.
- Seamless Tool Integration: Integrates smoothly with existing development environments and tools, enhancing workflow and productivity.
Cons:
- Pricing Structure: While it offers a freemium plan, the more advanced features are locked behind higher-tier paid plans, which may be a barrier for smaller teams.
- Complexity of Features: The wide range of features and deep integrations might require a steep learning curve for new users or smaller teams without dedicated DevOps support.
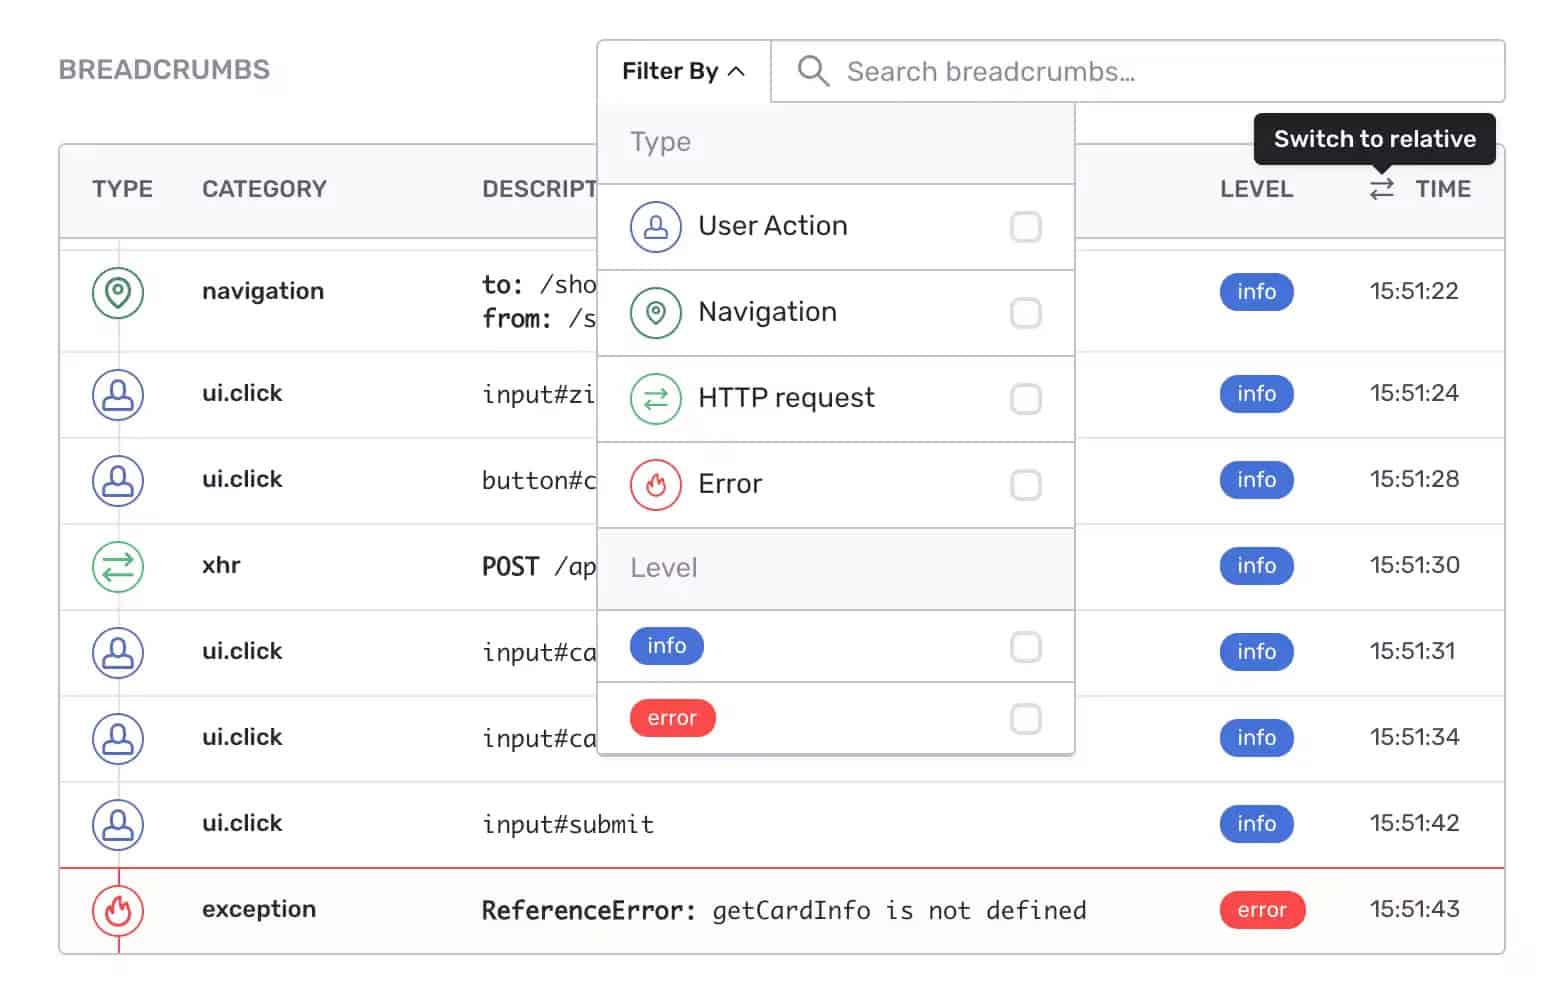
6. GlitchTip
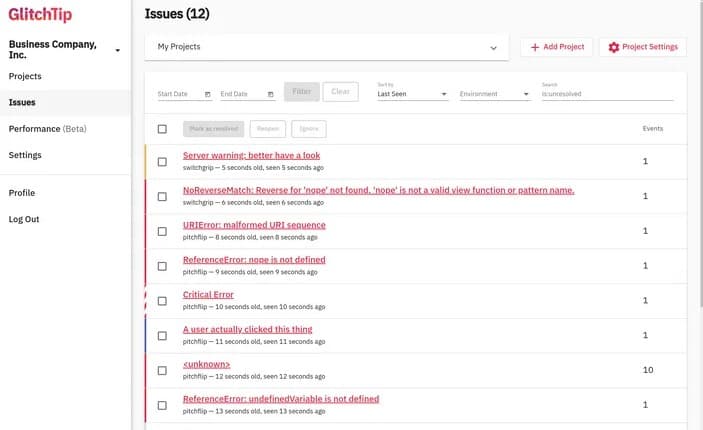
GlitchTip is an open-source bug tracking platform that collects every error from your project in real-time and stores them in one place. The tool was created in response to Sentry’s decision to abandon open-source and re-license Sentry. In other words, GlitchTip is an open-source reimplementation of the Sentry error tracking platform. GlitchTip can use Sentry’s open-source SDKs to receive error data from your application.
Key Features:
- Open-Source Platform: Fully open-source error tracking system that can be integrated seamlessly using Sentry’s SDKs.
- Real-Time Error Collection: Captures and aggregates errors in real-time, storing them in a centralized dashboard for easy access.
- Self-Hosting Capability: Offers the flexibility to be self-hosted, providing full control over the data and customization.
Why do we recommend it?
GlitchTip is recommended for its commitment to remaining an open-source alternative to Sentry, providing a similar suite of features that facilitate effective error tracking and resolution. Its ability to integrate with Sentry’s SDKs allows for a smooth transition for those familiar with Sentry’s tools but seeking an open-source solution.
GlitchTip can be hosted locally (self-hosted) because it is open-source, but it also provides hosting services. GlitchTip is open-source means that it has a larger community of developers and users than some other similar products. However, Glitch Tip is still in its early stage and lacks some features of Sentry, such as charts, advanced queries, and others. As a result, GlitchTip is ideal for independent developers, SMBs, and low-budget projects.
Who is it recommended for?
Ideal for independent developers, small to medium-sized businesses (SMBs), and projects with limited budgets who require a robust yet cost-effective solution for error tracking. Its open-source nature also appeals to those who prefer to have control over their tools and data privacy.
Pros:
- Community-Driven Development: Benefits from the contributions and support of a wide community of developers enhancing the platform.
- Cost-Effective: Being open-source and self-hostable makes it a cost-effective solution for error tracking without the overhead of licensing fees.
- Easy Integration: Uses existing Sentry SDKs for easy implementation into current projects without the need to learn new systems.
Cons:
- Limited Advanced Features: Lacks some of the more sophisticated features found in commercial counterparts, such as detailed analytics and advanced query capabilities.
- Early Development Stage: Still in the early stages of development, which might present some stability issues or a lack of certain functionalities compared to more mature platforms.
7. Raygun
Raygun is a cloud-based platform that provides error, crash, and performance monitoring for your JavaScript and other web and mobile applications. With Raygun, you can monitor your web application for JavaScript errors and performance issues impacting your end-user experience. In addition, Raygun aggregates user data to enable accurate crash reporting and bug feedback.
Key Features:
- Crash Reporting: Detects, diagnoses, and resolves errors across a wide range of programming languages and frameworks.
- Real User Monitoring: Provides insights into front-end performance to optimize user experiences in real-time.
- Application Performance Monitoring: Offers code-level visibility into server-side performance to identify and resolve issues efficiently.
Why do we recommend it?
Raygun is recommended for its comprehensive monitoring capabilities that encompass error, crash, and performance tracking across web and mobile applications. Its ability to provide complete stack traces and detailed error occurrence data makes it invaluable for developers looking to maintain high-quality software.
The solution is divided into three primary product functions as follows:
- Crash Reporting: This tool enables you to detect, diagnose, and resolve errors with ease, and gain complete visibility across your entire tech stack. All major programming languages and frameworks, including .NET, JavaScript, PHP, Ruby, and more, are supported.
- Real User Monitoring: This tool enables you to monitor and improve front-end performance and gain visibility into front-end performance. Languages and frameworks such as JavaScript, Angular, Xamarin, React, iOS, and Android are supported.
- Application Performance Monitoring: This tool lets you have code-level visibility into server-side performance, including how your code is being executed, so you know exactly what went wrong and how to fix it.
Who is it recommended for?
Raygun is suited for development teams of all sizes that need a robust solution for monitoring application health and performance. It’s particularly beneficial for those using modern web technologies and mobile applications who require detailed insights into both client-side and server-side performance.
Pros:
- Comprehensive Error Detail: Offers detailed stack traces and data on error occurrences, aiding quick resolution.
- Performance Optimization: Helps improve application performance by monitoring and reporting on front-end and server-side metrics.
- Scalable Plans: Provides various pricing plans based on usage, making it flexible and scalable for businesses of all sizes.
Cons:
- Usage-Based Pricing: While flexible, the usage-based pricing model can become costly for large-scale deployments or high traffic applications.
- Initial Complexity: The extensive features and capabilities might require a steeper learning curve to fully utilize effectively.
Raygun provides various price plans to suit your needs. All plans are charged per usage and come standard with unlimited users and applications. In addition, a Free endless 14 days monitoring is available to enable you to test run before purchase.
8. Rollbar
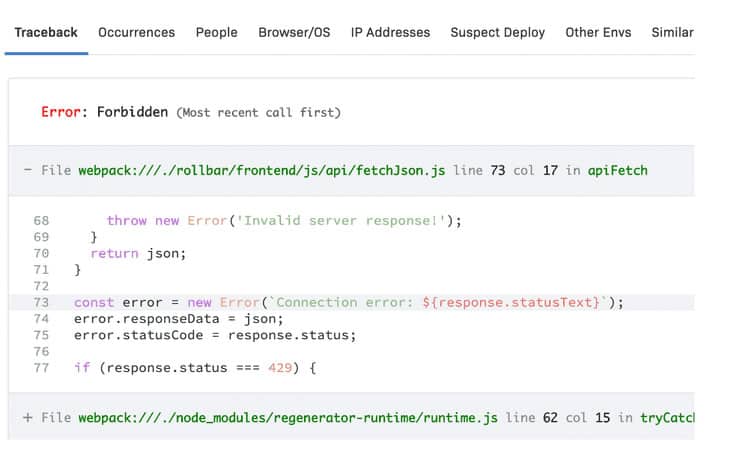
Rollbar is another commercial JavaScript monitoring and debugging tool whose primary goal is to help development teams deliver high-quality software. Rollbar provides real-time error reporting, fault aggregation, exception reporting, and continuous deployment monitoring for developers. It acts as your safety blanket by catching errors before it gets noticed by your users, with Rollbar.
Key Features:
- Real-Time Error Reporting: Monitors JavaScript and other programming languages, reporting errors as they happen to prevent user detection.
- Telemetry Data: Provides detailed context for debugging client-side JavaScript errors, enhancing the speed and accuracy of fixes.
- Error Prioritization: Uses metadata to help developers understand the impact of errors and prioritize their resolution efforts.
Why do we recommend it?
Rollbar is highly recommended for its ability to catch and report errors in real-time, ensuring that development teams can address issues before they affect users. Its detailed telemetry and error metadata make debugging faster and more effective, helping maintain software quality throughout the development process.
JavaScript errors are tracked as they occur, and you’ll get notified on how to fix them throughout the software development process. All errors include detailed data to help you assess the impact and assign priority. In addition, rollbar automated issue tracking and workflow triggers help you avoid accidentally shipping applications and codes with known and unresolved errors.
Rollbar licensing plans include both free and premium plans. The freemium version is free for up to 25,000 error events and has enough basic capabilities to get you started, ideal for small development teams with a low budget. The premium option covers up to 50,000 error events for the Essential plan and 100k error events, among other features for the Advanced package.
Who is it recommended for?
Rollbar is ideal for development teams seeking a robust tool for error monitoring and debugging, particularly in environments where continuous deployment is practiced. Its scalability makes it suitable for both small startups and large enterprises looking to maintain high standards of software reliability.
Pros:
- Continuous Monitoring: Offers continuous deployment monitoring, ensuring that new code changes do not introduce regressions.
- Automated Workflows: Features AI-assisted workflows to automatically handle new and reactivated errors, preventing potential disruptions.
- Flexible Licensing Plans: Provides a range of plans, including a free version for small teams, making it accessible to projects of all sizes.
Cons:
- Pricing Model: While it offers a freemium plan, more comprehensive features are limited to higher-tier plans, which could be cost-prohibitive for some teams.
- Complex Setup: The extensive features and detailed telemetry might require a more complex setup and initial learning curve.
A free trial of the premium version is also available to enable a test run before purchase. The trial includes all Advanced features as well as unlimited events. After the trial expires, you can subscribe to a paid plan that best fits your needs or downgrade to a Free plan.
9. Airbrake
Airbrake is an error monitoring and performance management platform for your entire application stack to enable you to deploy code and fix issues faster. The platform is targeted at developers and supports JavaScript, PHP, Python, Java, and other languages. Airbrake provides real-time error alerts, rich contextual data about why errors are occurring, application performance insights, and integrates with your workflow so you can quickly diagnose and fix problems as they happen.
Key Features:
- Real-Time Error Monitoring: Offers 24/7 surveillance of your application stack with instant alerting on emerging issues.
- Performance Insights: Provides detailed insights into application performance, helping to convert data into actionable improvement strategies.
- Integration with Development Tools: Seamlessly integrates with tools like GitHub, Bitbucket, Slack, and Zapier to streamline workflow management.
Why do we recommend it?
Airbrake is recommended for its comprehensive error and performance monitoring capabilities that provide developers with the necessary tools to identify and resolve issues swiftly. Its agentless and serverless nature ensures a minimal impact on application performance, making it an efficient choice for real-time debugging.
For better bug notifications and workflow management, the tool can be integrated with Bitbucket, Slack, Zapier, Github, and other third-party tools. One unique thing about Airbrake is that it is agentless and serverless, with fast lightweight installation, and zero impact on app performance.
Who is it recommended for?
Airbrake is ideal for development teams looking for a robust monitoring solution that supports multiple programming languages and integrates easily with existing development workflows. It’s particularly useful for teams that practice continuous integration and continuous deployment
Pros:
- Lightweight Installation: Quick and easy setup without additional infrastructure, minimizing impact on application performance.
- Advanced Debugging Tools: Offers detailed contextual data and performance metrics to help quickly pinpoint and resolve issues.
- Versatile Integration: Compatible with numerous third-party tools, enhancing team collaboration and response times.
Cons:
- Separate Billing for Features: Error monitoring and performance monitoring are billed separately, which can increase overall costs.
- Complex Pricing Structure: Multiple pricing tiers and product options may complicate the selection process for some teams.
- Deployment Tracking: Monitors deployments to help teams understand and improve their code quality over time.
- Database Performance Insights: Delivers metrics to evaluate and enhance database operations within your application.
Airbrake provides various price plans grouped in different tiers and billed annually. For example, error Monitoring and Performance Monitoring are billed as two separate products. You can independently select the tier of Error Monitoring or Performance Monitoring that best suits your needs. A free 30-day trial is available for all of the product’s features.
