
The JBoss Enterprise Application Platform (JBoss EAP) and WildFly, formerly known as JBoss Application Server (JBoss AS) are two powerful application servers from the staple of Red Hat. JBoss AS is a subscription-based open-source application server that can host business applications developed in Java. On the other hand, WildFly is a free and open-source application server.
The JBoss EAP and WildFly are widely used for building, deploying, and hosting cross-platform Java applications and services. To ensure high application performance, it is essential to monitor the JBoss EAP/WildFly server, the components it hosts and the infrastructure tiers supporting it. Developers and IT operations teams need this capability to proactively detect performance problems before they impact end-users.
Here is our list of the best JBoss monitoring tools:
- ManageEngine Applications Manager EDITOR’S CHOICE Java memory management and other activity is gathered by this distributed tracing, code profiling, and application dependency map system that collects data from JBoss along with other data sources. Available for Windows Server, Linux, AWS, and Azure. Start a 30-day free trial.
- Site24x7 APM (FREE TRIAL) A suite of monitoring tools, hosted in the cloud that includes network, server, and application monitoring with code profiling and JBoss data collection for Java-based functions. Access the 30-day free trial.
- Dynatrace An application monitor that correlates activity between software and services and uses AI processes to adjust alert conditions. This is a cloud-based system.
- Instana APM A cloud-based system provided by a division of IBM that will scan and map application dependencies, gather system data from tools, such as JBoss, and quickly identify the root cause when performance slips.
- Datadog A platform of modules that includes an application monitor with JBoss data collection capabilities. This is a SaaS package.
- SolarWinds Server & Application Monitor Observe JBoss and WildFly activity in the context of the Web applications that they support.
- AppDynamics Monitor all services and applications with this package that can gather data from JBoss and many other technologies. This is a SaaS platform.
- eG Enterprise APM Monitor Web apps and supporting infrastructure with this cloud-based service that will access JBoss and JVM data. Also available for installation on Windows.
- Atatus APM An APM that includes JBoss diagnosis and fixes as well as wider application monitoring. This is a cloud-based system.
- Nagios A system monitoring package for networks, servers, and applications that is available in free and paid versions. Runs on Linux.
In this article, we’re going to review the ten best JBoss/WildFly monitoring tools in the market. Hopefully, this will guide you in the process of choosing the right one for your business.
The best JBoss Monitoring tools
Our methodology for selecting JBoss monitoring tools
We reviewed the market for JBoss monitoring software and analyzed the options based on the following criteria:
- An application monitor with Web application tracking
- Examination for JVM activities and Java memory management
- The ability to access JBoss EAP and/or WildFly data
- Correlation between Java activity and supporting system resources
- Root cause analysis to examine the reasons behind performance issues
- A free trial tor a demo that enables an assessment of the tool before paying
- Value for money from a service that is able to cover many Web application technologies as well as JBoss
1. ManageEngine Applications Manager (FREE TRIAL)
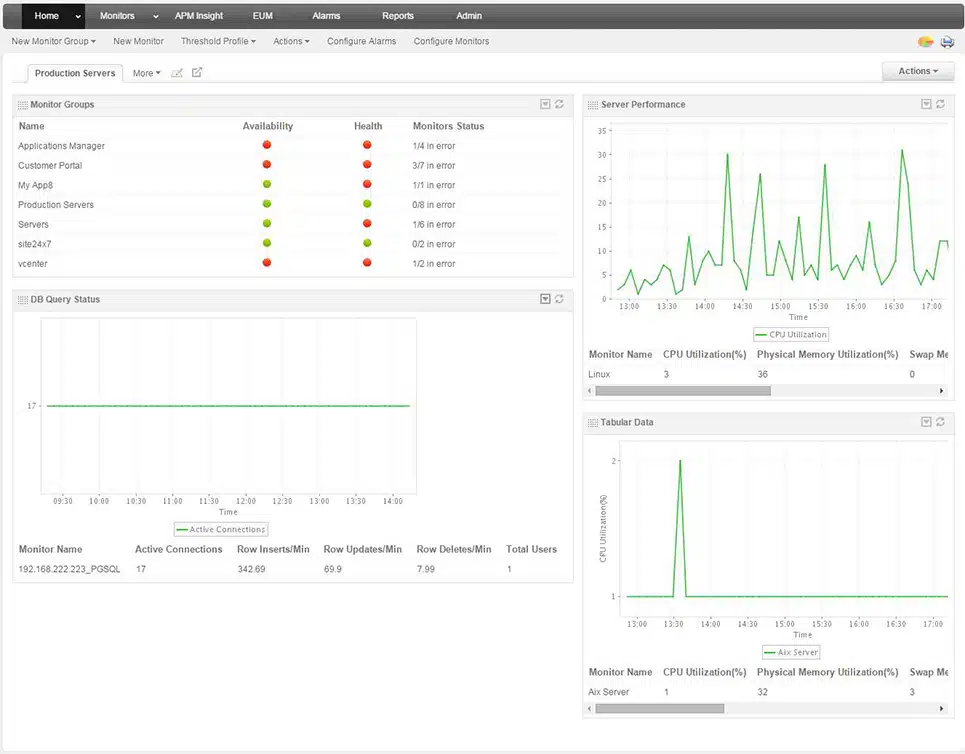
ManageEngine Applications Manager (APM) is an enterprise-ready integrated application and server performance monitoring solution that helps organizations ensure optimal performance of their business-critical applications across physical, virtual, and cloud environments. ManageEngine APM was named Gartner Peer Insights Customers’ Choice for 2021. The tool provides deep visibility into applications and infrastructure components’ performance, including the ability to detect, diagnose, and resolve network performance issues.
Key Features:
- In-Depth Performance Metrics: Monitor crucial JBoss metrics such as JVM usage, thread count, response times, and web transaction details.
- Memory Leak Detection: Detects memory leaks within the JBoss application server by tracking JVM heap and non-heap memory usage, garbage collection, and other memory-related metrics.
- Monitor JBoss Database Metrics: Monitors JBoss database metrics such as JDBC connection pool size, number of connections in use, and connection creation/destruction.
- Transaction Tracing: With Applications Manager, you can track and visualize transaction flows within the JBoss environment.
- Out-Of-The-Box Reports: Offers pre-built reports for trend analysis, bottleneck identification, and capacity planning in JBoss environments.
Why Do We Recommend It?
ManageEngine Applications Manager is recommended for its comprehensive monitoring tools, ease of use, and ability to integrate across various platforms. It’s an excellent solution for businesses that need reliable, scalable, and detailed application and server monitoring.
ManageEngine APM can detect issues related to the performance of web applications deployed on JBoss as well as components such as Java virtual machine (JVM), Enterprise Java Beans (EJBs), Java database connection pools (JDBC), and servlets.
Who Is It Recommended For?
ManageEngine Applications Manager is recommended for a broad range of users, particularly IT administrators and operations managers in medium to large enterprises who are responsible for ensuring the performance and availability of their IT infrastructure.
Pros:
- User-Friendly Interface: The dashboard and reporting interfaces are intuitive and customizable, facilitating easy navigation and data visualization.
- Automated Actions: Allows the configuration of automated scripts that can be executed in response to specific alerts, helping reduce manual intervention and response times.
- Integration Capabilities: Seamlessly integrates with other IT management tools and applications, enhancing its utility in a complex IT infrastructure.
- Mobile Accessibility: Offers mobile web client and native iPhone app for monitoring JBoss servers from anywhere.
Cons:
- Specialized for JBoss Environments: The tool’s specialization for JBoss environments may limit its suitability for organizations using other application servers or platforms.
A free personalized demo and a free 30-day trial are available on request.
2. Site24x7 APM (FREE TRIAL)
Site24x7 APM is a cloud-based application performance monitoring tool that enables organizations to monitor and analyze the performance of their critical business applications and databases running on various platforms like Java, Node.js, Ruby, PHP, and .NET across cloud, virtual, and physical servers. Site24x7 APM tracks transactions, spots application dependencies, and identifies anomalies in real-time, thereby ensuring a seamless end-user experience.
Key Features:
- JVM Metrics: It delivers detailed metrics on Java Virtual Machine (JVM) performance, including heap memory usage, garbage collection, thread count, and CPU usage, which are critical for tuning and maintaining the health of JBoss servers.
- Application Performance Monitoring: Allows organizations to monitor and analyze the performance of critical business applications running on various platforms.
- Real-Time Transaction Monitoring: Tracks transactions, identifies application dependencies, and detects anomalies in real-time to ensure a seamless end-user experience.
- Support for Java Applications: Specifically monitors Java applications and supports a wide variety of application servers such as WebSphere, WebLogic, JBossEAP, and WildFly.
- Monitoring JVM Parameters: Monitors critical parameters of the Java Virtual Machine (JVM) such as CPU usage, memory usage, garbage collection count, and thread summary.
Why Do We Recommend It?
We recommend Site24x7 APM as a JBoss monitoring tool due to its suite of features that ensure optimal performance and reliability of JBoss applications. It provides detailed application insights through metrics like JVM utilization and response times, alongside real-time analytics for swift troubleshooting.
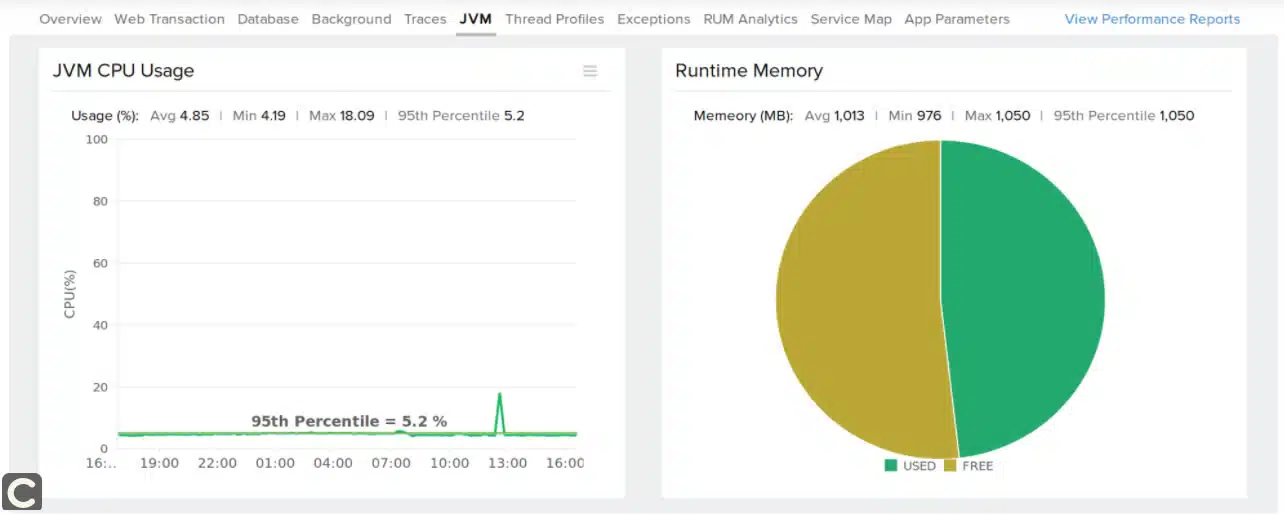
Site24x7 APM insight provides IT teams with a complete picture of application performance, including Java applications. Site24x7’s Java monitoring tool supports a wide variety of application servers such as WebSphere, WebLogic, JBossEAP, and WildFly. It monitors critical parameters of JVM like JVM CPU usage count, memory usage, GC count, and thread summary. It allows you to configure threshold values for your JVM metrics to get alerted whenever there is an outage.
Who Is It Recommended For?
Site24x7 APM is suitable for IT administrators and DevOps teams in medium to large enterprises, and any organization that needs detailed and proactive monitoring of their JBoss application servers to ensure performance issues are quickly identified and addressed, supporting smooth and efficient operations.
Pros:
- Multi-Platform Support: Site24x7 APM supports monitoring applications built on Java, Node.js, Ruby, PHP, and .NET across cloud, virtual, and physical servers.
- Cloud-Based: As a cloud-based solution, Site24x7 requires no extensive on-premises infrastructure, making it cost-effective and scalable for businesses of all sizes.
- Global Points of Presence: With multiple monitoring locations around the world, it can provide insights into how applications perform across different geographies, which is particularly valuable for global applications.
- Mobile Access: Provides mobile apps for both iOS and Android, allowing IT professionals to monitor and respond to alerts on the go.
Cons:
- Cloud Dependency: Relies on cloud infrastructure, which may be a limitation for organizations with strict data privacy or compliance requirements that mandate on-premises solutions.
- Subscription-Based Model: Requires a subscription, which may not be suitable for organizations with budget constraints or those preferring one-time payment options.
Site24x7 licensing is based on a monthly or annual subscription model. A free 30-day trial is available on request.
3. Dynatrace
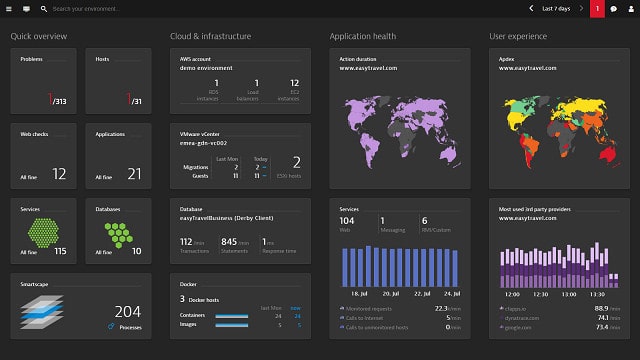
The Dynatrace is an agent-based on-premises and cloud software intelligence platform that uses AI to deliver infrastructure, application, and microservices monitoring, among others. The Dynatrace platform provides observability of the full solution stack, including automated problem remediation.
Key Features:
- Agent-Based Monitoring: Utilizes an agent-based approach for on-premises and cloud software intelligence, allowing for comprehensive monitoring of infrastructure, applications, and microservices.
- AI-Driven Monitoring: Leverages AI to deliver intelligent monitoring, automated problem remediation, and observability of the full solution stack.
- Smartscape: Offers topology mapping and visualization for understanding the relationships and dependencies within the monitored environment.
- PurePath: Enables code-level distributed tracing for detailed insights into application performance.
Why Do We Recommend It?
Dynatrace is highly recommended as a JBoss monitoring tool due to its advanced, all-in-one approach that leverages artificial intelligence to provide deep insights into application performance, infrastructure, and user experience.
Dynatrace was named Gartner Peer Insights Customers’ Choice for 2021. The platform consists of OneAgent client app for automated data collection, Smartscape for topology mapping and visualization, PurePath for code-level distributed tracing, and Davis, a proprietary AI engine, for automatic root-cause fault-tree analysis.
Dynatrace monitors and analyzes the activities of JBoss/WildFly application servers, and shows you where your Java application consumes CPU in background threads, schedulers, or other services on JBoss. It also monitors and analyzes the database activities of your Java applications running on JBoss/WildFly, providing visibility down to the individual database statements. The performance metrics you will be able to monitor for JBoss/WildFly include JVM metrics, garbage collection metrics, suspension rate, all database statements, requests, and dependencies.
Who Is It Recommended For?
Dynatrace is recommended for any organization that demands high performance, reliability, and deep insights into their JBoss applications and associated IT infrastructure.
Pros:
- Comprehensive Monitoring: Monitors and analyzes activities of JBoss/WildFly application servers, providing insights into CPU consumption, database activities, JVM metrics, garbage collection metrics, suspension rate, and more.
- AI-Driven Problem Remediation: Leverages AI for automated problem remediation and root-cause analysis, reducing manual intervention and improving response times.
- Topology Mapping: Offers visualizations through Smartscape for understanding the topology and dependencies within the monitored environment.
- Gartner Recognition: Named Gartner Peer Insights Customers’ Choice for 2021, indicating high customer satisfaction and recognition in the industry.
Cons:
- Complexity: The comprehensive feature set and AI-driven approach may lead to a learning curve and complexity in setup and configuration.
- Cost: As a feature-rich platform with AI capabilities, Dynatrace may come with higher costs compared to simpler monitoring solutions.
Dynatrace operates a flexible pricing model that gives you the option for perpetual or annual licensing. A free online demo and a free 15-day trial are available on request.
4. Instana APM
Instana is a German-American software firm (now part of IBM) that develops Application Performance Management (APM) software. Instana’s range of products covers areas such as enterprise observability, website monitoring, cloud & infrastructure monitoring, microservices monitoring, and application performance monitoring (APM). Instana was also a recipient of the Gartner Peer Insights Customers’ Choice for 2021.
Key Features:
- Support for WildFly and JBoss Data Grid: Specifically supports monitoring and resolving issues related to WildFly (JBoss AS) and JBoss data grid.
- Application Performance Management (APM): Provides APM capabilities for monitoring and fixing application performance issues.
- Enterprise Observability: Offers observability solutions for enterprises to gain insights into their applications and infrastructure.
- Cloud & Infrastructure Monitoring: Monitors cloud and infrastructure components for performance and reliability.
- Microservices Monitoring: Monitors microservices architecture for performance optimization and issue resolution.
Why Do We Recommend It?
Instana APM’s advanced monitoring features, combined with its ease of use and intelligent automation, make it an excellent choice for organizations that need a reliable and efficient way to monitor their JBoss environments.
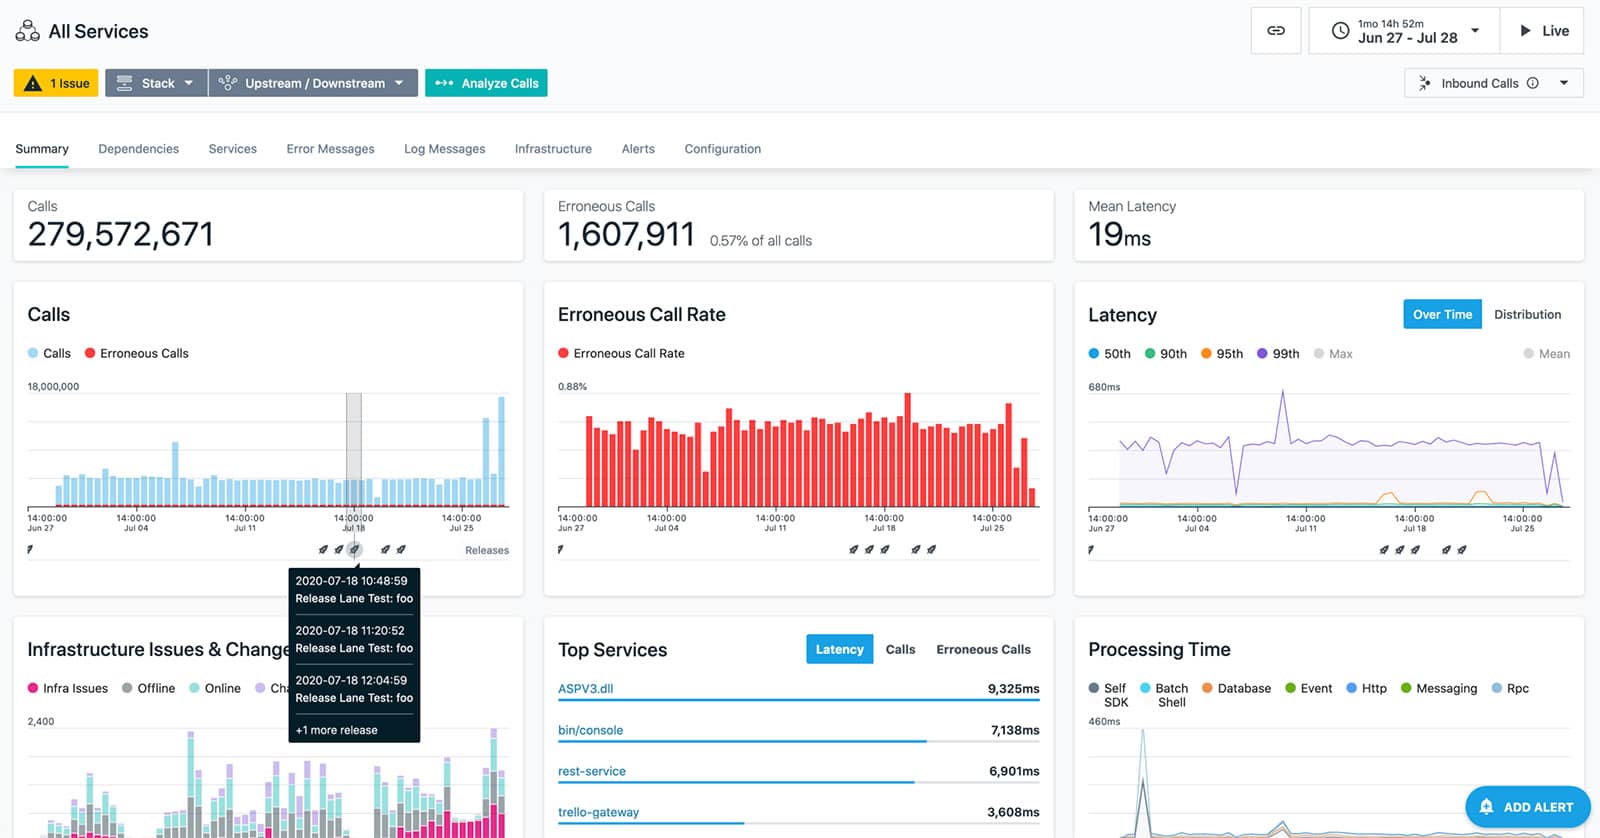
Instana APM monitors and fixes application performance issues before they impact end-users. It supports the monitoring and resolution of issues related to WildFly (JBoss AS) and JBoss data grid. Instana also supports both on-premises and cloud-based deployment models.
Who Is It Recommended For?
Instana APM is particularly recommended for any business or service provider that requires a sophisticated, real-time monitoring solution capable of handling the complexities of modern IT environments where JBoss is a critical component.
Pros:
- On-Premises and Cloud Deployment: Supports both on-premises and cloud-based deployment models, providing flexibility in deployment options.
- Flexible Deployment Options: Supports both on-premises and cloud deployment models, catering to different organizational needs.
- Flexible Licensing Model: Utilizes a flexible licensing model based on the number of hosts monitored per month, offering scalability and cost-effectiveness.
- Free Trial: Offers a free trial period for users to test the platform’s capabilities before making a commitment.
Cons:
- Cost: While the per host/per month licensing model offers flexibility, the overall cost may vary based on the number of hosts monitored, potentially leading to higher costs for larger deployments.
- Learning Curve: Like any comprehensive monitoring tool, Instana APM may have a learning curve for users unfamiliar with its features and capabilities.
The licensing model is per host/per month and it’s billed annually. A host is considered to be any physical or virtual OS instance that you monitor with Instana. A 14-day free trial is available on request.
5. Datadog
Datadog is a SaaS-based infrastructure performance monitoring service for cloud applications, servers, databases, and other services. Datadog provides IT operations teams real-time visibility into the performance of the infrastructure through a single visual interface.
Key Features
- SaaS-based Infrastructure Performance Monitoring: Provides real-time visibility into the performance of cloud applications, servers, databases, and other services through a single visual interface.
- Integration with JBoss/WildFly Applications: Integrates with JBoss/WildFly applications to collect metrics, events, and logs, allowing for comprehensive monitoring of Java-based applications.
- Agent-based Monitoring: Utilizes agents to collect metrics, traces, and logs from monitored devices and applications.
- Auto-discovery Service: Automatically explores and identifies devices in the network to create a device inventory and network topology map.
Why Do We Recommend It?
Datadog is a powerful and versatile AIOps platform that excels at JBoss monitoring as part of a unified IT monitoring strategy. Its comprehensive features, detailed insights, and customization options make it valuable for organizations with complex IT environments.
Datadog is agent-based and uses its auto-discovery service to explore and identify devices in your network. The outcome of the auto-discovery service is then used to create a device inventory and network topology map, which forms an index for the complete monitoring service. Once all devices and links have been identified, you can overview all network activity from the Datadog dashboard.
Just like other applications, Datadog has built-in capabilities to integrate with and monitor the performance of JBoss/WildFly applications to aggregate metrics and events. The Datadog Java integration allows IT teams to collect metrics, traces, and logs from your JBoss/WildFly application. You can create custom alerts for any metric or performance problem. Datadog provides high-resolution interactive dashboards to help companies monitor and graph real-time metrics and events.
Who Is It Recommended For?
Datadog is recommended for large enterprises, SMBs, IT Teams and System Administrators, DevOps Teams, and any organization that requires detailed and proactive monitoring to ensure the optimal performance and reliability of their JBoss applications.
Pros:
- Comprehensive Monitoring: Monitors various aspects of infrastructure, including cloud applications, servers, databases, and services, offering a comprehensive monitoring solution.
- Custom Alerting: Enables users to set up custom alerts for specific metrics or performance issues, facilitating proactive monitoring and problem resolution.
- Interactive Dashboards: Provides high-resolution interactive dashboards for real-time monitoring and visualization of metrics and events.
- Scalability: SaaS-based model allows for scalability, making it suitable for organizations of different sizes and varying monitoring needs.
Cons:
- Cost: Being a SaaS-based service, Datadog’s cost may vary based on usage and the number of monitored devices, potentially leading to higher costs for larger deployments.
- Learning Curve: Like any comprehensive monitoring tool, Datadog may have a learning curve for users unfamiliar with its features and configuration options.
A free 14-day-trial with full access to all the features is available for download. After that, the software is generally sold through monthly/annual subscription plans based on hosts, events, or logs.
6. SolarWinds Server & Application Monitor
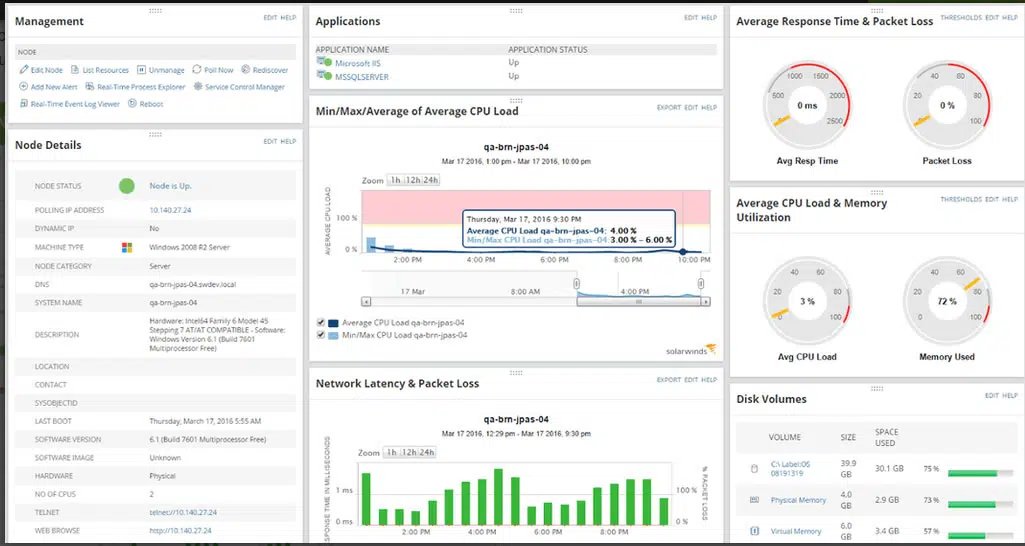
The SolarWinds Server & Application Monitor (SAM) enables IT Teams to gain visibility into the performance and health of JBoss/WildFly application servers. It comes with lots of out-of-the-box monitoring templates to track vital memory statistics such as memory heap, memory pool, garbage collection, and more across your private, public, and hybrid cloud environments.
Key Features:
- Track JBoss Server Hardware Utilization: Monitors hardware utilization including CPU, memory, and disk usage on JBoss servers, with capacity forecasting capabilities.
- Application Monitoring: Includes out-of-the-box monitoring templates for over 1,200 applications, including popular ones like Microsoft SQL Server, Apache, and Oracle, facilitating immediate and effective monitoring setup.
- Performance Metrics: Track performance metrics such as CPU usage, memory utilization, and disk I/O. Customizable alerts notify administrators of potential issues before they become critical.
- Cloud and Hybrid IT Monitoring: Monitor applications and infrastructure hosted on-site, in the cloud, or in hybrid environments, ensuring comprehensive visibility regardless of where resources are located.
- Automation Features: Automate discovery and dependency mapping, which simplifies the setup process and ensures that all components are monitored without manual intervention.
Why Do We Recommend It?
SolarWinds SAM stands out as a JBoss monitoring tool due to its detailed monitoring capabilities, proactive management features, and ease of use. These attributes make it an excellent choice for organizations looking to maintain optimal performance and availability of their JBoss environments.
One of the key capabilities of this tool is its ability to provide alerts that warn you about critical thresholds impacting the performance of JBoss/WildFly before end-users are impacted.
Who Is It Recommended For?
SolarWinds SAM is recommended for IT professionals and system administrators in organizations of all sizes. It’s particularly suited for businesses with complex IT environments that include a mix of operating systems, applications, and infrastructure technologies.
Pros:
- Multi-Vendor Server Monitoring: SolarWinds SAM supports a wide range of server types, including Windows, Linux, and VMware, allowing it to monitor performance metrics across different platforms from a single interface.
- Community and Support: Access to SolarWinds’ large community (THWACK) and robust support from the company help users get the most out of the product through shared knowledge and expert assistance.
Cons:
- Focused on Java and JBoss: The tool’s focus on Java and JBoss environments may limit its suitability for organizations using other technologies or platforms.
Register for a 30-day free trial.
7. AppDynamics
AppDynamics (now part of Cisco) is a full-stack application performance management software that focuses on managing the performance and availability of applications across on-premise and cloud IT infrastructure environments.
Key Features:
- Monitoring Tools for JBoss: Monitors metrics such as CPU, memory, and disk utilization to ensure optimal application performance in Java environments.
- Integration with JMX Server: Connects to the JMX Server of the JBoss application server to view exposed management beans and access JBoss MBean information.
- Business Observability Platform: Provides a comprehensive solution for monitoring and managing the performance of critical business applications, including Java applications.
- Java Agent Integration: Automatically discovers applications running on JBoss servers and visualizes business transactions in AppDynamics.
Why Do We Recommend It?
AppDynamics excels in tracking and analyzing business transactions across JBoss servers, utilizing machine learning to set dynamic performance baselines and detect anomalies. Its automated root cause analysis rapidly identifies the source of performance issues, which significantly reduces downtime and improves recovery times.
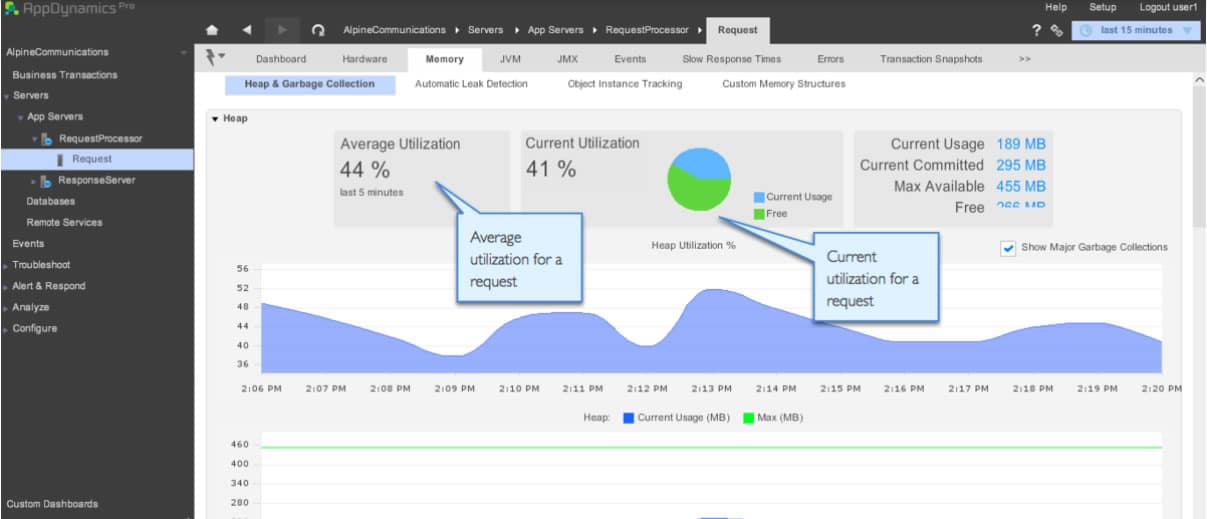
The AppDynamics Business Observability Platform provides a comprehensive solution for monitoring and managing the performance of your critical business applications including Java applications. With the AppDynamics Java agents, applications running on JBoss servers are automatically discovered and show up in AppDynamics. Business transactions.
AppDynamics JBoss monitoring tools make it easier for organizations to deploy applications and visualize metrics such as CPU, memory, and disk utilization to ensure optimal application performance in your Java environment. AppDynamics can easily connect to the JMX Server of the JBoss application server to view exposed management beans. It can also access JBoss MBean information to provide an in-depth view of the memory usage within the JVM and JBoss; as well as the JVM environmental information of your application running on JBoss.
Who Is It Recommended For?
AppDynamics is a compelling choice for large enterprises and technology-focused companies that depend on robust, analytical tools for monitoring critical applications and infrastructure. Companies undergoing digital transformations find AppDynamics beneficial for ensuring stability and optimal performance of new technologies and services.
Pros:
- Application Performance Management: Focuses on managing the performance and availability of applications across on-premise and cloud IT infrastructure environments.
- Free Demo and Trial: Offers a free online demo and a 15-day trial for users to experience the platform’s capabilities.
- Automatic Discovery: Automatically discovers applications running on JBoss servers, simplifying deployment and monitoring processes.
- Integration Capabilities: Integrates with JMX Server and accesses JBoss MBean information for detailed monitoring and analysis.
Cons:
- Cost: Being a comprehensive application performance management solution, AppDynamics may come with higher costs compared to simpler monitoring tools.
- Learning Curve: Users may experience a learning curve when initially setting up and configuring AppDynamics for their monitoring needs.
A free online demo and a free 15-day trial are available on request.
8. eG Enterprise APM
eG Enterprise is an end-to-end APM and infrastructure monitoring solution that allows enterprises to detect, diagnose, and resolve application performance issues before they impact end-users. It includes both synthetic and Real User Monitoring (RUM) to give you the complete set of metrics required to monitor end-user digital experience as they interact with enterprise applications and services. The software supports agent-based and agentless on-premise, cloud, and hybrid deployment models.
Key Features:
- Auto-Discovery and Dependency Mapping: Automatically discovers all components of the JBoss environment and maps dependencies, providing a clear visual representation of the application architecture.
- Real User Monitoring (RUM): Integrates real user monitoring to track user interactions with applications deployed on JBoss.
- Synthetic Transaction Monitoring: Uses synthetic monitoring to simulate user interactions with applications to test performance and availability.
- Reporting and Alerts: Offers customizable reporting and real-time alerting features, enabling proactive management of the application environment.
- JVM Performance Monitoring: Monitors every aspect of JVM performance, including CPU, heap and non-heap memory, threads, classes, garbage collection, and more.
Why Do We Recommend It?
eG Enterprise APM offers in-depth visibility into the entire JBoss application ecosystem, including Java virtual machines (JVMs), databases, and connected infrastructure. eG Enterprise APM excels in its ability to automatically discover and map dependencies, providing real-time analytics and detailed performance metrics which are crucial for diagnosing issues quickly and efficiently.
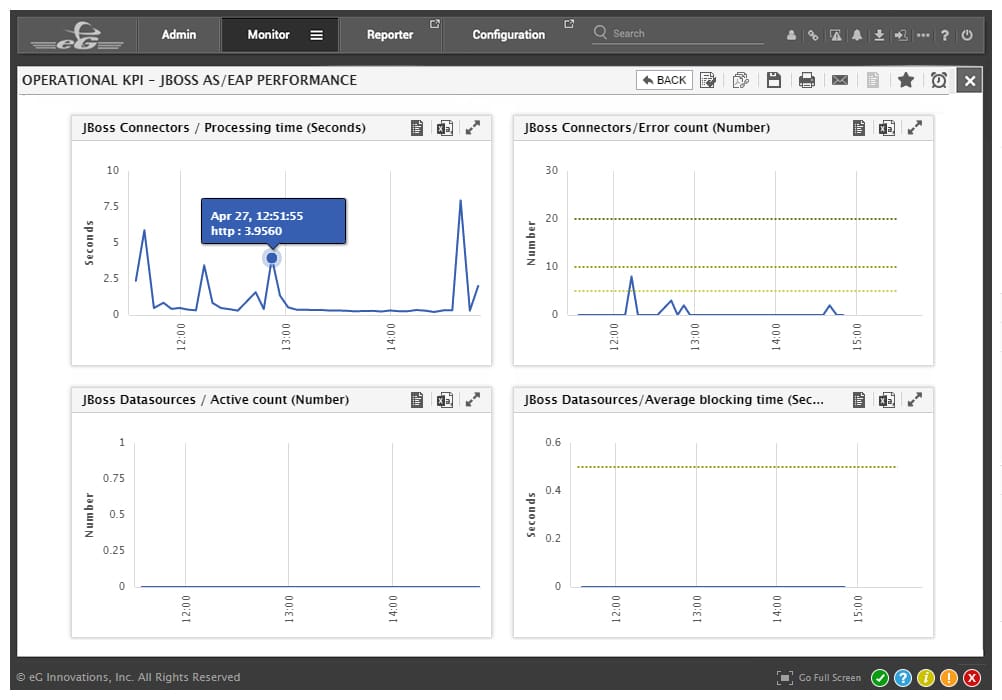
eG Enterprise monitors your entire JBoss/WildFly infrastructure and provides a single-pane-of-glass view of your JVM, web and EJB containers, application code, database connections, and more; giving you actionable insights using alerts, self-learning baseline thresholds, and built-in correlative intelligence.
Who Is It Recommended For?
eG Enterprise APM is particularly recommended for IT operations teams, system administrators, and DevOps professionals managing complex JBoss environments that require rigorous monitoring to avoid downtime and performance lags.
Pros:
- Tailored Monitoring for JBoss and WildFly: Offers purpose-built monitoring models for JBoss and WildFly, ensuring comprehensive monitoring and diagnostics for Java applications.
- Comprehensive Diagnostics: Offers diagnostics for all aspects of JBoss performance, including components such as Java transactions, EJB, JSP, Servlets, DataSource, Connectors, JMS Message Queues, JPA, and more.
- Code-Level Visibility: Provides code-level visibility for application performance optimization, allowing for targeted troubleshooting and optimization efforts.
- Deep Performance Insights: Delivers deep performance insights and KPIs, enabling IT teams to identify and resolve performance issues quickly and efficiently.
Cons:
- Complexity: Like any comprehensive monitoring tool, eG Enterprise APM may have a learning curve for users unfamiliar with its features and configuration options.
- Cost: Comprehensive monitoring solutions like eG Enterprise APM may come with higher costs compared to simpler monitoring tools, especially for larger deployments.
eG pricing is based on your preferred deployment model which includes SaaS/cloud, subscription, or perpetual license. A free online demo and a free 30-day trial are available on request.
9. Atatus APM
Atatus is a technology company that develops observability platforms for monitoring and managing enterprise applications. Atatus range of products covers areas such as log monitoring, synthetic, and real user monitoring, infrastructure monitoring, application performance monitoring (APM), among others.
Key Features:
- JBoss Diagnostics and Fixes: Atatus goes beyond basic monitoring by offering JBoss-specific diagnostics and potential fixes. This can expedite troubleshooting and resolutions of JBoss-related performance issues.
- Transaction Monitoring: Analyze percentiles, histograms, and error rates to identify slow-performing routes and bottlenecks within your JBoss applications.
- Database Monitoring: Atatus helps pinpoint slow SQL queries impacting application performance and allows for optimizing database interactions.
- External Services Monitoring: Atatus monitors interactions with external APIs and services, helping you understand their impact on overall application health.
- Application Error Tracking: Atatus helps identify and troubleshoot errors occurring within your JBoss applications. It provides detailed error logs and traces, allowing you to pinpoint the root cause of issues efficiently.
- API failure detection: Spot and fix JBoss/WildFly API failures, ensuring the reliability and availability of APIs in your application.
Why Do We Recommend It?
We recommend Atatus APM as a JBoss monitoring tool for its focus on application performance and potential cost-effectiveness. Atatus dives deep into JBoss application health, providing transaction tracking, database monitoring, external service monitoring, and more. This allows you to pinpoint performance bottlenecks within your JBoss applications and identify how external factors might be impacting them.
Atatus APM solution helps IT teams gain visibility into JBoss/WildFly performance in real-time to identify Java performance issues and errors on every business transaction. Atatus JBoss monitoring includes metrics and parameters such as failed HTTP status codes, application crashes, transaction details, slow database queries, poor performing network calls, and lets you see how they are impacting user experience.
Who Is It Recommended For?
Atatus is a good fit for organizations seeking a user-friendly and cost-effective JBoss monitoring solution with a focus on application performance. It is particularly suitable for developers, IT operations teams, and DevOps professionals who need to ensure the seamless performance of applications running on JBoss.
Pros:
- Ease of Use: Atatus offers a user-friendly interface, making it easier to set up and use for JBoss monitoring, even for users with limited technical expertise.
- Comprehensive Alerting: Provides alerts for application errors and exceptions through multiple channels, facilitating quick response and issue resolution.
- Performance Optimization Tools: Helps identify performance bottlenecks and provides diagnostics for performance errors, enabling targeted optimization efforts.
- Application Performance Insights: Offers insights into application performance and API failures, allowing for proactive management of application performance.
Cons:
- Learning Curve: Like any comprehensive monitoring tool, Atatus APM may have a learning curve for users unfamiliar with its features and configuration options.
- Cost: Comprehensive monitoring solutions like Atatus APM may come with higher costs compared to simpler monitoring tools, especially for larger deployments.
A free online demo and a free 14-day trial are available on request.
10. Nagios
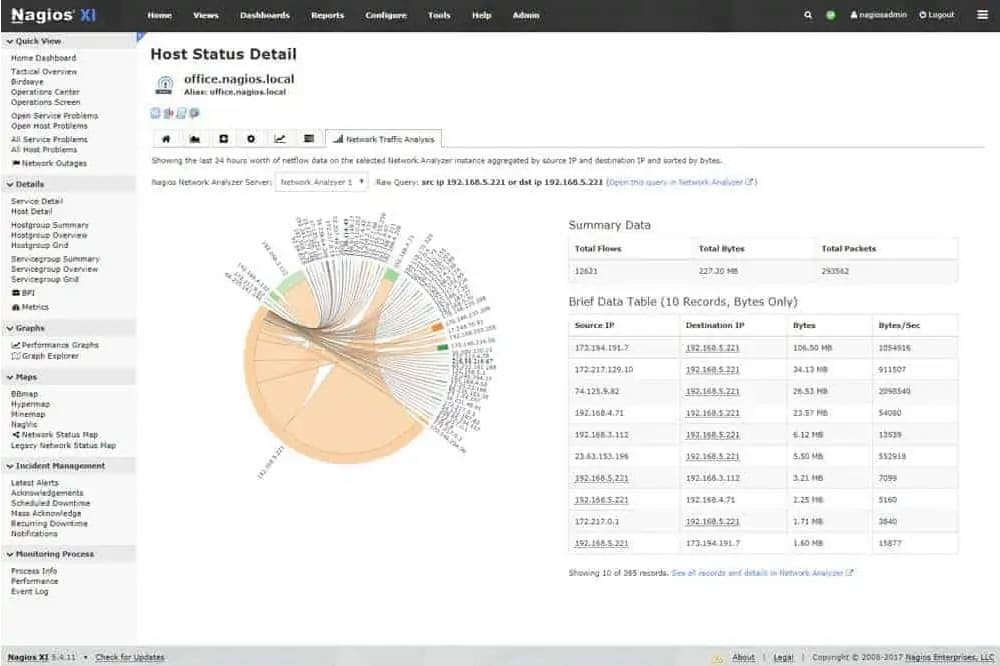
Nagios is a U.S-based company that delivers IT infrastructure monitoring and management software. Their monitoring solution comes in two editions—Nagios Core and Nagios XI. Nagios Core is an agent-based free and open-source infrastructure monitoring application; while Nagios XI is a GUI-based agentless commercial edition that uses Nagios Core as its back-end.
Key Features:
- JBoss/WildFly Monitoring: Both Nagios Core and Nagios XI editions provide JBoss/WildFly monitoring capabilities, including memory usage, thread status, and more.
- Configuration and Maintenance: Provides a configuration-based approach, which, although initially complex, offers high flexibility and control over monitoring setups.
- Performance Graphs: Includes capabilities for creating detailed performance graphs over time, aiding in trend analysis and capacity planning.
- Network Monitoring Capabilities: Besides application monitoring, Nagios excels in network monitoring, making it possible to oversee the entire infrastructure that supports JBoss applications.
Why Do We Recommend It?
Nagios is recommended as a JBoss monitoring tool for its flexibility in managing large and complex IT infrastructures. Nagios provides oversight of JBoss environments by tracking server health, availability, and response times. However, it’s not a dedicated APM tool.
If you are already using Nagios as a monitoring tool in your environment, you do not need another tool to monitor JBoss/WildFly application servers. Both editions of Nagios provide JBOSS monitoring capabilities. However, for ease of setup and deployment, the Nagios XI edition is recommended. Nagios is capable of monitoring attributes of JBoss/WildFly servers such as memory usage, thread status, and others using the JBoss/WildFly wizard or a plugin so that users may be notified when JBoss/WildFly applications are behaving abnormally.
Who Is It Recommended For?
Nagios is particularly recommended for IT professionals and system administrators in environments where stable operation and high availability are critical. It’s ideal for cost-conscious organizations with uncomplicated JBoss environments. But for organizations seeking deep performance insights, user experience monitoring, or advanced JBoss-specific features, opting for a dedicated APM solution is recommended.
Pros:
- Two Editions: Nagios offers two editions—Nagios Core (agent-based, free, and open-source) and Nagios XI (GUI-based, agentless, commercial edition).
- Flexibility: Nagios offers flexibility with two editions catering to different monitoring needs—Nagios Core for open-source enthusiasts and Nagios XI for commercial use.
- Customizable Plugins: Nagios’ functionality can be extended with numerous plugins available, many of which are specifically designed for JBoss.
- Ease of Setup (Nagios XI): Nagios XI edition offers a GUI-based interface for easier setup and deployment, suitable for users looking for a more user-friendly monitoring solution.
Cons:
- Complexity (Nagios Core): Nagios Core, being agent-based and open-source, may have a steeper learning curve and requires more manual configuration compared to Nagios XI.
- Cost (Nagios XI): Nagios XI is a commercial edition, which may involve costs for licensing and support, depending on the organization’s needs and deployment size.
Nagios XI is available in Standard and Enterprise editions. The Enterprise Edition provides you with features designed to aid in large-scale configuration and deployment. A free online demo and a free 30-day trial are available on request.
