
If your business relies on a mainframe – or a fleet of them – you will probably be using the native monitoring package that comes with its operating system.
Here is our list of the best mainframe monitoring tools:
- ManageEngine OpManager Plus EDITORS’ CHOICE This monitoring system for networks, endpoints, and applications includes the capability to track the performance of IBM z series mainframes. Start a 30-day free trial.
- Site24x7 (FREE TRIAL) A comprehensive platform that provides deep visibility into the health and performance of your mainframe servers, along with providing real-time insights for quick remediation. Start a 30-day free trial.
- Datadog Infrastructure Monitoring This monitoring service for networks, computers, and services covers all of the support systems behind front-ends software. It can be extended with specialist mainframe monitoring plug-ins. This is a cloud-based package.
- IntelliMagic Vision for z/OS This package of monitoring systems tracks all aspects of your IBM mainframe-based infrastructure including both hardware and software performance. Runs on your z series mainframe or can be accessed as a SaaS package.
- BMC Automated Mainframe Intelligence (AMI) A suite of mainframe monitoring and management tools that include performance tuning and security monitoring. Delivered as a SaaS platform.
- Rocket TMON for z/OS A package of performance monitoring systems for IBM z series mainframes that can monitor several devices over a network and export data for analysis in other tools. Runs on z/OS.
- Z-RAYS This tool collects logs and accesses on-board native sensors to provide a central and interpreted display of IBM z series mainframe performance and can also provide a SIEM data feed. Available as a SaaS platform.
This strategy has the advantage of guaranteed compatibility because the monitor is produced by the mainframe provider and interlaced with its operating system and hardware sensors. However, onboard monitors are dedicated to one machine. Hence, covering many mainframes requires switching consoles regularly.
If you want to centralize your device management in one tool, you need to move away from native monitors and look for third-party systems that can interact with your servers, desktops, network devices, and IoT equipment as well as your mainframes.
Unifying monitoring systems across equipment categories has the advantage of giving you the capability to spot bottlenecks in services and clashes in activities. Just watching your mainframe’s performance in isolation misses the threats that inefficient network configurations can create. You also need to consider application performance in conjunction with the hardware that supports it.
Mainframe monitoring issues
Organizations that invest so much in order to get the processing power provided by a mainframe can’t afford to let that machine run at less than peak performance. The system needs to be operational during business hours and can also be required to run around the clock. Scheduled maintenance and software upgrades have to be timed carefully. So, knowing the full demand cycle of your mainframe is important.
Demand analysis and capacity planning are important functions of mainframe monitoring. The system management tasks that you need to perform can only be implemented with detailed knowledge of the load profile on the computer.
A full assessment of mainframe performance should be implemented in conjunction with an understanding of the applications that run on it and how they are delivered. Fine-tuning the operations of those applications can squeeze extra capacity from your valuable mainframe resources.
The best mainframe monitoring tools
Monitoring is important for mainframes as part of a suite of infrastructure services. For the best mainframe monitoring systems, you need to identify packages that can cover the applications that run on them as well.
Our methodology for selecting a mainframe monitoring tool
We reviewed the market for mainframe monitoring software and analyzed the tools based on the following criteria:
- Packages that can monitor multiple mainframes and aggregate performance reports
- Systems that can track the utilization of the physical resources of the mainframe
- Monitoring features for the applications that run on the mainframe
- Forecasting for demand over time
- Capacity planning tools that can predict demand growth
- Free trial or a demo system that enables a no-cost assessment
- Value for money from a package that can monitor entire systems and is charged for at a fair price
Systems that combine mainframe monitoring with the ability to track the activity on other resources save money and centralize monitoring systems in one console. Although Fujitsu has the largest market share worldwide as a mainframe supplier, there are more monitoring tools available for the IBM z series.
1. ManageEngine OpManager Plus (FREE TRIAL)

ManageEngine OpManager Plus is an on-premises package that watches over the full-service stack from networks up through hosts and onto services and applications. This system is capable of monitoring mainframes that run z/OS as well as servers running Windows and Linux.
Key Features:
- Monitors all equipment and services
- Unifies mainframe, network, virtualization, and server monitoring
- Includes bandwidth monitoring and management
- Tracks the physical resources of IBM z series mainframes
- Centralized IP address management
Why do we recommend it?
ManageEngine OpManager Plus is a super package of ManageEngine modules and gives you all of the monitoring systems for running a data center. This includes the ability to monitor z Series mainframes. The collection of statistics from z/OS provides full stack monitoring and lateral activity tracking across your enterprise.
The software for OpMnager Plus doesn’t run on z/OS. However, it can monitor IBM z series mainframes across a network. It is also possible to include monitoring of virtual systems on your premises and the cloud. OpManager Plus can monitor services running on AWS and Azure.
OpManager Plus includes extensive network management tools, such as its IP Address Manager and Switch Port Mapper. The system can spot exactly which element of the system is causing performance problems, which saves time on coming up with a resolution.
The package includes an alerting mechanism, which will send out notifications by email, voice call, SMS, or Slack message if an issue has been detected.
Who is it recommended for?
ManageEngine OpManager Plus is a very large package that covers everything to do with networks and servers. It is just about the entire menu of ManageEngine modules bundled into one package. As such, it is suitable for businesses that aren’t already running some type of monitoring system or want to scrap everything and start again.
Pros:
- Cross-platform monitoring
- Centralized monitoring for multiple sites
- Root cause analysis
- Performance alerts
- Multi-platform system; host on Windows Server or Linux
Cons:
- Not offered as a SaaS package
ManageEngine OpManager Plus installs on Windows and Linux but will monitor devices of other operating systems, including z/OS, across the network. You can test the product with a 30-day free trial.
EDITOR'S CHOICE
ManageEngine OpManager Plus is our first choice for a mainframe monitoring tool because it provides a comprehensive, user-friendly solution tailored to the demands of mainframe environments. Unlike many monitoring tools that focus only on traditional IT infrastructure, OpManager Plus supports mainframes, giving complete visibility into both legacy and modern systems. A major advantage is its multi-platform compatibility, including support for IBM z/OS, which allows IT teams to monitor mainframes alongside servers, network devices, and applications. This unified approach simplifies oversight by providing a single dashboard to track system health and performance. OpManager Plus delivers real-time monitoring and detailed insights into key metrics such as CPU utilization, memory usage, disk space, and I/O operations. Its reporting capabilities help administrators identify potential bottlenecks and performance issues before they affect system stability. The platform is also highly scalable, suitable for businesses of all sizes, and can grow with organizational needs. Customizable alerts and automated remediation ensure that performance deviations are addressed promptly, minimizing downtime and keeping critical mainframe systems running smoothly.
Download: Get a 30-day FREE Trial
Official Site: https://www.manageengine.com/it-operations-management/download.html
OS: Windows Server and Linux
2. Site24x7 (FREE TRIAL)

Site24x7 is a comprehensive server monitoring platform that provides deep visibility into the health, availability, and performance of all servers and applications, including mainframes, to help you stay on top of all that is happening in your network. Its auto-remediation capabilities, real-time insights, and AI-driven intelligent monitoring make it a highly useful tool for any organization.
Key Features
- Unifies metrics, logs, and events for detailed insights into server and application performance.
- Tracks the behavior of services and processes to proactively resolve critical issues.
- Offers AI-driven insights to shift from reactive to proactive monitoring.
- Provides automation profiles for easy remediation.
- Generates meaningful alerts, without causing fatigue.
Why do we recommend it?
We recommend Site24x7, as it is a comprehensive platform for managing your Mainframe servers and applications. It continuously scans your applications and servers and gathers data about their critical metrics. It analyzes these metrics to identify anomalies and deviations from established thresholds, which could indicate a potential issue.
One aspect that stands out for us is its intuitive user interface. Despite including complex features, it is still relatively easy to use, and is a good way to gain comprehensive visibility into your servers and applications. Armed with this information, you can proactively resolve issues before they impact the organization.
Who is it recommended for?
It is recommended for mainframe engineers and developers, as well as server administrators and anyone requiring visibility into the health and performance of servers.
Pros:
- Comprehensive, and covers every aspect of operations.
- Enables you to proactively address issues.
- Generates relevant alerts, along with detailed information behind each alert.
- Comes with an intuitive and easy-to-use UI.
- Offers auto-remediation.
Cons:
- It may be too overwhelming for smaller organizations.
Site24x7 comes in three plans – Lite, Professional, and Enterprise, each of which are priced at $9, $42, and $625, respectively.
Register for access to the 30-day free trial.
3. Datadog Infrastructure Monitoring
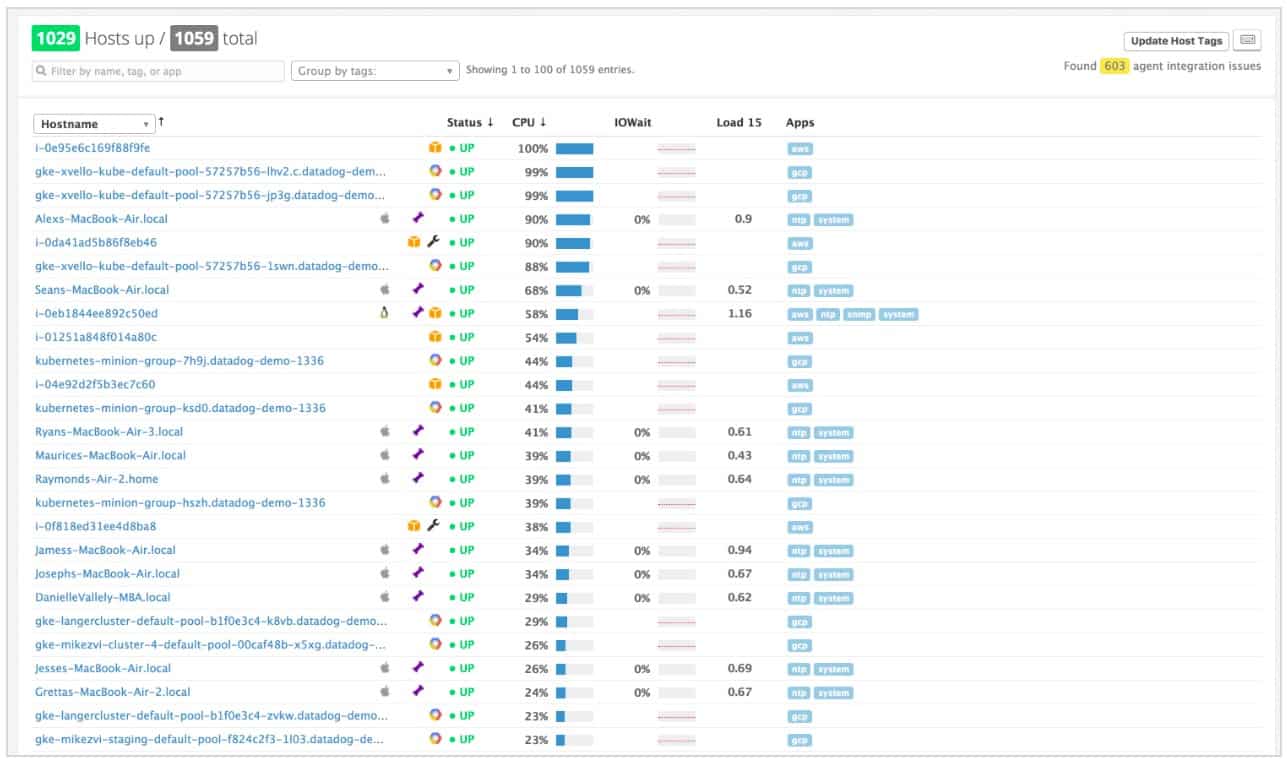
Datadog Infrastructure Monitoring is a SaaS package that monitors all of the applications and services that lie behind user-facing software, apps, and websites. It tracks the performance down to the resources of the host that runs all of these systems but doesn’t go down to the network, which is covered by two other modules that can be added on.
Key Features:
- SaaS service
- Monitors Windows and Linux servers
- Expands to monitor IBM z series mainframes
- Tracks services and applications
- Multi-site and hybrid monitoring
Why do we recommend it?
Datadog Infrastructure Monitoring is part of a cloud platform of system monitoring services. This package can be expanded by adding integrations and plug-ins. The z/IRIS plug-in is available for IBM z Series mainframe monitoring. This enables the activities of your mainframe to be integrated into system-wide monitoring.
The Datadog Infrastructure Monitoring service can be expanded by integrations and plug-ins. While integrations are free, plug-ins are third-party utilities that are charged for. There is a plug-in on the Datadog Marketplace to add on monitoring capabilities for IBM z series mainframes. That additional service is called z/IRIS and it is supplied by mainstoreconcept.
The add-on creates an interface between the IBM mainframe and the Datadog monitoring system. That means you can access live performance data about your mainframe and the software that is running on it directly within the Datadog console.
The z/IRIS system is an additional service, so you can still monitor endpoints in your network such as servers and desktops running Windows, Linux, and macOS. The Infrastructure Monitoring system is also able to monitor cloud platforms, such as AWS and Azure. So, you can centralize the management of all of your resources with this tool.
Who is it recommended for?
While there are many system monitoring packages available, few of them will monitor mainframes. This means that teams that manage a z Series mainframe will have to use a separate monitoring tool for that computer. However, this Datadog solution resolves that problem. It integrates z Series monitoring with the Datadog service map and automated monitoring processes.
Pros:
- Integrates mainframe monitoring with the rest of your infrastructure
- Alerts for performance problems
- AI-based z/OS problem detection
- Performs security monitoring for mainframes
- Includes application monitoring for z/OS-based activity
Cons:
- No free trial for z/IRIS
Both Datadog and z/IRIS are cloud-based systems, so you don’t need to download any software package to get started. However, you will need to install agents on your mainframe and a server on your network. You can get a 14-day free trial of Datadog Infrastructure Monitor and you can request a demo of z/IRIS.
4. IntelliMagic Vision for z/OS
IntelliMagic Vision for z/OS is a package of tools to monitor and manage IBM z series mainframes. The tools can be used to identify performance problems and implement system improvements.
Key Features:
- Identifies changes in demand
- Ranks events by significance
- Includes tools to tune the performance
Why do we recommend it?
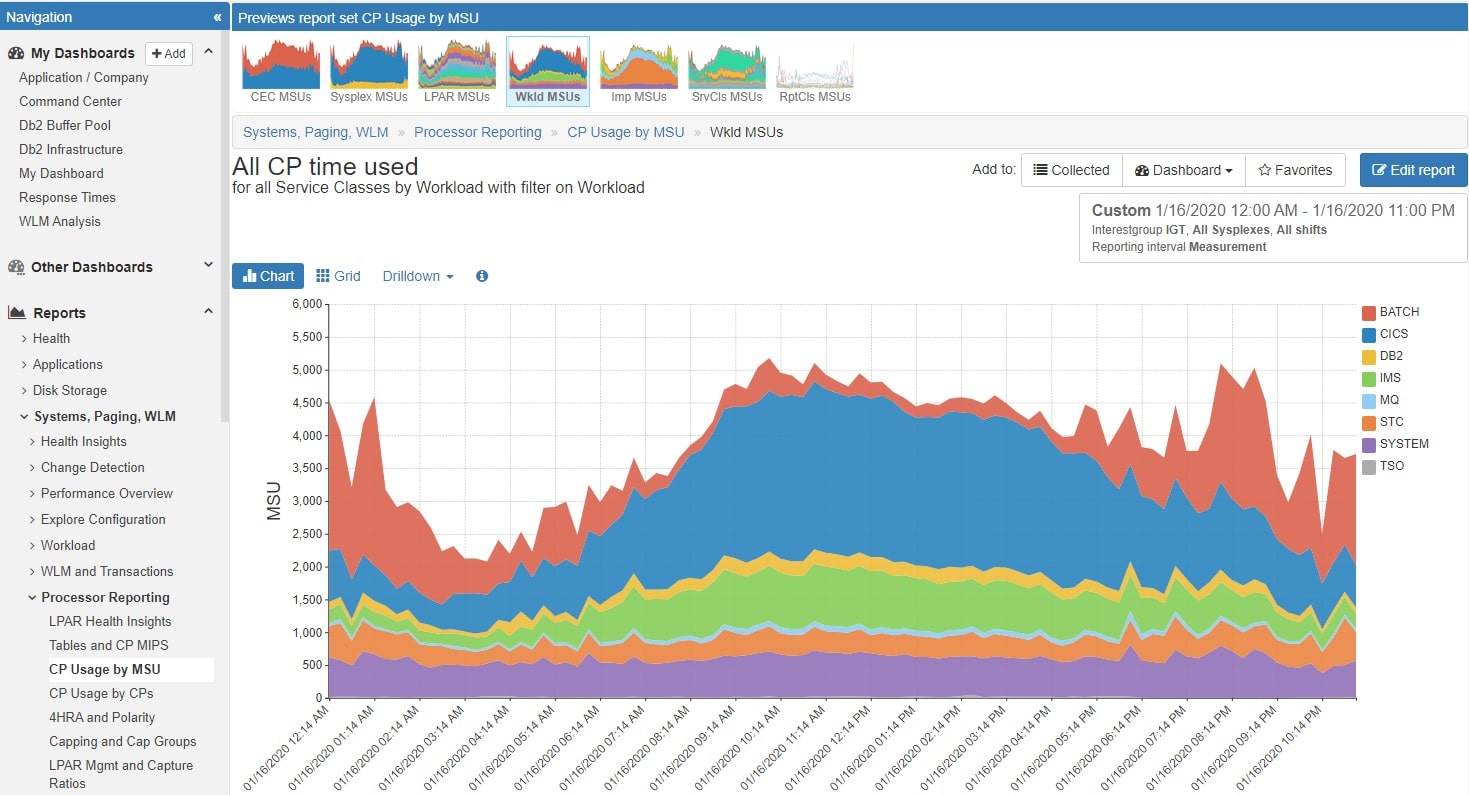
IntelliMagic Vision for z/OS is a standalone monitoring system for IBM z Series mainframes. This tool gathers statistics on each component of the mainframe and shows them in time series graphs and tables in the monitoring dashboard. It can monitor multiple mainframes simultaneously, showing a consolidated view of performance with drill-down details for each computer.
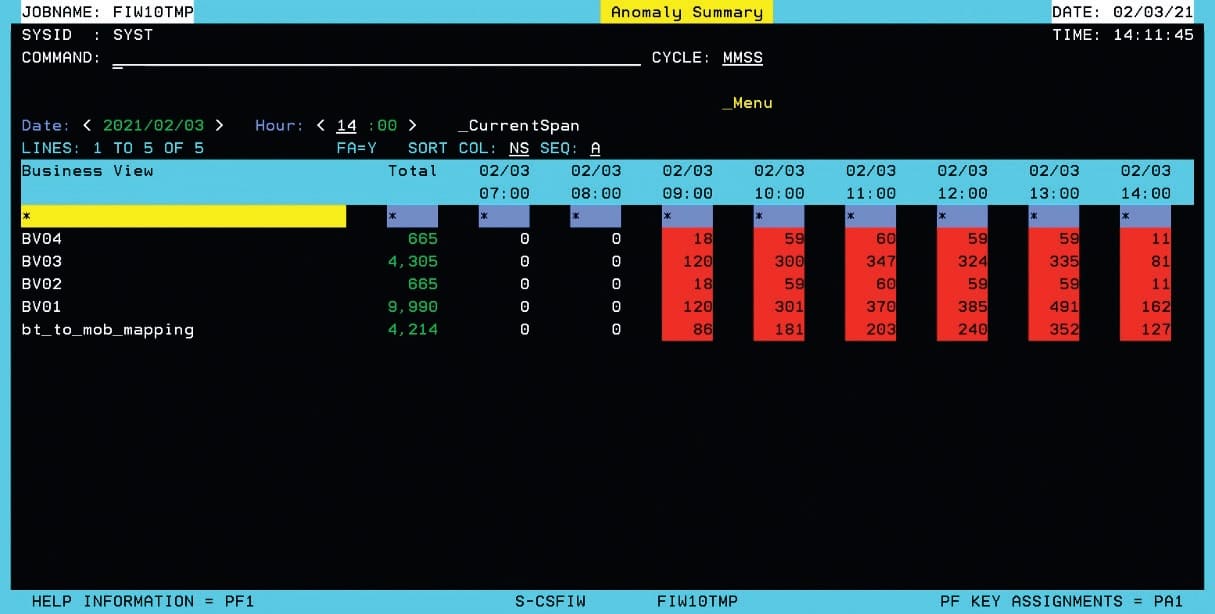
The IntelliMagic service has a console that is fronted by a summary screen. This shows a table of event statistics. This is called the Change Detection view and it scores activity on the mainframe in the context of its performance over the previous 30 days. This measurement identifies sudden increases or unusual decreases in throughput.
The console is Web-based, which means that it can present data in a more attractive format than would be possible through the operating system. Screens show live graphs and color-coded charts depicting activities such as CPU usage, which can be divided per major source of activity.
The metrics collected by the monitor can be called up in a range of formats and over a given period for on-demand analysis. The tool uses AI processes to automatically draw attention to conditions that should be of concern.
Who is it recommended for?
This is a good option for businesses that have system monitoring services in place and don’t want to change their entire toolset in order to get a system that includes mainframe monitoring. However, with this solution, your mainframe performance metrics will always be separate from the rest of your monitoring system.
Pros:
- Deployment options
- AI-based data highlighting
- Identifies application and source location of traffic
Cons:
- Can’t monitor other systems outside the mainframe
The IntelliMagic Vision for z/OS system is offered as a SaaS platform. However, it can be delivered as a software package for installation on a z series mainframe on request. You can access a trial account to assess the IntelliMagic system.
5. BMC Automated Mainframe Intelligence (AMI)
BMC Automated Mainframe Intelligence (AMI) is a suite of tools for monitoring mainframes – specifically IBM z series computers running z/OS and z/OS Unix. The modules available in this package include:
- BMC AMI Ops Monitor for z/OS
- BMC AMI Ops Monitor for CMF
- BMC AMI Ops SYSPROG Services
- BMC AMI Ops Monitor for Unix System Services
- BMC AMI Storage
- BMC AMI Ops for Networks
These monitoring modules provide performance tracing for the mainframe’s physical resources, the operating system, system services, and the software running on the computer. You also get monitors for network operations and storage services.
Key Features:
- A suite of specialist monitoring tools
- Resource shortage predictions
- Alerts for problems
Why do we recommend it?
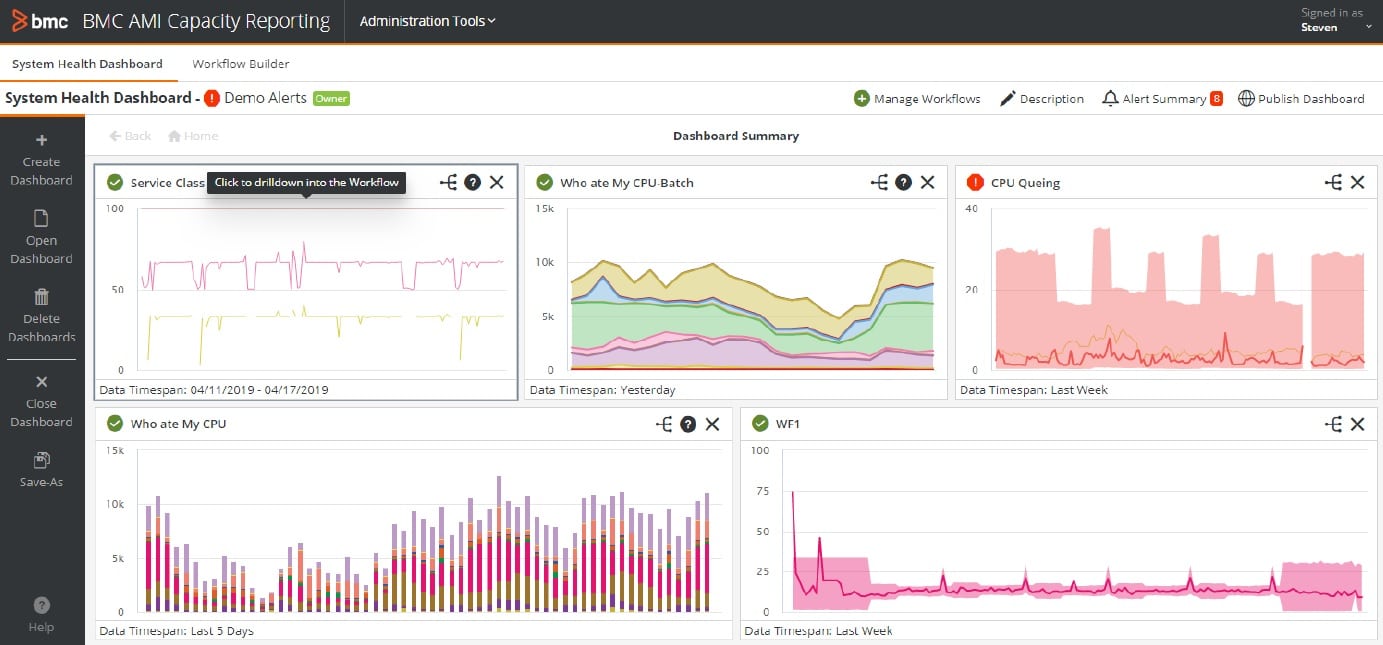
BMC Automated Mainframe Intelligence (AMI) specializes in monitoring IBM mainframes that run the z/OS or Unix operating systems. The service is available in four modules under the banner of AMI Ops Monitoring and you should look for BMC AMI Ops Monitoring for z/OS to monitor your z Series mainframe. The tool provides live monitoring and root cause analysis.
The monitoring system can predict when running software and services are heading towards the exhaustion of mainframe resources or issues such as locking that can slow down or hang processes.
When an evolving problem is noticed, the BMC system shows that issue in color-coded (red) messages in the dashboard and raises an alert. Coordinating the output of all of the AMI modules allows rapid root cause analysis to identify which resource shortage lies behind the performance issue.
Who is it recommended for?
The BMC tool is suitable for use by any business that runs one or more IBM z Series mainframes. The IPBM system isn’t encountered in small businesses, so the presence of a mainframe is an indicator of the business size that this tool is aimed at.
Pros:
- Great graphics for metrics indicators
- Can download and install software and operating system updates
- Offers problem resolution tools
Cons:
- Can’t monitor other devices across the network
- No free trial
The BMC AMI suite is presented as a SaaS platform and its console is Web-based, which offers better graphics than onboard, command-line monitoring utilities.
6. Rocket TMON for z/OS
Rocket TMON for z/OS is part of the TMON ONE package that includes system management utilities. The system installs directly on your IBM z series mainframe. The tool can be networked and it is possible to set up an extract to feed into other data analysis tools.
Key Features:
- Performance anomaly detection
- Capacity planning
- Data extracts
Why do we recommend it?
Rocket TMON for z/OS is one of a series of TMON tools for exploring IBM z Series mainframes. The other tools in the package focus on specific components of the mainframe, such as TCP/IP, MQ, and Db2. The component monitors roll up their reporting into the overview of the z/OS monitor.
Although this monitor runs onboard each mainframe, a Cross-System Coupling Facility (XCF) allows data from multiple mainframes to be viewed simultaneously on one device. The display for the tool is not so great because it relies on building graphics from the operating system. Although this view provides immediate live data, it is better to use the Export and Data Extraction utilities to get a better environment for observing performance data at leisure.
Extracts can be run recursively to allow the consolidation and summarizing of performance metrics from multiple mainframes. This secondary data analysis tool is called Rocket TMON PA. It provides statistics for capacity planning.
The TMON Health Monitor is at the heart of the live performance tracking system. It aims to provide a root cause analysis trail whenever problems arise. TMON PA requires a store of extracted data to be performed and it gives a graphical user interface that is HTML-based. There is one more tool available for activity analysis, which is NaviPlex. This runs on Windows and allows data to be sorted, mined, and displayed in different formats.
Who is it recommended for?
This is a competent tool for monitoring IBM z Series mainframes. It gives you time series records or activity in each important component of the mainframe and those metrics are stored for capacity planning and root cause analysis. The package runs on your z/OS computer.
Pros:
- Three data display tools
- Live monitoring and analysis
- Merges data from multiple mainframes
Cons:
- Requires data to be moved into different devices and stored
The TMON tool runs on z/OS with the requirement to have the software installed on each monitored mainframe. You can request a demo to examine the system.
7. Z-RAYS
Z-RAYS is a SaaS platform that collects data from IBM z series mainframes and then presents performance metrics live in the monitor’s console. The tool is also useful for historical data analysis.
Key Features:
- Cloud system
- Live performance data
- Capacity alerts
Why do we recommend it?
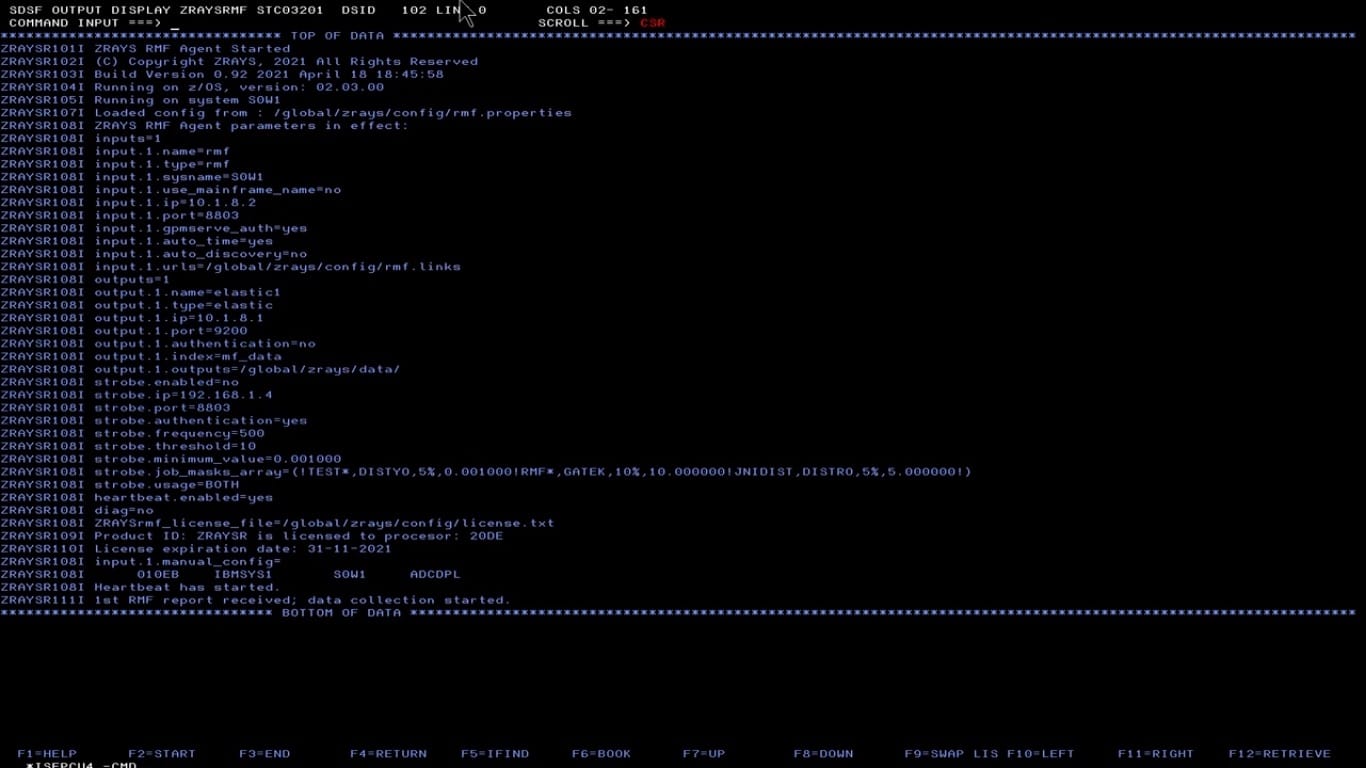
Z-RAYS provides automated monitoring because the system scans through the z/OS statistics that it gathers and will raise an alert if performance drops. This takes a lot of the monitoring tasks out of the hands of technicians and frees up human resources for other tasks.
The Z-RAYS system requires a collection agent to be installed on the mainframe. This uploads data to the Z-RAYS cloud server, where processing occurs. While packaging data for its console displays, the Z-RAYS system also examines resource utilization data and raises an alert if thresholds of comfortable performance get exceeded.
The alerting mechanism can be adjusted to use machine learning. In this mode, the monitor isn’t looking for approaching capacity limits, but unusual activity. This is a security monitoring method that identifies unusual activity.
Data can be extracted for analysis in other tools, such as Elastic Stack. Performance metrics can be filtered to present information just about specific applications, such as databases or particular software packages running on the mainframe.
Who is it recommended for?
Z-RAYS has a wide appeal for IBM mainframe monitoring because it available as a SaaS platform as well as a software package for installation on z/OS. The tool is particularly suitable for use by data centers that have many IBM z Series mainframes and it is even possible to consolidate the monitoring of multiple sites in one console.
Pros:
- Creates a centralized point for data consolidation
- Offers a range of activity views
- Extracts to third-party analysis tools
Cons:
- No free trial
As it is a SaaS system, this service is very easy to get going. The account setup process includes a guided download for the data collection agent. The screens of the Web-based console are customizable and the service can be adapted to provide security monitoring as well as performance tracking. You can assess the Z-RAYS system by requesting a demo.
Mainframe monitoring tools FAQs
What is mainframe monitoring?
Mainframes are large computers that provide services for large organizations or research institutions. They provide a great deal of processing power and so are expensive and loss of service will cost a lot of money. In order to keep those computers running efficiently and providing value for money, it is necessary to monitor their performance and that’s where mainframe monitoring tools come in.
Why do we use mainframes?
While mainframes were widely used by large organizations in the early days of business computing systems, servers are now the computer of choice for enterprises. Mainframes are still needed for organizations that need to perform a large number of calculations quickly or process unstructured data in memory.
What is mainframe management?
Mainframe management is the process of maintaining mainframe computers to keep them running efficiently. The types of tasks that this field includes are the clearing of temporary files, killing abandoned processes, updating software, managing user accounts, and monitoring physical statuses, such as temperature and security.
