
MongoDB has many uses and it is a very good system for project document management. This is a NoSQL system without schemas, so if you are used to databases that follow the relational model, you might find it difficult to fully understand the storage methods and management needs of the environment.
Your monitoring plan for MongoDB needs a structure and a schedule. You need to understand the regular maintenance tasks that are needed to keep the system optimized.
The easiest way to get a strategy for MongoDB management is to start with a competent monitoring service. A monitoring tool will help you organize your MongoDB instances and set a maintenance plan. It will help you spot resource capacity issues before they become problematic.
Here is our list of the best MongoDB tools:
- ManageEngine Applications Manager EDITOR’S CHOICE A comprehensive monitoring system for applications and servers that also includes the capabilities to monitor cloud-based resources. Offered as on-premises software for Windows Server and Linux. Download a 30-day free trial.
- Site24x7 (FREE TRIAL) An IT system monitoring service that is based in the cloud and can be expanded with a special MongoDB monitoring add-on. Start 30-day free trial.
- Datadog Infrastructure A monitoring system for services and servers that includes two specialized integrations for MongoDB. This is a cloud-based service.
- Dynatrace An advanced monitoring system that includes AI processes to improve system management automation and includes specialist processes for supervising MongoDB. This is a cloud-based service.
- SolarWinds Database Performance Monitor This system is able to monitor a long list of database models, including MongoDB. This is a SaaS package.
- Opsview An expandable system monitoring package that offers an add-on for MongoDB monitoring. This service is available in packages for Linux or as a cloud-based service.
The best MongoDB monitoring tools
A good plan, when looking for a MongoDB monitoring tool is to get a system that integrates the database monitor with other system monitors, such as server and network monitoring. There are some very interesting monitoring systems that can supervise your other database management systems and related applications as well as MongoDB.
You can read more about each of these services in the following sections.
Our methodology for selecting a MongoDB monitoring system
We reviewed the market for MongoDB tools and analyzed the options based on the following criteria:
- NoSQL activity tracking capabilities
- Storage server resource tracking
- Document access event logging
- Index efficiency assessment
- Performance analysis
- A free trial or a demo option to enable an assessment before buying
- Value for money that is provided by a MongoDB system that can also monitor other database types and has a reasonable price
Using this set of criteria, we looked for MongoDB monitoring tools that create efficiency and value for money by being useful for monitoring many different DBMSs and other applications all in the same package.
1. ManageEngine Applications Manager (FREE TRIAL)

ManageEngine Applications Manager is a very wide-ranging monitoring system that covers a long list of applications including MongoDB and other database management systems.
Key Features:
- On-premises for Windows Server and Linux
- Monitors many applications including MongoDB
- Performance alerts
Why do we recommend it?
ManageEngine Applications Manager is able to discover applications and create an applications dependency map. This extends down to server resources, so it will be able to identify resource shortages as they gather. You can monitor MongoDB and many other technologies with this package and see how they interact.
The MongoDB monitoring system in Applications Manager tracks performance statistics, resource utilization, such as CPU, memory, and network activity, and factors surrounding assert and replication. You will be notified by alerts if resources run short or if response times drop.
Thanks to the wider viewpoint of the Applications Manager, you will be able to see whether performance problems in MongoDB are the real reason for user-facing applications running badly. You will also be able to understand exactly what is the true cause of MongoDB performance issues, such as resource shortages.
Applications Manager is a software package for installation on one of your servers. It isn’t limited to monitoring its own host – it will cross the network to monitor activity on all other servers and also watch the activity on cloud resources.
Who is it recommended for?
This system is appealing to all types of businesses and there is a Free edition to attract small businesses. This is limited to monitoring five assets, so that will be too small for most companies. The base package for the paid system is priced to monitor 10 assets and it can be expanded.
Pros:
- Supports multiple database types including MongoDB
- Easy-to-use interface automatically highlights bandwidth hogs and other network traffic outliers
- Scale well, designed for large enterprise networks
- Can view traffic on a per-hop basis, allowing for granular traffic analysis
Cons:
- Designed for enterprise use, takes time to fully explore all options available
The software for Applications Manager can be installed on Windows Server and Linux. There are three editions of Applications Manager: Free, Professional, and Enterprise. The Free version is limited to five monitors. The Professional edition is for a single site and the Enterprise edition is suitable for large businesses that run multiple sites and require a large throughput of monitoring traffic. Applications Manager is available for a 30-day free trial.
2. Site24x7 (FREE TRIAL)

Site24x7 is a cloud-based monitoring service that has a lot of similarities to Datadog Infrastructure but with one important difference – this bundle includes network monitoring. Site24x7 Infrastructure doesn’t include MongoDB monitoring when you first start up your account. Instead, you pick that function from a library and activate it.
Key Features:
- Monitors application and infrastructure
- Cloud-based
- Connection monitoring
Why do we recommend it?
Site24x7 provides full-stack observability from its cloud platform. The package can monitor systems in the cloud, on-premises, or both and you only need to visit one console in order to track activity. The capabilities of this package extend to MongoDB monitoring, which is an integration that needs to be activated.
The MongoDB monitoring capabilities will give live reports on available connections and current connections that tell you how much space capacity you have on your MongoDB instance. If those two numbers get close together, users are going to get blocked and the application that wants access to the database hangs, so you want to deal with that issue quickly. Fortunately, Site24x7 lets you know when this situation is building. So, you can go off and work on other tasks, knowing that you will be called into the system monitor when you are needed.
That is just one example of how Site24x7 Infrastructure can save you time and improve your efficiency without risking the failure of your applications that need access to your MongoDB instances. Other MongoDB factors that are monitored by Site24x7 Infrastructure are total open cursors and heap usage, which give you indicators of capacity that enable you to see where inefficiencies and potential blocks in service might arise.
Who is it recommended for?
Site24x7 provides plans that include all of the modules on its SaaS platform – you can’t just subscribe to one tool, such as the MongoDB monitor. The plans are sized and priced to be accessible for small businesses and larger companies can add on extra capacity for a fee.
Pros:
- Provides additional insights via a custom MongoDB monitor
- Uses real-time data to discover devices and build charts, network maps, and inventory reports
- Is one of the most user-friendly network monitoring tools available
- User monitoring can help bridge the gap between technical issues, user behavior, and business metrics
- Supports a freeware version for testing
Cons:
- Is a very detailed platform that will require time to fully learn all of its features and options
The Site24x7 Infrastructure service is a subscription package. You buy an allowance for certain types of monitors. The add-on for MongoDB is free. However, you only get one free add-on per server and you get the allowance to monitor ten servers with the standard subscription. The tariff includes a rate to increase the block of allowances included in the pack. You can try Site24x7 Infrastructure on a 30-day free trial.
3. Datadog Infrastructure
Datadog Infrastructure is a cloud-based monitoring service that covers all of the services that support front-end software. This package chains back through the resources of the servers that support applications but stops short of monitoring network devices or traffic behavior.
Key Features:
- Cloud-based
- MongoDB and MongoDB Atlas integrations
- Offers aggregated monitoring for multiple instances
- Also monitors other applications
Why do we recommend it?
The Datadog SaaS platform is very similar to Site24x7 but Datadog charges for each of its modules individually. Datadog Infrastructure is the core module of the platform and it includes a library of integrations that expand the capabilities of the monitoring service. There is a MongoDB integration available and this will add on probes and new screens to track activity within your MongoDB databases.
Databases are among the services that Datadog Infrastructure monitors. Like many system monitors, Datadog uses a system of “integrations”, which are add-on services and there are two integrations to provide MongoDB monitoring capabilities.
The system of integrations is a good idea because it means that you only get the screens you know you are going to use – the system isn’t full of pages and pages of menu items to monitor technology that you don’t have. The integrations are free, so there is no downside to this service.
The two integrations are for MongoDB instances and for MongoDB Atlas. If you use both systems, the data from each of these integrations rolls up into a system overview page along with other databases, so you don’t need to worry about your monitoring system being segmented with no possibility of aggregating performance statistics.
The service will also monitor other types of databases within the same console. It also examines server performance related to those MongoDB instances, so if there is a problem with your databases, the Datadog monitor will be able to point out whether those issues are easily caused by server resource shortages.
Datadog Infrastructure is one of several monitoring tools available from Datadog. You can subscribe to a number of systems and use them in conjunction – network and application monitoring are two other modules that you might consider.
Who is it recommended for?
Datadog is a little more expensive and the separate charge for each module means that you can assemble your own full-stack monitoring service or just choose to use the platform for one function. The package will appeal to mid-sized and large organizations.
Pros:
- Easy to use customizable dashboards and reporting for MongoDB
- Cloud-based SaaS product allows monitoring with no server deployments or onboarding costs
- Supports auto-discovery that keeps up with expanding MongoDB environments automatically
- Allows businesses to scale their monitoring efforts reliably through flexible pricing options
Cons:
- Would like to see a longer trial period for testing
The Infrastructure service is available in three editions: Free, Pro, and Enterprise. The Free service is limited to monitoring five hosts. The Pro version contains everything that you need to support MongoDB databases. AI-based services, such as application dependency mapping and performance baselining based on machine learning are reserved for the Enterprise plan. You can get a 14-day free trial of either paid plan.
4. Dynatrace

Dynatrace offers MongoDB monitoring as part of its IT system monitoring service. This monitoring tool is based in the cloud and it has a range of capabilities that extend to most IT resources.
Key Features:
- Application dependency mapping
- Predictive performance alerts
- Automated root cause analysis
Why do we recommend it?
Dynatrace is a complicated cloud package that includes AI processes in its monitoring capabilities. This feature is used both to discover services and to forecast potential system problems due to resource shortages. You can get MongoDB monitoring in its Full Stack Monitoring plan. This creates a map of all of the service interdependencies in your system.
The MongoDB monitoring features in Dynatrace first find your database instances. This detection process is continuous, so if you set up another instance, it automatically gets enrolled in the monitoring program.
The monitor identifies all of the applications that access each MongoDB instance and then portrays access live in the dashboard. Those figures are shown as an aggregated overview and then can be examined per application. While collecting data to show on the screen, Dynatrace also stores those metrics so that they can be used for historical analysis.
The recognition of applications that access your databases gets added to an application dependency map. Dynatrace builds up this map, like a Web crawler. It tracks the interactions between applications and notes them. It also records all interactions between the MongoDB instances and the server resources that support them.
The application dependency map is good preparation for when problems arise. Performance issues usually become apparent first in user-facing software. However, those packages are rarely the true cause of problems. Instead, interface issues arise from resource shortages somewhere in the back-end processes that feed into those visible systems. The application dependency map means that Dynatrace is ready to track back to the root causes of the problem.
While setting up its groundwork on dependencies, the Dynatrace monitor deploys machine learning techniques to work out what can be deemed acceptable performance for each application. Those assessment levels adjust autonomously over time. Basically, the system is
Who is it recommended for?
The Dynatrace Full Stack Monitoring plan provides a lot of system monitoring automation. For example, it will discover all of your infrastructure, services, and applications and then monitor all of them so that each component is examined in relation to the systems that it serves and the resources that it uses.
Pros:
- Uses AI and machine learning to monitor MongoDB performance
- Highly visual and customizable dashboards, excellent for enterprise NOCs
- Operates in the cloud, allowing it to be platform-independent
- Can monitor application uptime as well as the supporting infrastructure and user experience
Cons:
- Designed specifically for large networks – not the best fit for smaller environments
Dynatrace is a subscription service and it is packaged in a number of plans. To get MongoDB monitoring, you need to opt for the Full-stack Monitoring edition. This gives you a range of monitoring services, not just supervision for MongoDB databases. It will also help you monitor the performance of other applications and underlying services. This is what gets you that map of interlinked systems that support user-facing software. Dynatrace is available for a 15-day free trial.
5. SolarWinds Database Performance Monitor

The SolarWinds Database Performance Monitor is part of a cloud-based system. It is able to examine MongoDB instances whether you have them running on your own servers or if they are hosted on a cloud platform.
Key Features:
- Monitors multiple Redis instances simultaneously
- Integration for MongoDB
- Activity tracking
- Performance alerts
- Capacity analysis
Why do we recommend it?
SolarWinds Database Performance Monitor implements monitoring for a range of DBMSs, not just MongoDB. So, with this tool, you can monitor many different types of databases all across your enterprise simultaneously. You get live monitoring and also troubleshooting tools. The system supports analysis to tune queries and optimize database structures.
The database monitor is extensible. Buyers can choose from a list of extra services that add on functions to the base module. These are called “integrations” and there is one for MongoDB. The system of integrations is a great idea because it means that the monitor is not full of screens for database management systems that the user doesn’t have. It also means that you can tailor the system to cover every type of database that you employ.
This monitoring tool is a great system to create a management strategy for MongoDB instances. When you first start up the service, it searches out all of your MongoDB instances and documents them. The monitor has a formula of best practices for MongoDB management built into it. The system checks each instance against that template and identifies settings that need to be changed in order to optimize performance.
The Best Practices system in this monitoring tool goes further than just checking each instance of MongoDB, it also examines the operating system and the replication settings for the database and other environmental and strategic factors. Once the databases have been primed, the system produces recommendations for key metrics to monitor and what performance ranges each should stay within.
As the monitor performs its ongoing supervision of your MongoDB instances, it keeps an eye on settings and user accounts to keep the database in peak performance and also to enforce security measures. This level of activity tracking and environment control is essential if you need to comply with data security standards.
The MongoDB monitoring service covers live performance statistics and also includes analysis functions that work on stored historical metrics. The live performance display screens show time-series graphs. Live monitoring includes operating system resources as they support the database. Analysis services also examine the demand that each action in the database creates. The monitor can show the top resource users, such as which queries use the most CPU.
The performance analyzer lets you see what a typical process should be, for example, the average time a query takes to complete. This service will then display which processes deviate from this standard so you can work out where queries need to be rewritten.
Who is it recommended for?
The ability to centralize the monitoring of all databases is a big productivity advantage and large companies with a diverse and essential complement of databases will get the most out of this package. The SolarWinds system is a SaaS package and it can monitor databases on other cloud platforms or on your servers.
Pros:
- Offers simple MongoDB monitoring through an easy install
- Designed with large and enterprise networks in mind
- Supports auto-discovery that builds network topology maps and inventory lists in real-time based on devices that enter the network
Cons:
- Would like to see a longer trial period
All of the database analysis tools that the Database Performance Monitor provides for MongoDB are also available for other database management systems. The monitor can supervise and improve databases from Microsoft Azure SQL, MySQL, PostgreSQL, Redis, and Amazon Aurora. SolarWinds DPM is available on a 14-day free trial.
6. Opsview
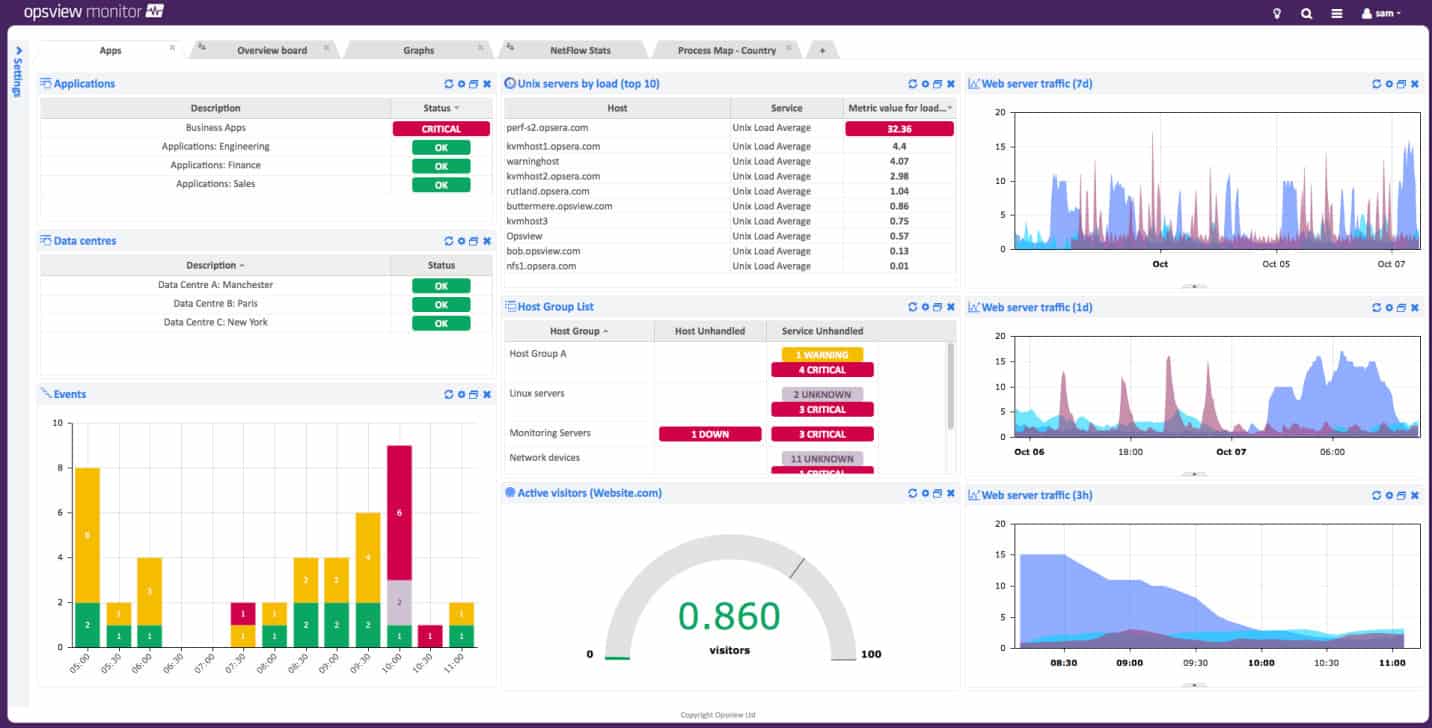
Opsview is a system monitoring tool that operates an extensible base model, similar to some of the other tools on this list. The MongoDB monitoring capabilities of Opsview are accessed through one of these plug-ins. These system add-ons for Opsview are called “opspacks”.
Key Features:
- Opspack add-on form MongoDB
- Transaction monitoring
- Resource tracking
Why do we recommend it?
Opsview is a strong competitor to Dynatrace. This monitoring system implements automated system discovery and mapping. It then provides simultaneous monitoring of all activities on all resources. This package is a little stronger at hardware monitoring, such as network device status checks. However, it provides the same level of monitoring automation as Dynatrace.
The MongoDB opspack is easy to install and set up. The number of different factors of MongoDB that can be tracked with Opsview is very impressive. It offers a total of 29 different attributes that you can follow about your MongoDB system.
The system monitors for MongoDB fall into the categories of transactional monitoring, database attributes, and resource demands. These provide viewpoints of everything that goes to the database, happens in the database, and goes on beneath the database.
Opsview isn’t limited to monitoring MongoDB. It can track the performance of a long list of applications, thanks to its library of opspacks. Whatever applications you are running, Opsview will search through your system, identifying them all. This means that the system sets itself up automatically. While starting its live reporting, the system also compiles an application dependency map. This relationship mapping is continuous, so it takes account of any changes you make to the system.
The research that Opsview conducts is not just a great way to get the system to set itself up, it also prepares investigative paths for any performance issue that might arise. The system raises an alert if performance drops or if resources run short. As well as notifying you of a building issue, the Opsview service starts its root cause analysis. By the time you get to the dashboard, you will know exactly where the problem lies and how to head off disaster before the users notice.
Who is it recommended for?
Opsview is available in three versions, which are all high end. The SMB version is probably a little too pricey for small businesses, so it would appeal more to mid-sized businesses. Large organizations have a choice of a SaaS platform or on-premises deployment and both can be expanded by Opspacks to monitor MongoDB and other technologies.
Pros:
- Is a comprehensive platform that supports MongoDB monitoring through a plugin
- Clean easy to use interfaceGreat native reports and data visualizations
- Supports a free and paid version
Cons:
- Expandable through plugins – not the best option for companies looking for a comprehensive single tool
Opsview is available in three editions. These are SMB, Enterprise, and Opsview Cloud. SMB, for small businesses, and Enterprise, for larger organizations, and on-premises packages for installation on Linux servers. Opsview Cloud is a hosted SaaS system. All versions have the same functions and all will take the MongoDB opspack. Ask for a demo of the cloud service.
MongoDB Monitoring FAQs
Is there a GUI for MongoDB?
The creators of MongoDB also supply a GUI front end for quickie accessing a MongoDB database. This is called Compass.
Is MongoDB affected by log4j?
Apache Log4j was discovered to have a security vulnerability. The Log4j system is a Java library and there are no Java components in either the MongoDB system or its interface, Compass. MongoDB isn’t vulnerable to a log4j attack.
