
The Python programming language is very flexible. The system can be used in conjunction with other programming languages and its libraries of useful functions make it quick to implement. However, those libraries and the object-oriented nature of Python can make its code execution hard to track.
There are two types of businesses that need to be able to monitor Python performance – those that develop software and those that use them. Clearly, those groups encompass just about every business in the developed world.
Here is our list of the best Python monitoring tools:
- ManageEngine Applications Manager EDITOR’S CHOICE This package provides monitoring for servers and applications with distributed tracing and code profiling for Web applications, including those written in Python. Available for Windows Server, Linux, AWS, and Azure. Start a 30-day free trial.
- Site24x7 APM (FREE TRIAL) A cloud-based monitoring service that offers network server, and application monitoring and has Python code monitoring capabilities. Start a 30-day free trial.
- Datadog APM An application performance monitor that offers code analysis and distributed tracing, identifying resource usage by applications as it switches between languages and executes APIs including code written in Python. This is a cloud-based service.
- Dynatrace An AI-driven system monitor that includes code tracking and execution tracing. The capabilities of this cloud-based system include Python monitoring.
- AppDynamics This cloud-based monitor searches through a system for all applications and maps their activities. This function extends to the distributed processes of APIs written in Python.
- SolarWinds AppOptics This cloud-based application performance monitor can track the execution of code anywhere and that includes application programs written in Python.
Python monitoring tools for software users
Python-based monitoring tools play a key role in overseeing SaaS applications and APIs by tracking performance, usage patterns, and error rates. For APIs, these tools typically measure metrics such as request latency, throughput, uptime, and error rates (for example, HTTP 5xx responses). They often simulate API calls, validate responses, and measure performance using libraries such as Requests and AsyncIO to ensure services remain responsive under varying loads.
For SaaS platforms, monitoring focuses on service availability, integration performance, and feature usage. Common metrics include connection reliability, authentication success rates, and data synchronization. Python scripts may query health endpoints, interact with SDKs, and analyze returned data to detect anomalies and ensure services are functioning as expected.
Monitoring SaaS packages and APIs is essential for maintaining consistent performance and a reliable user experience. These services are often central to modern software ecosystems, enabling communication between systems and supporting business-critical functionality. Any disruption—such as downtime, latency, or errors—can have a direct impact on operations and end users.
In addition to data collection, Python monitoring solutions provide alerting and reporting capabilities. By leveraging logs, metrics, and distributed tracing, they can trigger notifications when thresholds are exceeded and give teams the visibility needed to respond proactively and maintain service reliability.
Python monitoring tools for software developers
Python monitoring tools operate by tracking a range of key metrics within an application to provide visibility into performance and stability. Execution time is a core metric, helping developers identify slow-running functions or inefficient processes so they can optimize critical code paths. Memory usage is also closely monitored, as poor memory management can lead to performance issues or crashes. By analyzing memory consumption patterns, these tools help pinpoint leaks and unnecessary overhead.
They also track error rates and exceptions, generating real-time alerts when issues occur. This is particularly valuable in distributed systems, where failures can propagate across multiple services. Built-in tools such as Python’s logging module, along with third-party libraries, capture stack traces and error messages to support faster debugging and resolution.
Monitoring dependencies is another important capability. Python applications often rely on external libraries and APIs, and monitoring tools can identify which of these components are causing bottlenecks or failures. This helps ensure that all parts of the application function reliably and securely.
For software developers, monitoring is essential to maintaining efficient and reliable Python applications. By tracking performance, resource usage, system health, and errors, these tools make it easier to identify issues quickly and improve code quality. Overall, they provide the insights needed to maintain application health, resolve bugs efficiently, and optimize performance over time.
Python implementations
As a high-level, object-oriented language, Python is particularly suited to producing user interfaces. Libraries of functions take care of the lower-level tasks involved in delivering an effect, such as drag-and-drop functionality, or a long list of visual effects.
As a result of its suitability for use in creating interfaces, Python can be found in many, many different implementations. It is used in on-premises software packages, it contributes to the creation of websites, it is often part of many mobile apps, thanks to the Kivy framework, and it even builds environments for cloud services. It is everywhere.
Python monitoring issues
With any programming language, a key issue is how that system manages resource access. In object-oriented systems, such as Python, resource management is an even bigger issue. Object-oriented modules can be called many times over during the execution of a running program. Not only that, but the same code can be running many times over simultaneously.
When the same process is run in parallel, the issue of resource locks has to be dealt with. It could be that several different applications that are live on the same system were produced by different developers but use the same functions from a widely-used, publicly available, third-party library or API. So, these modules will be rapidly trying to acquire the same resources simultaneously and end up locking each other out.
Another major issue with object-oriented languages that are hidden behind APIs is that the developers that integrate them into new programs don’t know whether those functions are any good at cleaning up, terminating processes gracefully, tracking the half-life of spawned process, and releasing memory.
As a user of software and services, you have no hope of creating a meaningful strategy for managing all of these issues without an automated application monitoring tool. Even as a developer, you will spend a lot of time trying to work out operating system interactions manually. Anyway, the whole point of using functions written by other people is to save time, so you don’t want to get bogged down trying to trace the activities of those functions. It is better to get a monitoring tool to do that for you.
The best Python monitoring tools
Whether you work in development, run IT operations, or operate a DevOps environment, you need to track the performance of Python code and you need to get an automated tool to do that monitoring work for you.
There are many monitoring systems that cater to developers and users and some that work well for both communities. However, it can take a long time to identify the best tools and then narrow down the list to a few candidates that are worth trialing. This guide identifies the best options available so you can cut straight to the trial phase.
Our methodology for selecting Python monitoring tools
We reviewed the market for Python monitoring solutions and analyzed tools based on the following criteria:
- Code profiling
- Application dependency mapping
- Distributed tracing
- Log creation
- System resource usage correlation
- A free trial or a demo package for a cost-free assessment opportunity
- Value for money from an API with a code profiler that is offered at a reasonable price
With these selection criteria in mind, we picked APM systems that can cover a range of Web programming languages because a monitoring system that covers a range of services is more cost-effective than a monitor that just covers Python.
1. ManageEngine Applications Manager (FREE TRIAL)
ManageEngine Applications Manager is a large package of monitoring systems for applications. That includes both traditional hosted applications and microservices that run on serverless platforms. Web applications are frequently written in Python and in the case of such plain text scripts, the Applications Manager provides code profiling. This function is provided by a unit called APM Insights and it adds to an extensive battery of monitoring services for Python applications.
Key Features:
- Server and Cloud Monitoring: Tracks server resources and cloud platform performance, ensuring system health.
- Tracing Technology: Utilizes distributed tracing to follow application transactions across platforms.
- Code Examination: Offers code profiling to identify inefficiencies and potential bugs in application code.
Why do we recommend it?
ManageEngine Applications Manager provides extensive monitoring services for tracking Python performance. First, the package tracks down all applications and identifies the links between them. This creates an application dependency map. With this, you get instant root cause analysis. The system raises an alert if a program stalls or slows, drawing technicians to the console to get the system running again.
All of the different performance tracking monitors contribute to a single view of the entire enterprise’s application map. You can watch a Python program as it runs, seeing each line of code as it executes, simultaneously looking at server resource activity and the performance of related services or software.
With the overall system health checks, the identification of which unit is in trouble, and code profiling, you can narrow down your problem to a specific line of code. This will tell you which resources are in shortage so you can free up space and get the system turning over. Once the panic is over, you can examine whether the problem was caused by a coding error and send the function for a rewrite.
Who is it recommended for?
Companies that use Web applications written in Python will need this tool. Businesses that write and support Web applications will need it even more. The tool is able to identify exactly which program is causing trouble so it can be fixed quickly to end system problems. You might deduce that the problem actually lies with a related module and the Python program has no problems.
Pros:
- Extensive Framework Support: Integrates with major frameworks such as Tornado, Django, Flask, and Pyramid for comprehensive transaction recording.
- Customizable Alerts: Provides flexible tracking features to suit various monitoring needs.
- Wide Language Coverage: Monitors applications written in a range of languages, including PHP, Node.js, Go, .NET, Java, and Scala.
- In-Depth Analysis: Facilitates detailed root cause analysis, pinpointing exact lines of code responsible for issues.
- Correlates Usage: Maps resource usage directly to application performance, aiding in efficient resource management.
Cons:
- Subscription Required: Access to Python monitoring features necessitates the higher-tier subscription plan.
ManageEngine Applications Manager has a Free edition that will monitor five assets. The paid plans are the Professional edition for a single network and the Enterprise edition to monitor multiple sites. The software for Applications Manager runs on Windows Server or Linux or you can get it on AWS Marketplace or Azure Marketplace. You can assess Applications Manager with a 30-day free trial.
EDITOR'S CHOICE
ManageEngine Applications Manager is our top pick for Python monitoring because it combines a user-friendly interface with advanced, customizable monitoring for both applications and underlying infrastructure. The platform gives teams detailed insight into Python application performance, database health, and server metrics, helping prevent disruptions and maintain smooth operations. Built-in support for frameworks like Django and Flask simplifies monitoring, enabling developers and IT teams to quickly spot and resolve performance issues. By monitoring both the application and infrastructure layers, it provides a holistic view that highlights problems caused by code inefficiencies, database queries, or resource constraints. Applications Manager’s discovery process maps dependencies across software, services, and servers, calculates resource needs, and provides early alerts before issues impact users. Real-time notifications and detailed analytics support proactive troubleshooting, while its scalability makes it suitable for organizations ranging from small startups to large enterprises.
Download: Get a 30-day FREE Trial
Official Site: https://www.manageengine.com/products/applications_manager/download.html
OS: Windows Server, Linux, AWS, and Azure
2. Site24x7 APM (FREE TRIAL)

Site24x7 has a module called APM Insight. This is able to identify all the applications running on a system and identify the interactions between them. The cloud service builds up a live map of interactions between those applications. It then dives into each application and identifies each operating module.
Key Features:
- Cloud-Based Solution: Delivers a comprehensive monitoring service from the cloud, covering servers, networks, and applications.
- Integrated Monitoring: Offers combined packages for a holistic approach to application and infrastructure management.
- Mapping Capabilities: Provides application dependency mapping to trace interactions and dependencies across systems.
Why do we recommend it?
Site24x7 APM is a SaaS package that includes server and network monitoring utilities in the plan. The tool can look at resources on cloud platforms as well as on-premises servers. The tracking methods of the otol include code profiling and distributed tracing, which is ideal for monitoring programs written in Python.
The component analysis of the APM is able to identify the language that the code is written in and watch its use of resources. These modules might be supporting applications running on your site, websites, or mobile apps. The programming languages that this system is able to analyze include Python. The service not only watches the code as it runs but also examines the contribution of the various Python frameworks that contribute to the management of those modules.
The Site24x7 service is also useful for development environments. It helps you validate the Python frameworks and APIs that you intend to use in the creation of your applications. You need to ensure that the components you call in to speed up your application development don’t end up dragging down the performance of your new system. The tool offers good support during the unit, integration, and Beta testing.
Who is it recommended for?
The Site24x7 APM is a complicated system that provides many different monitoring technologies. However, the plans for this platform are scaled for use by small businesses. Larger businesses are also catered for by capacity expansion supplements. So, the Site24x7 APM package is suitable for businesses of all sizes.
Pros:
- Unified Monitoring: Integrates monitoring for web, network, server, and applications into a single platform.
- Infrastructure Mapping: Links application performance to infrastructure usage for clearer insight into system dynamics.
- Development Support: Validates the performance of frameworks and APIs during the development process, ensuring efficient application builds.
Cons:
- Cost Considerations: Additional testing and monitoring requirements can increase overall expenses.
The APM Insight service is blended into the APM package, which is a platform of cloud monitoring systems. The APM not only gives you application tracking but network and server monitoring as well. These extra services allow you to monitor the full stack of systems and spot performance issues. You can get a 30-day free trial of Site24x7.
3. Datadog APM

Datadog APM has a battery of monitoring tools for tracking Python performance. This cloud platform is able to monitor code on your site and in operation on any server anywhere. This makes the tool great for DevOps environments. You can check on the code that your own team develops and also trace the actions of any APIs you integrate into your own applications. The Datadog service can track programs written in many languages, not just Python.
Key Features:
- Cloud Flexibility: Monitors code execution across any server globally, ideal for cloud and hybrid environments.
- DevOps Integration: Tailored for development and operational monitoring, supporting a wide array of programming languages.
- Comprehensive Code Tracking: Provides detailed insights into code performance and dependencies.
Why do we recommend it?
Datadog APM is a SaaS package that performs distributed tracing and code profiling. This description will remind you of the AppOptics system and the two platforms are very similar. A big difference between the two is that the infrastructure monitoring service of Datadog is a separate module that requires another subscription.
This system includes testing utilities, such as tracing and synthetic monitoring. The synthetic monitoring service is an extra module that you would need to add to your APM account. The code-level tracing facility is part of the higher of Datadog APM’s two editions. The lower edition is just called APM and that includes a system of dependency mapping. The higher plan is APM & Continuous Profiler, which gives you the code analysis function.
The code tracking service continues working once your code goes live. If you aren’t a developer of applications, the operations phase is where you begin your use of Datadog APM.
Who is it recommended for?
The market for the Datadog APM is the same as that for AppOptics. If you have many Python programs to monitor, you would benefit from using either of these packages. The Datadog platform provides many modules, which can be slotted together to create a full-stack monitoring service.
Pros:
- Extensive Dependency Mapping: Offers thorough application dependency mapping to trace interactions down to the resource level.
- Language-Agnostic Tracing: Enables distributed tracing that spans multiple programming languages for holistic monitoring.
- In-Depth Profiling: Code profiling capabilities highlight the impact of each line of code on application performance.
- Alerts and Analysis: Facilitates root cause analysis with performance alerts to pinpoint issues efficiently.
Cons:
- Plan Restrictions: Access to advanced Python monitoring features requires the premium plan subscription.
This system provides insights into the interplay between your Python system, modules programmed in other languages, and system resources. You can get a 14-day free trial of Datadog APM.
4. Dynatrace
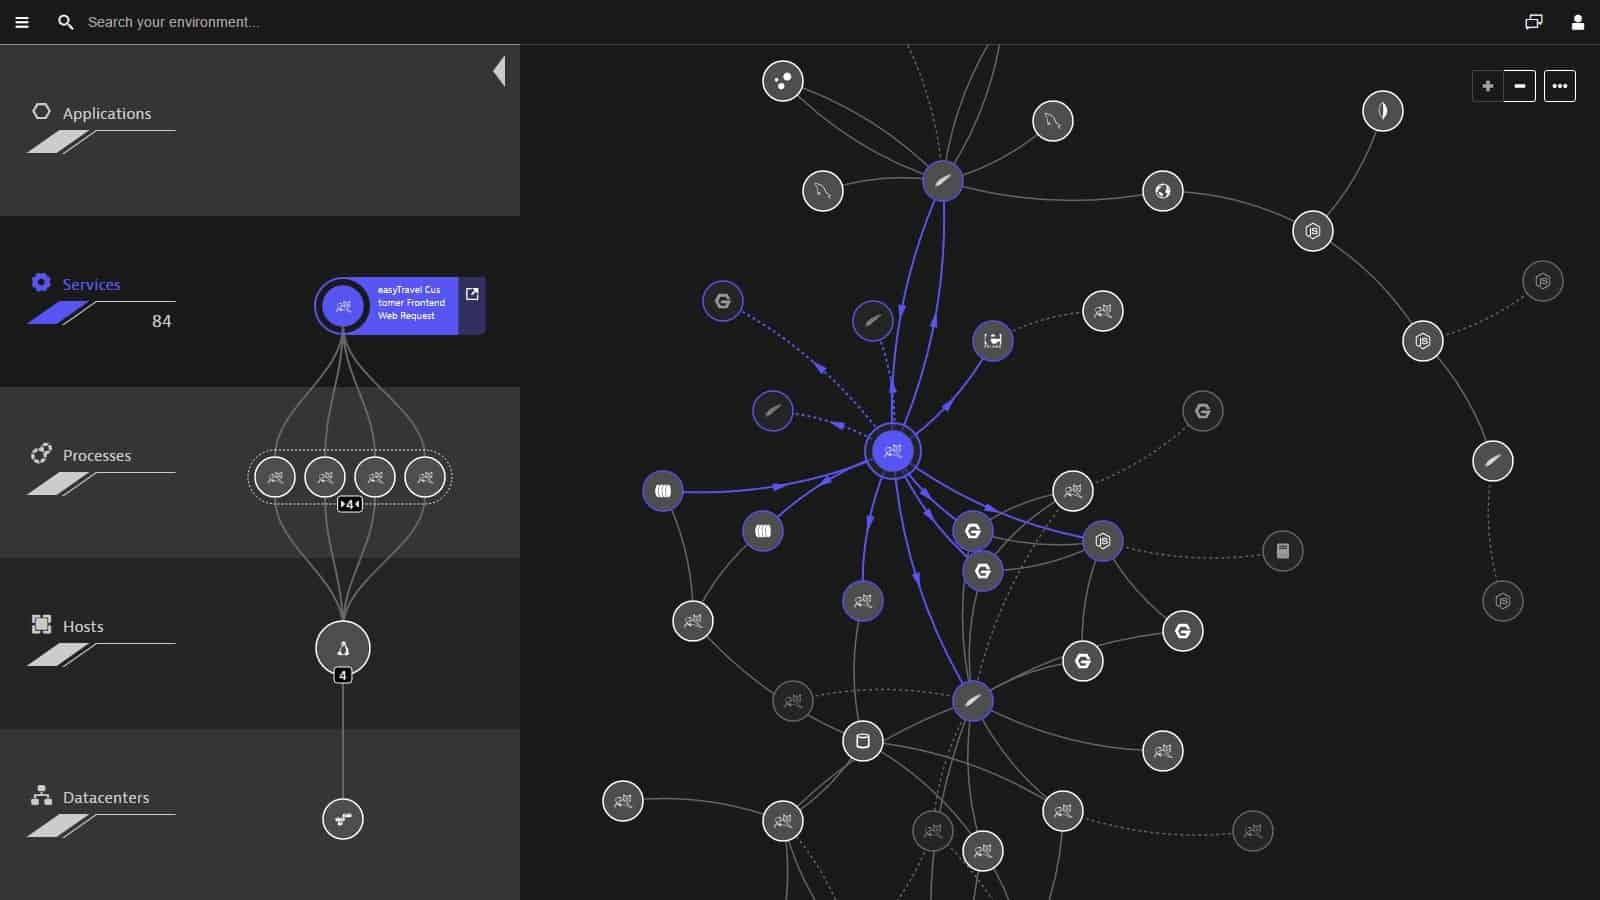
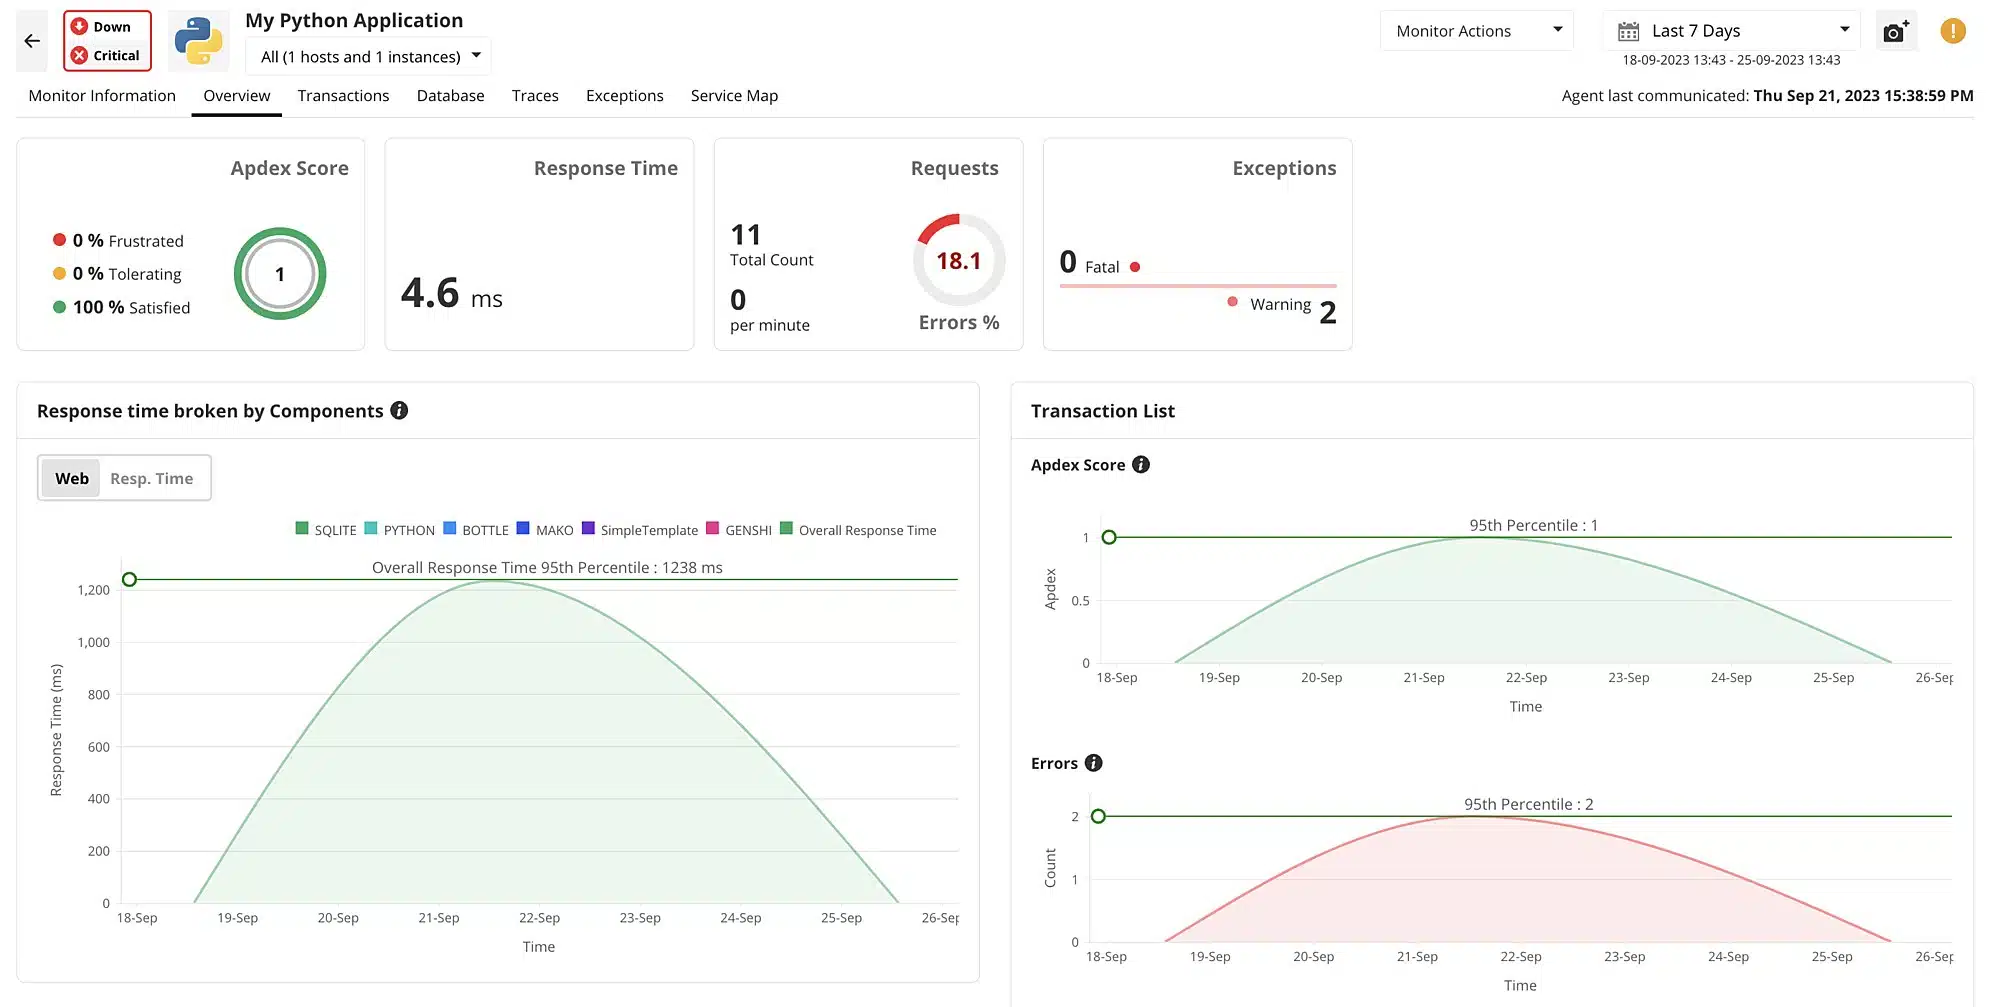
Dynatrace integrates AI detection techniques in the monitoring services that it delivers from its cloud platform. The “trace” part of the Dynatrace name is very apt because this system is able to trace all of the processes that contribute to your applications. The system performs constant sweeps, identifying applications and services and how they interact. It then drills down through each application to discover all contributing modules.
Key Features:
- AI-Driven Monitoring: Utilizes artificial intelligence to enhance detection and monitoring capabilities across cloud and on-premises environments.
- Broad Language Support: Capable of monitoring applications written in multiple languages, including Python.
- Dynamic Tracing: Offers distributed tracing and application dependency mapping for comprehensive oversight.
Why do we recommend it?
Dynatrace provides application discovery and mapping. It specializes in monitoring Web applications that are hosted in the cloud but it can also follow activities on your on-premises servers, so this is a monitoring system for hybrid environments. With its map in place, Dynatrace follows each transaction as it triggers different modules.
When the Dynatrace system examines each module, it detects which programming language it was written in. It will then watch the performance of each module and looks at how it interacts with resources. The service can even track down which server the code is run on – this is a difficult task for API-fronted modules.
Dynatrace is a great tool for development teams and is also very useful for systems administrators tasked with supporting complicated systems, such as websites. The dashboard is based in the cloud and can be accessed through any standard browser. It includes some great interactive data visualizations that map out your entire system and demonstrate the performance of each element.
Who is it recommended for?
Dynatrace is a comprehensive application monitoring tool that is able to track Python modules and Web applications written in other programming languages. So, it is particularly suited to businesses that manage a lot of Web applications. Companies that compose Web applications with the assistance of APIs, libraries, and frameworks will particularly need this system.
Pros:
- Advanced Application Scanning: Automatically identifies web applications and their programming languages for targeted monitoring.
- Hybrid Compatibility: Effectively monitors web applications in both development and operational phases, regardless of their hosting environment.
- Interactive Visualizations: Cloud-based dashboard features interactive data visualizations to map and assess system performance comprehensively.
Cons:
- Hosting Limitation: Lacks an option for on-premises hosting, which may not align with all organizational requirements.
Dynatrace offers several packages of its service and you need the Full-stack Monitoring plan in order to get Python tracing. You can get a 15-day free trial of Dynatrace.
5. AppDynamics
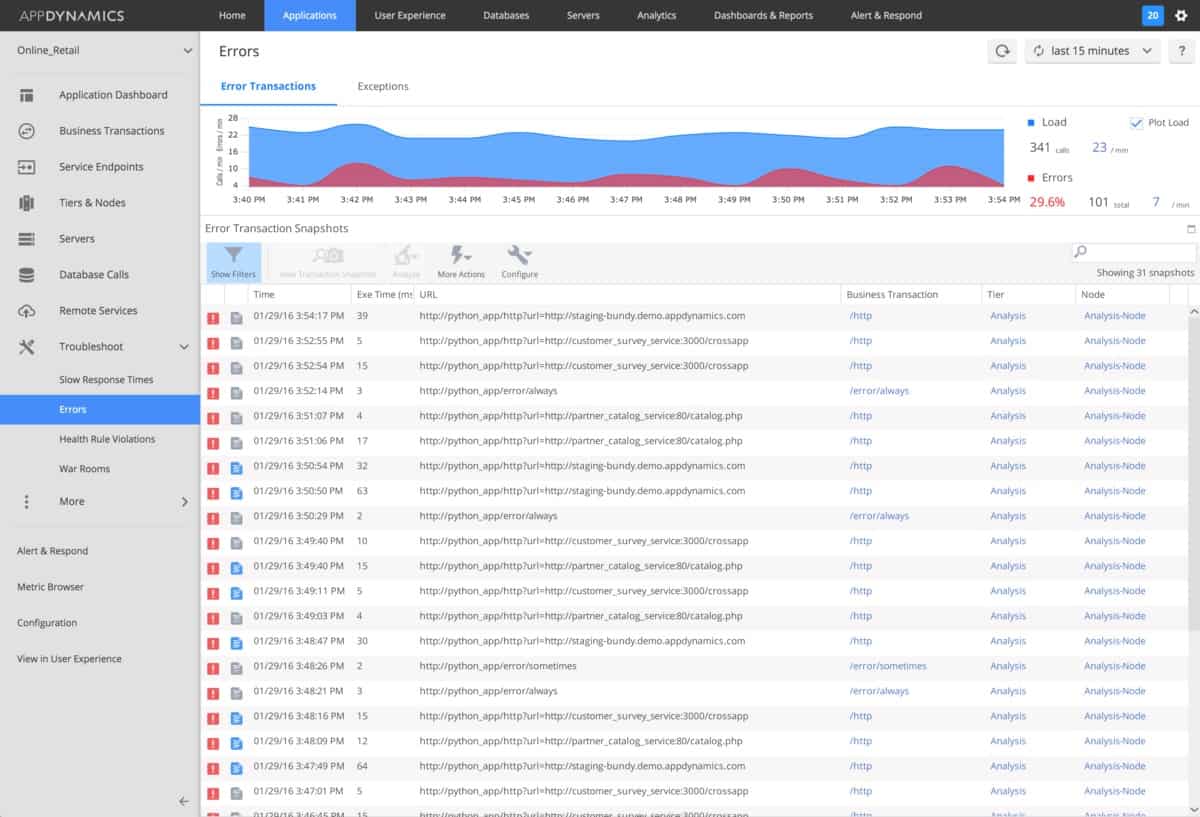
AppDynamics is a cloud platform that includes extensive AI processes and provides analysis and testing functions as well as monitoring services. The AppDynamics system is organized into services. Python monitoring and tracing are available in the Infrastructure and Application Performance Monitoring systems. You can get the Infrastructure Monitoring service by itself or opt for the Premium plan, which includes Infrastructure, Application, and Database monitoring. Or you can get the Enterprise edition, which has those three modules plus Business Performance Monitoring.
Key Features:
- AI-Enhanced Monitoring: Leverages artificial intelligence for advanced application dependency mapping and performance forecasting.
- Comprehensive Tracing: Provides extensive insights into Python and other web application languages through distributed tracing.
- Proactive Alerts: Utilizes the Cognition Engine for predicting resource needs and potential performance bottlenecks.
Why do we recommend it?
AppDynamics is a similar platform to the Dynatrace system. It is very strong at identifying the behind-the-scenes components of an application. The system uses AI both to detect connections to supporting modules and to predict performance problems. The service is able to track Python programs as well as other Web application languages.
The core of the AppDynamics system is its application dependency mapping service. This identifies all of the applications contributing to a system and examines the links between them. The service then gets into each application and identifies where its contributing modules are running. Users can select a specific node and then analyze all of its components.
The Python monitoring system within AppDynamics exposes the interactions of each Python object with other modules and also system resources. It doesn’t matter where those Python programs are running, AppDynamics will find them.
The AI service built into AppDynamics is called Cognition Engine. This assesses the performance requirements of each module and also predicts the resources that it will need in order to reach its target response time. If Cognition Engine predicts that resource availability will not be enough to support each running module, it raises an alert.
The tracing features in AppDynamics are ideal for development teams and testing engineers. The tools of this service are suitable for use from project planning to IT operations.
Who is it recommended for?
AppDynamics supports DevOps teams. The scanning routines in the monitoring package can be used to validate components and frameworks before using them to support a new application and it can also be used for testing the new Web application as well as monitoring its performance once it is live.
Pros:
- Microservice Discovery: Automatically detects and maps the interactions of microservices, enhancing visibility into complex systems.
- Resource Prediction: Identifies potential resource constraints before they impact application performance.
- Versatile Tracing: Supports both development testing and operational monitoring with its robust tracing features.
Cons:
- Development Focus: More oriented towards operational monitoring, with less emphasis on development and testing phases.
AppDynamics is a subscription service with a rate per month for each edition. The service is available for a 15-day free trial.
6. SolarWinds AppOptics
SolarWinds AppOptics is a SaaS system so you don’t have to install its software on your site or maintain its code. As a remote system, this service is not constrained by the boundaries of one single network – necessary freedom in this world of distributed processing and microservices.
Key Features:
- SaaS Model: Provides a cloud-based service for comprehensive application and infrastructure monitoring without on-site installation.
- Dependency Insight: Offers detailed application dependency mapping for enhanced visibility into system interactions.
- Trace Tracking: Implements distributed tracing to monitor transactions across services, ideal for microservices architecture.
- Performance Profiling: Includes a code profiler for in-depth analysis of application performance and resource utilization.
- Infrastructure Oversight: Monitors server resources to ensure optimal performance across your IT environment.
Why do we recommend it?
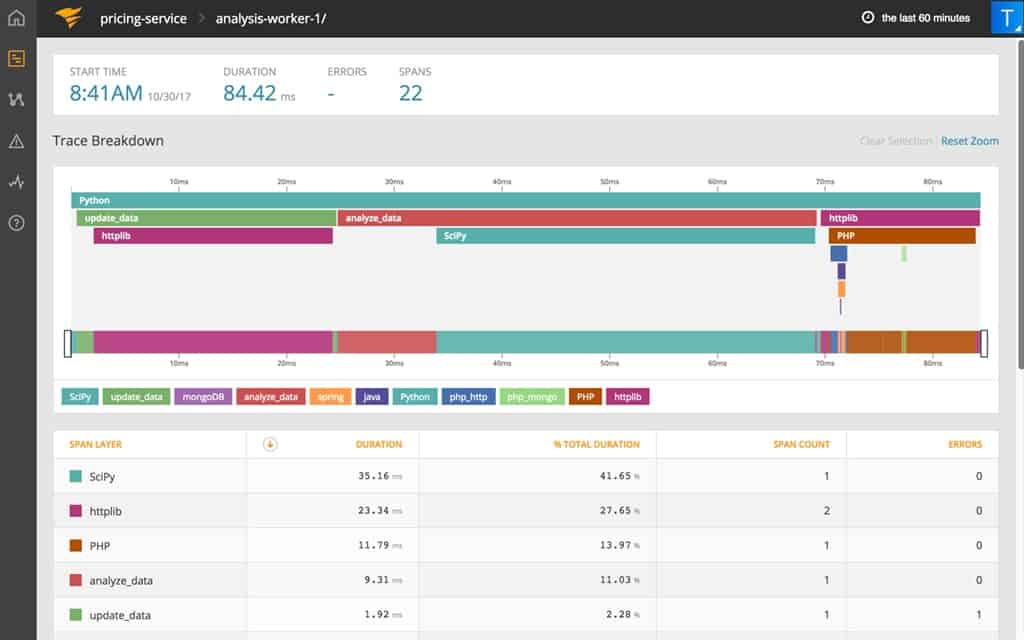
SolarWinds AppOptics provides application discovery and dependency mapping from its cloud platform. This service is able to implement distributed tracing and code profiling to step through the activities of Python programs while also watching server resource availability. The tracing travels across platforms following transactions from module to module.
Any application, particularly website pages and Web services might be calling in processes executed on remote servers without your knowledge. The tracing functions of AppOptics watch every application execute and tracks back through the calls to the original, underlying processes, identifying its programming language and exposing its code on the screen.
The dashboard code analyzer steps through executable code, detailing its resource usage and watching its access to resources. This service can spot bugs, code inefficiencies, resource locks, and orphaned processes. AppOptics is an excellent monitoring tool both for developers and IT operations support teams.
Who is it recommended for?
This service is particularly useful for watching over Web applications that are composed of many modules and functions. These contributing microservices can be hosted on many different platforms and the AppOptics system will still follow the activity until the program completes. The package also records the entire application and its interaction with other systems.
Pros:
- Framework Integration: Seamlessly integrates with frameworks like Tornado, Django, Flask, and Pyramid, capturing each transaction in detail.
- Adaptable Monitoring: Features customizable tracking options for tailored monitoring strategies.
- Broad Language Support: Monitors a variety of programming languages, including PHP, Node.js, Go, .NET, Java, and Scala.
- Precise Diagnostics: Enables root cause analysis down to the specific line of code affecting performance.
- Resource Correlation: Links application performance issues directly to underlying resource utilization for targeted troubleshooting.
Cons:
- Plan Limitations: Python monitoring capabilities require subscription to the higher-tier plan.
The AppOptics service is charged for by subscription with a rate per server and it is available in two editions. The lower of these is called Infrastructure Monitoring and it will track the supporting services of your system. To get Python monitoring, you need the higher plan, which is called Infrastructure and Applications Monitoring. You can examine the service on a 30-day free trial.
Python Monitoring FAQs
What is monitoring in Python?
Python monitoring is a form of Web application monitoring. Python modules might be mixed into a system that is composed of functions written in a range of languages. Python should be monitored in context, so connected functions and underlying resources also need to be monitored. The aim of Python monitoring is to prevent performance issues from damaging user experience.
How do I monitor an application in Python?
Python monitoring requires supporting tools. You need to locate all of the Python modules in your system along with functions written in other languages. You should then map the contact between these modules. Watch the Python module as it runs, tracking each line of code to see whether coding errors overuse resources or fail to deal with exceptions efficiently.
What is Python used for?
Python is a programming language that is used to provide functions that can be plugged into Web pages. A python module is able to provide data manipulation functions that can’t be performed in HTML. It can also be used to automate administrative tasks around a network, such as reading or moving files, or searching data.
