API monitoring is something all companies should be doing to ensure their software, and web applications are not just functioning, but functioning efficiently. We’ll break down each software’s strengths and weaknesses, as well as its price and compatibility, to ensure your choice has your needs covered.
Here is our list of the best REST API Monitoring Tools:
- Site24x7 Website Monitoring EDITOR’S CHOICE A package of services that tests website performance and monitors availability while also tracking the performance of supporting applications and frameworks plus APIs. This is a cloud-based service. Start a 30-day free trial.
- ManageEngine Applications Manager (FREE TRIAL) Fully feature application manager that is built to encompass all of your organization’s systems, cloud applications, and services under one simple no-nonsense dashboard. Start a 30-day free trial.
- ManageEngine OpManager Nexus (FREE TRIAL) Application performance monitoring platform that offers end-to-end performance tracking and code-level insights of your REST APIs. Start a 30-day free trial.
- Sauce Labs API Testing This cloud platform offers API testing that can be integrated into a development pipeline to provide continuous testing.
- Dotcom-Monitor A cloud-based testing platform for websites and web services that includes availability checks for REST and SOAP APIs.
- AlertSite API monitoring and testing tool that allows you to create tests and instant alerts by clicking on elements on your site or application.
- Postman Simple and powerful REST-based API monitor used by over 10 million developers.
- Loggly Loggly blends an excellent user interface with enterprise-level altering and proper monitoring features at a price that is tough to beat.
- AppDynamics Utilizes node-based network mapping to provide live API statuses and enterprise-level reporting.
- API Science Uses a full-featured REST API and boasts a very quick onboarding time.
- Bearer Features automatic anomaly detection, and a simple two-minute install, and is easy to use.
- Uptrends Provides over 209 monitoring locations, an internal API testing feature called Private Checkpoint, and a step editor for easy workflow visualization.
The Best REST API Monitoring Tools
Our methodology for selecting a REST API monitoring system
We reviewed the market for REST API monitoring packages and analyzed the tools based on the following criteria:
- A dashboard that interprets activity data into easy-to-understand graphs
- A system of alerts with customizable thresholds
- Behavior baselining and anomaly detection
- User accounts to allow controlled team member access
- Analysis tools
- A free trial or a demo system to enable a risk-free assessment
- Good value for money, represented by a flexible tool that is able to monitor many systems, not just REST APIs
With these selection criteria in mind, we looked for monitoring systems that are easy to install and set up and will provide thorough tracking of REST API activities.
1. Site24x7 Website Monitoring (FREE TRIAL)

Site24x7 Website Monitoring has many website testing features but it has many more functions that make it a great choice for those looking for an API monitor. The system also monitors servers and applications and it doesn’t matter where those servers are or where the applications are resident.
Key Features:
- Real-time Alerting: It keeps you informed about any issues promptly through instantaneous notifications delivered via Email, SMS, voice calls, and push messages.
- Data Collection and Validation: This feature allows you to verify the accuracy and integrity of the data by validating responses in various formats such as JSON, XML, or TXT.
- API Problem Resolution: Site24x7 enables you to monitor APIs across your entire team, from development to QA, ensuring backward compatibility and seamless integration.
- API Uptime Monitoring: you can check insights and other data into the response time of mobile and web applications that rely on your APIs.
Why do we recommend it?
Site24x7 Website Monitoring is a part of a cloud-based package of system monitoring tools. Although the Site24x7 platform provides specialized modules, such as network performance monitoring, traffic analysis, and application performance monitoring, it sells these units together in combined bundles. So, you get full stack analysis along with the synthetic monitoring tools in the Website Monitoring unit. You can also test raw APIs with the Site24x7 system with what is effectively a test container that will feed in a series of inputs that you list. This is great for development testing before an API goes live.
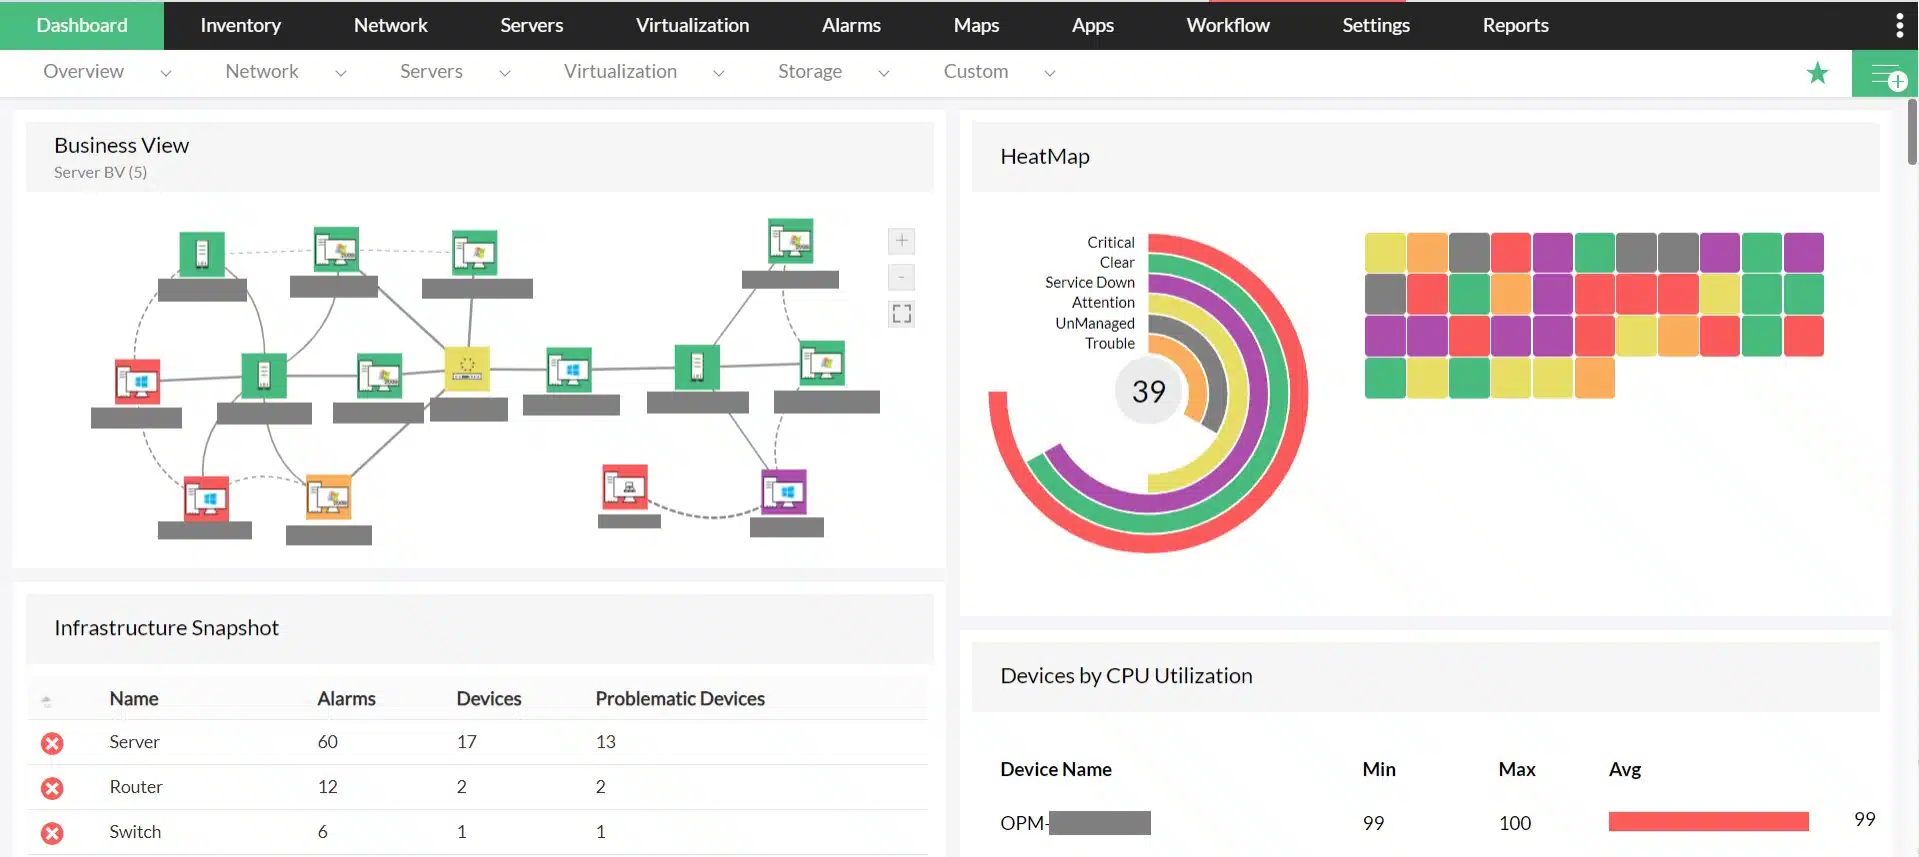
This monitoring system creates an application stack mapping that identifies the dependencies between applications and services. This stretches down to the resources of the supporting servers. The hosting servers don’t need to be in the same location in order to be included in the server monitoring functions of the Website Monitoring tool.

REST APIs often provide access points to microservices that are notoriously difficult to monitor. The Website Monitoring system is able to test the availability of those microservices. If you are tracking problems with the performance of your mobile apps or websites, the fact that a microservice has stopped working could give you the reason for that problem.
The reassurance of API performance is a great support system for DevOps teams that need to know the availability of black-box functions during bug fixing and testing. The Website Monitor is able to support the development of sites and mobile apps.
Who is it recommended for?
As with the other tools on this list, you need to be running APIs to benefit from this tool. If you produce libraries for use by others or deploy the APIs supplied by others, you need to check their availability above all else. The great thing about the Site24x7 is that it simultaneously checks on every level of the delivery stack, so you immediately know which service failed if the API monitor reports a problem. This is a subscription service with no installation fees, so it is very affordable for startups and established Web businesses alike.
Pros:
- Easy Cloud Deployment: Site24x7 Website API Monitoring simplifies monitoring for multiple sites through a single dashboard, streamlining management.
- Microservices Monitoring: It offers a unique capability to monitor microservices, facilitating quick issue troubleshooting in modern architecture setups.
- DevOps-Friendly Design: Built with DevOps teams in mind, it caters to the needs of teams of all sizes, ensuring effective collaboration and productivity.
- Dependency Mapping: Useful for larger and more complex site structures, dependency mapping helps in understanding relationships between different components, aiding troubleshooting and optimization efforts.
Cons:
- Overwhelming Interface: The abundance of information on the interface might be overwhelming for some users, potentially leading to confusion and difficulty in navigation.
Site24x7 is a subscription service and it is available in four editions: Starter, Pro, Classic, and Enterprise. You can get a 30-day free trial to test whether it will work well for your business.
EDITOR'S CHOICE
Site24x7 Website Monitoring stands out as our top pick for REST API monitoring, offering a well-rounded and dependable solution for tracking the health, performance, and uptime of REST APIs. APIs are essential to modern web applications, and any downtime or degradation in performance can have a direct impact on user experience and business operations. Site24x7 helps identify issues proactively by continuously monitoring REST APIs and issuing real-time alerts when potential problems emerge. One of its key strengths is real-time transaction monitoring, allowing you to configure custom API checks to measure response time, availability, and response accuracy across endpoints. The platform enables you to simulate API requests, validate responses, and verify functionality, helping ensure APIs operate as expected. It also provides detailed analytics and reporting, supporting the identification of trends, performance bottlenecks, and troubleshooting insights. With support for multiple notification channels, including email, SMS, and integrations such as Slack, teams can respond quickly to alerts. Its clean, well-structured dashboard and straightforward setup make it accessible for both technical and non-technical users, delivering actionable insights without requiring significant training.
Download: Get a 30-day FREE Trial
Official Site: https://www.site24x7.com/signup.html?pack=44&l=en
OS: Cloud based
2. ManageEngine Applications Manager (FREE TRIAL)

ManageEngine Applications Manager makes REST API monitoring extremely simple. You won’t find any overly complicated options or fancy features, this proper monitoring tool is perfect for those who just need to see the data.
Key Features:
- REST APIs: These APIs enable users to automate various tasks and extract data for custom reporting and analysis to extend the functionality.
- Application Discovery and Dependency Mapping: By visualizing these relationships, you can better understand how different elements interact within their environment, facilitating efficient management and troubleshooting.
- Fault Management and Alerts: it offers robust fault management capabilities, continuously monitoring the performance and health of applications, servers, databases, and other infrastructure components.
- Business Service Management: This feature focuses on aligning IT services with business objectives by monitoring and managing the performance of critical business services.
Why do we recommend it?
ManageEngine Applications Manager is a much broader package than most of the other tools on this list. Although it is named for applications, it also reaches down to server resources and has a small bit of network interface checking as well. So, while it doesn’t reach down to check on the network as much as the Site24x7 system, it does provide a great deal of service monitoring as well as API testing. The most important feature of the ManageEngine system is its application dependency mapping, which provides great root cause analysis.
In a simple chart, you can monitor and examine your service’s uptime, processing time, and name resolution speed in one dashboard. Applications Manager utilizes OAuth 2.0 for authentication across endpoints, which means fast and secure insights into your API transactions.

Although the UI isn’t the most intuitive on our list, you can still expect powerful features such as anomaly detection, root cause analysis, and SLA management. ManageEngine Application Manager does a superb job of giving you a holistic view of all of your organization’s applications and cloud environments at a top-level view. This same level of detail is even carried over in the APM phone app which is available for both iPhone and Android.
Who is it recommended for?
While there is a Free edition of ManageEngine Applications Manager, it is limited to monitoring five assets, which, unless you are only monitoring one API, is not going to be enough. So, almost no business is small enough to beneficially use the Free edition. Therefore, businesses with little money are just going to have to bite the bullet and upgrade to the Professional edition or look elsewhere for an API monitoring tool. Mid-sized and large businesses will love this tool because it will monitor all applications and services along with the API monitor.
Pros:
- Detailed Insights: ManageEngine Applications Manager offers detailed insights into application availability and uptime, facilitating quick identification and resolution of issues.
- Comprehensive .NET Application Management: The product provides a complete set of tools for managing and troubleshooting .NET applications, ensuring efficient operation and performance optimization.
- User-Friendly and Customizable: Users find the tool user-friendly and customizable according to their requirements. It supports customization, such as integrating with MongoDB, with the help of the APM team, enhancing its adaptability to specific needs.
- Root Cause Identification and Reporting: Applications Manager aids in identifying the root cause of issues, generating reports, and setting up alarms, saving significant time. Its support and development teams contribute to the effectiveness of issue resolution.
Cons:
- NOC Dashboard Enhancement Needed: Some users find that the dashboard for NOC (Network Operations Center) in AppManager could be enhanced to provide a more comprehensive view or better usability.
You can download and trial the software completely free for 30 days. Pricing for ManageEngine Applications Manager starts at $945.00 per year, per user.
3. ManageEngine OpManager Nexus (FREE TRIAL)
ManageEngine OpManager Nexus (formerly OpManager Plus) can provide detailed visibility into the performance of your REST APIs. Its performance tracking and code-level insights help you stay on top of your digital experience for seamless business continuity.
Key Features:
- Telemetry Data Analysis: Captures and analyzes telemetry data to provide insights into the health and performance of your APIs.
- Meaningful Insights: Converts raw data into structured insights for better data correlation.
- Dependency Mapping: Creates dependency maps to identify performance bottlenecks.
- Code and Traces: Drill down into your code for accurate transaction tracing.
- Reports and Dashboards: Displays data on intuitive dashboards for easy understanding.
Why do we recommend it?
OpManager Nexus is a good choice for gaining control and visibility over the health and performance of your REST APIs. It captures telemetry data from different sources and analyzes them to gain the required insights about your APIs. Through this analysis, it also identifies errors and drills down into the root cause of each to speed up troubleshooting.
A key feature of this tool is application dependency mapping, which can come in handy to better understand the flow of data across your environment. It is also helpful to pinpoint the exact location of errors or latency. Moreover, its color-coded statuses help prioritize issues.

Who is it recommended for?
We recommend OpManager Nexus for organizations with complex and mixed environments. It is highly scalable and can work well for thousands of APIs, making it a good choice for organizations with multiple web applications and interdependent systems.
Pros:
- Errors and Anomalies: Parses data to identify anomalies.
- Application Dependencies: Identifies application dependencies for easy troubleshooting.
- Data Sources: Captures and analyzes data from multiple sources for better correlation.
- Collaboration: Makes it easy to share documentation across teams for easy collaboration.
Cons:
- Synthetic API Testing: Highly limited when it comes to testing synthetic APIs.
ManageEngine OpManager Nexus offers two plans. The annual subscription for the Professional edition is $1,233 for 50 devices, and for the Enterprise edition, it is $19,995 for 1000 devices. Start a 30-day free trial.
4. Sauce Labs API Testing

Sauce Labs produces a range of application testing services from its cloud platform. The API Testing system is one of its services. This package is useful for development teams that are developing APIs and also those that are developing applications that integrate APIs.
Key Features:
- Functional API Testing and Monitoring: This feature streamlines the process of ensuring that APIs perform as expected, validating their behavior against defined criteria and monitoring their functionality over time.
- Integration Testing: With Sauce Labs, API integration testing becomes fast and collaborative. Teams can easily collaborate on integration tests, ensuring seamless communication and coordination across different departments or teams involved in the development process.
- Performance Monitoring and Load Testing: Sauce Labs allows users to reuse functional tests as performance monitors or functional load tests that can run in any environment.
- Contract Testing with Mocking: Sauce Labs facilitates contract testing with mocking, allowing users to increasingly depend on specification files to define their API program.
Why do we recommend it?
Sauce Labs is a synthetic monitoring system that is offered in three formats: manual testing, automated testing, and device-based automated testing. Basically, though, this is an availability testing service for Web applications, which includes API monitoring services. Manual testing is probably only a feasible strategy during API development because you wouldn’t want to sit and launch an uptime test over and over again around the clock manually once an API s in production.
The testing system tracks underlying microservices and includes them in testing for the applications that rely on them. The system is fast and it is designed to be useful for agile development scenarios where partial changes occur with each release.
This tool can be integrated into CI/CD pipelines to create automated testing as part of a workflow and channel back issues through bug trackers, updating project management software as the units passes onto the next step or cycles back for rework. The testing service carries on through the API’s release and continues to watch over live performance.
The Sauce Labs package includes a Test Composer in which new test scenarios can be created. It is also possible to bring in test cases built in other systems, such as Swagger, OpenAPI, and Postman Collections. The Sauce Labs service is resident in the cloud and it is able to operate in conjunction with other development lifecycle support tools either on your site or on other cloud platforms.

Who is it recommended for?
Developers would need the manual testing tool when they are still writing code either for an API or a system that includes an API call. In all other circumstances, you would need the automated monitoring package. The system can be integrated into a CI/CD pipeline, and device-based testing would be very useful for that scenario. Acceptance testing by a Web application buyer or by the IT Operations team before a system goes live would benefit from the device-based tests to identify whether the new system will work properly when viewed on many different types of devices.
Pros:
- Multiple Deployment Options: Sauce Labs offers various deployment options to choose the setup that best fits your needs, whether it’s cloud-based, on-premises, or hybrid deployment.
- Helpful Kibana Visualization: The platform offers helpful visualization through Kibana, allowing users to gain insights from their test results and performance metrics in a visually intuitive manner.
- Multiple Configuration Options: Sauce Labs provides numerous configuration options for different operating system combinations, allowing users to tailor their testing environments to specific requirements easily.
Cons:
- Lacks Some Valuable Test Analytics: While Sauce Labs provides useful analytics and insights, some users may find that it needs certain valuable test analytics features that could further enhance their testing processes and decision-making capabilities.
Sauce Labs functions run in the cloud and you integrate them into your workflows with an API. So, this is an API to test APIs. You can assess the Sauce Labs system on a 28-day free trial.
5. Dotcom-Monitor

Dotcom-Monitor is a SaaS platform that tests availability and response times of websites and Web services. Among the packages offered by Dotcom-Monitor that one that is directly capable of examining API performance is the Web Services Monitoring plan.
Key Features:
- Internet Infrastructure Monitoring: This feature enables organizations to ensure that critical internet resources, such as DNS servers, web servers, and network devices, are functioning optimally and meeting service level agreements (SLAs).
- Page Performance Monitoring: By measuring factors like page load times, response times, and overall user experience, this feature helps organizations identify performance bottlenecks, optimize web content, and enhance user satisfaction.
- Web Application Monitoring: it allows users to monitor the performance, availability, and reliability of mission-critical web applications.
- Advanced Reporting: This includes customizable reports on resource utilization, performance trends, SLA compliance, and more, enabling organizations to gain valuable insights, track key metrics, and make informed decisions to optimize their IT operations.
Why do we recommend it?
Dotcom-Monitor is a very similar tool to the Sauce Labs service. It is a cloud-based package that can test a Web application from a lot of different locations – that includes API testing. The service provides an on-demand testing system and also automated tests. You can get tests launched from real browsers and mobile devices or choose to run programmatic tests.
The Web Service Monitoring package issues availability tests from 30 locations around the world – you check which sites are used for your testing plan. The tests can be issued through an Internet Explorer, Google Chrome, or Mozilla Firefox browser. The APIs that this service can reach can be written in REST, SOAP, with JSON, or XML.
Tests can be run periodically from one-minute to three-hour intervals. The results of each test are stored on the Dotcom-Monitor server for analysis and are also displayed in the system dashboard. The Dotcom-Monitoring service will store performance metrics for three years, so you can get a long-term perspective on your API performance assessments.
If any test fails, the Dotcom-Monitor service rechecks before raising an alarm. You can specify in the settings of the Dotcom-Monitor system that alerts should be forwarded as voice messages, SMSs, or emails. This means that you can be made aware of system outages even when you are off the clock.

Who is it recommended for?
The annoying aspect of Dotcom-Monitor is that it doesn’t publish its price list. It can be used in exactly the same circumstances as Sauce Labs, so a business’s choice over which of these two services to use for manual and automated API testing would probably come down to price. This system can also be set up as a continuous tester in a CI/CD pipeline and it can run test scripts. Again, these functions are matched by the Sauce Labs platform.
Pros:
- Versatile Alerts: Dotcom-Monitor provides alerts through voice messages, SMS, or email, ensuring users are promptly notified of any issues.
- Comprehensive Dashboards: The platform offers extensive dashboards and real-time data, enabling users to gain insights into their website or application performance at a glance.
- Load Testing: Dotcom-Monitor includes load testing capabilities, allowing users to assess their website or application’s performance under various traffic conditions.
- Multi-location Testing: With multi-location testing, users can simulate user experiences from different geographic locations, ensuring consistent performance globally.
Cons:
- Reporting Complexities: Some users find reporting complexities within Dotcom-Monitor, potentially making it challenging to generate and interpret reports effectively.
Another service from Dotcom-Monitor that would be of interest to eCommerce enterprises is its Web Pages plan, which checks on response times of website pages and their elements. The Web Applications service would also be of use. That allows you to create your own tests and step through code as it launches. The Internet Infrastructure module tests server and network availability and the Load/Stress Testing service challenges the capacity of your Web servers. You can get a 30-day free trial of all of the Dotcom-Monitor services.
6. AlertSite

AlertSite provides some of the most comprehensive REST API monitoring on the market. AlertSite has a unique and flexible approach to monitoring. Instead of being bogged down by a sea of alerts, AlertSite utilizes technology that monitors both the API layer as well as the UI for functionality, application performance statistics, and availability.
Key Features:
- Hybrid Deployment: AlertSite offers a hybrid deployment model, allowing users to choose between cloud-based and on-premises deployment options.
- Fast and Intelligent Alerting: Alerts are triggered based on predefined thresholds and conditions, ensuring that potential problems are addressed in a timely manner to minimize impact on end-users.
- Automate and Configure with AlertSite APIs: This includes programmatically creating and managing monitors, configuring alerting settings, retrieving performance data, and integrating with other tools and systems.
- Robust Reporting & Analytics: advanced analytics tools help users analyze performance data, detect anomalies, and optimize their digital experiences for better user satisfaction.
Why do we recommend it?
AlertSite is one of three products from SmartBear Software that can be used for API testing. The other two are Bit Bar and ReadyAPI. If the description of AlertSite doesn’t quite sound like the type of API testing that you are looking for, check out those two other products before passing the SmartBear website by. The AlertSite system gives you API testing in the context of a live website that contains an API. If you are an API user, you would probably be particularly concerned with automated tests to ensure that the API doesn’t malfunction unexpectedly in the middle of the night. That’s what you get from AlertSite. You can set up scripts with a macro on a walkthrough with a system called DejaClick.

With clear application performance metrics at your disposal, you won’t have to play detective to determine if you’re getting another false alert again. AlertSite API monitoring solution lets you create alert monitors straight from a GUI interface without any coding needed.
DejaClick, one of my favorite features in the product, allows you to select the elements on the site you want to monitor in just a few clicks. DejaClick pulls the API data collection from the backend and begins the monitoring process seamlessly. You can even use clicks from user traffic to create specific scripts on the fly, all without having to crack open a command line.
Who is it recommended for?
Website owners that are running pages that have API components will need this tool. It can check on site uptime but you can also get it to run scripts to provoke interactive elements that are probably based on APIs. Confusingly, AlertSite is also available as an API. So, you can monitor your APIs through an API. This configuration lets you add website and API availability testing into your main system operations monitoring tool. If you are developing APIs or systems that call APIs, you should check out SmartBear ReadyAPI instead.
Pros:
- Deja-Click Recorder: AlertSite features the Deja-Click Recorder, which is an excellent tool for recording and replaying user interactions, facilitating easy script creation and monitoring setup.
- User-Friendly Interface: The platform boasts a user-friendly interface that translates well onto large Network Operations Center (NOC) screens, ensuring clear visibility and easy navigation for monitoring teams.
- Easy Alerting and Reporting: AlertSite offers straightforward alerting and reporting features, enabling users to set up alerts quickly and generate comprehensive reports to track performance metrics effectively.
- Comprehensive URL Monitoring: AlertSite excels in end-to-end application URL monitoring and front-page URL monitoring, providing comprehensive coverage and insights into website performance from various perspectives.
Cons:
- Monitoring Locations Issues: Some users may experience issues with monitoring locations, potentially affecting the reliability and accuracy of tracking data collected from different geographic regions.
AlertSite is compatible with all modern versions of Windows. Pricing for AlertSite starts at $199.00 (£162.97) per month and scales with your monitoring needs. You can try a free one-month trial of AlertSite to see if it’s a good fit for your REST API monitoring needs.
7. Postman
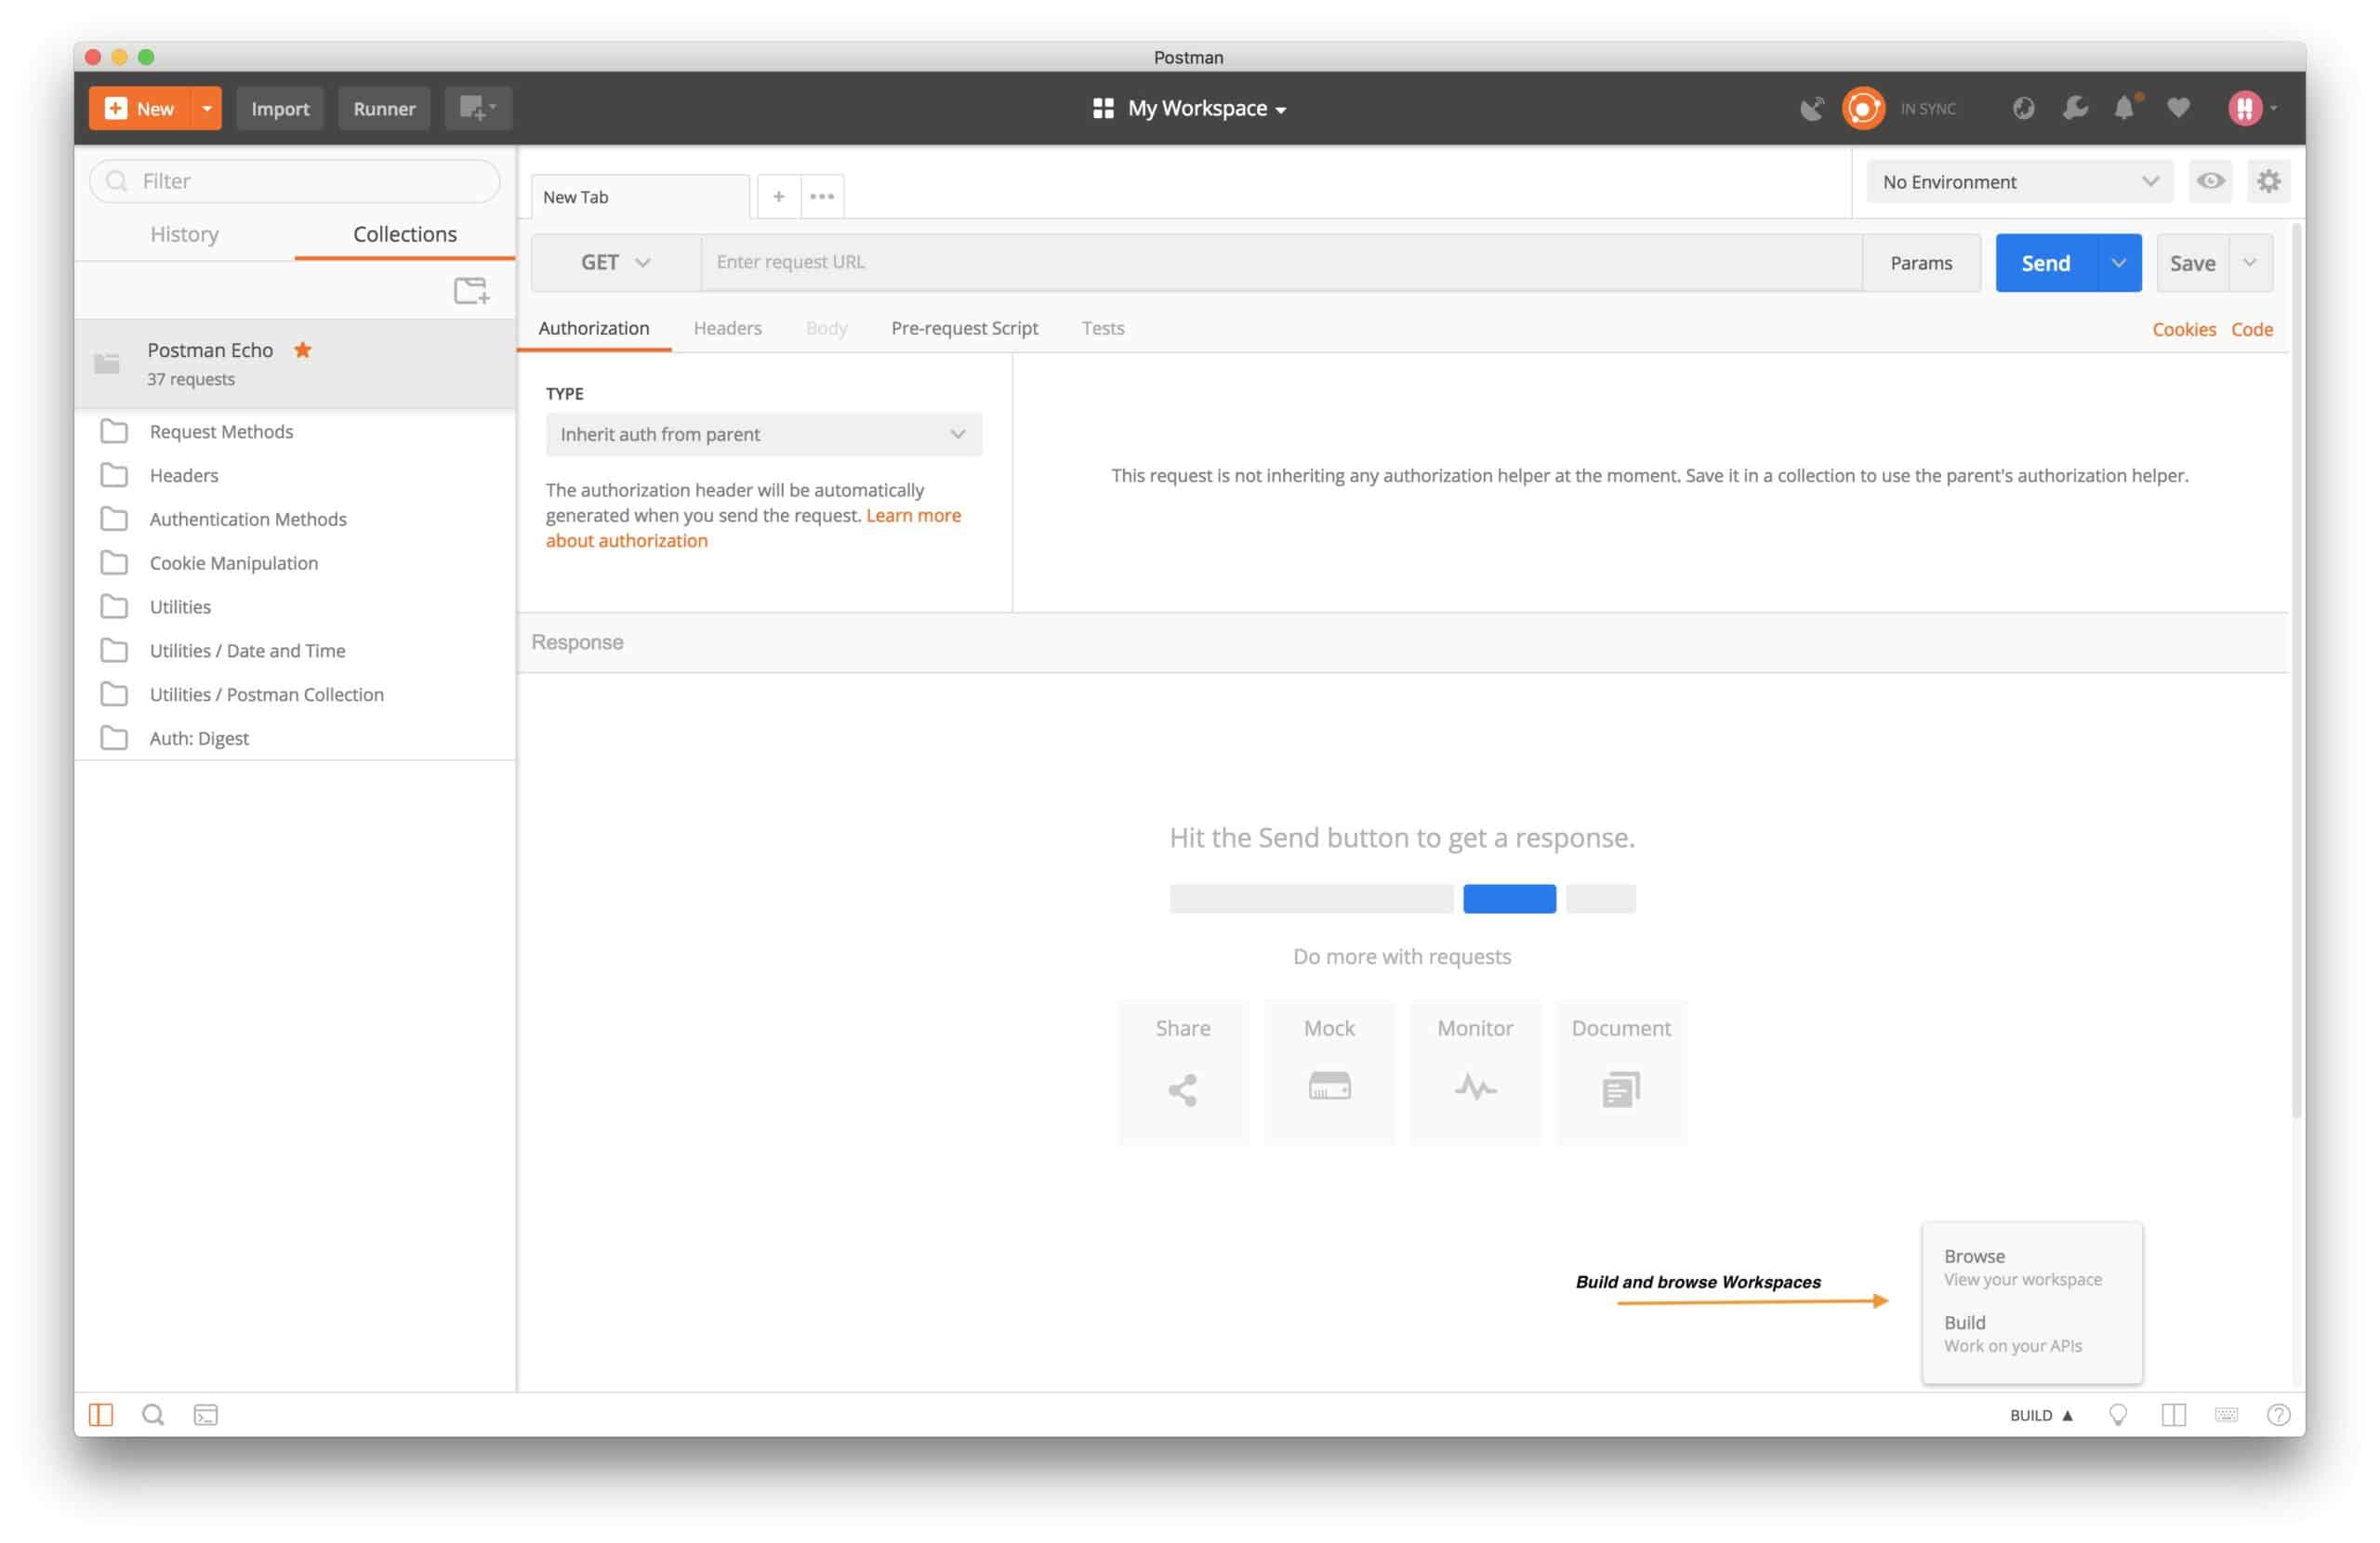
It should come to no surprise that Postman made it on the list. With more than 10 million developers using Postman, it’s one of the most popular REST monitoring and performance testing applications available and is compatible with Windows, macOS, and Linux systems. A large reason why Postman is so popular is due to its simple UI and ease of use. In addition to functional API testing, Postman can be a simple yet powerful way for application monitoring and services.
Key Features:
- API Performance Monitoring: This includes features such as comprehensive testing, complete reporting, and historical data retention. Users can track performance metrics over time to identify trends and potential issues.
- Flexible Pricing Plans: Postman offers flexible pricing plans that cater to various needs and budgets. This allows users to utilize the tool to its fullest extent without incurring unnecessary expenses.
- Monitor Creation and Configuration: With Postman, users can easily create and configure monitors to track the performance of their APIs. Monitors can be customized according to specific requirements and can be set up to run at regular intervals.
- Quick Alerts and Notifications: It allows users to set up alerts and notifications to get updated about any issues with their APIs.
Why do we recommend it?
Postman is a little different from the other API monitoring tools on this list because it is a full API management platform. You use the Postman framework to build APIs or to create other applications that call in APIs. It is better at supporting the usage of APIs by the teams that create them. The tool maintains libraries/repositories of APIs and tracks their usage in other systems. The service provides a testing package for APIs under development and when they are integrated into other packages. It will also manage unit testing, integration testing, and acceptance testing. The tool continues to monitor APIS when they are live.
In just a few clicks you can create a monitor that will trigger an alert based on a number of preset or customized variables. Postman also features multi-region monitoring gives you additional flexibility and insight when it comes to monitoring your services on a global scale.
When you set up a monitor it essentially runs as a test script. When that script fails you have a number ways you can be altered outside of just your dashboard and email. Postman has a wide variety of integrations and can alert you through Slack, HipChat, or PagerDuty.
Postman makes API monitoring solutions available to anyone and is fully accessible under the free plan. The free plan does have its limits and starts requiring an upgrade when you hit 200 parallel runs on a single monitor.

Who is it recommended for?
Postman is a hybrid system. It is delivered through a console that installs on Windows, Linux, and macOS, but it has a cloud coordinator, which enables team collaboration and management functions and also the execution of tests from different locations on an automated cycle. This tool is almost overwhelmingly intended for the developers of APIs. There is so much development support in the package that, although it could be used just in operations, most of the functionality of the tool would be wasted under that scenario. The testing system is very similar to SmartBear AlertSite because it has a macro recording service that will assemble test scenarios for you by tracking your walk-through. There are other interesting options, such as cycling through all possible input values and testing from multiple locations.
Pros:
- Excellent Support for REST and SOAP APIs: Postman offers robust support for both REST and SOAP APIs, making it versatile and suitable for a wide range of API testing and development needs.
- User-Focused UI: Postman features a user-focused interface that prioritizes ease of use and intuitive navigation, ensuring a smooth and efficient user experience.
- Large Community: Postman has a large community of users, so you can easily access a wealth of resources, tutorials, and community-driven support channels for assistance and collaboration.
Cons:
- Heavy Disk Usage for Desktop Version: Some users faced disk space issues while using this tool on a desktop.
The good news is, Postman Team pricing starts at just $12.00 (£9.83) a month and scales with your monitoring needs. Their pricing model also contains a unique “pay-as-you-go” system which allows you to purchase 1000 API calls for $0.75 (£0.61), or 50,000 pre-purchased API calls for $20.00 (£16.38) a month. You can download the free app to get going.
8. Loggly

The Loggly API monitor leverages the SolarWinds cloud network to monitor your app’s performance data and entire system activity across the entire stack. Loggly’s clean dashboard allows you to quickly recognize problems and eliminate them before they start impacting your services.
Key Features:
- Real-time Monitoring: Loggly provides users with a real-time view of activities and events occurring across distributed environments.
- Open Protocols: By using open protocols, users have the flexibility to integrate Loggly seamlessly into their existing infrastructure without being locked into a specific technology stack or vendor.
- Data-Driven Searches: Loggly allows users to let their data guide their searches, helping them efficiently pinpoint relevant information and insights.
- Cloud-Scalable Service: it is 100% cloud-scalable service, so you can flexibly change the log management infrastructure according to their evolving needs.
Why do we recommend it?
Loggly is an interesting monitoring tool because it mines logs for monitoring data. Live tail log message processing gives you live feedback and those log messages are still available for filing and later reference. Loggly can be used for security monitoring as well as performance monitoring, It can be used to pre-process log messages before forwarding to a SIEM. This is a cloud-based system and the price you pay depends on a range of factors that include the data retention period and what your data throughput is going to be. As well as suitable for use for monitoring APIs, Loggly provides an API that can feed alerts into your other monitoring tools, enabling you to centralize your monitoring efforts into one console.
The dashboard is fully customizable but comes with pre-built views to monitor your services KPIs and usage statistics. Loggly really begins to shine in larger, more complex environments with it’s graphing and time-series data. In just a few clicks you have a bird’s eye view of your most-used services, API errors over time, and about a dozen or so other usage statistics.

When it comes to collaboration, Loggly leads the way with its simple dashboard sharing. This feature ensures everyone is on the page during dev meetings quickly and efficiently. In the sharing options, you can set the controls to manage who can edit and manage the overlays.
As Loggly monitors your environment it begins proactively scanning through your logs. Outside of standard alerting, Loggly has built-in anomaly detection which learns what normal patterns look like over time and bring any deviations to your attention. This is especially useful for tracking down suspicious events and fixing problems that otherwise wouldn’t have triggered an alert.
Who is it recommended for?
Loggly is a good system for monitoring all of your IT assets, not just API activity. Its ability to gather network, server, and application logs gives it a central view of all activities and you can also use the monitoring tool to set up alerts for abnormal activity. So, businesses of all sizes would benefit from using this tool. System administrators that like to customize their own IT services will particularly enjoy the capabilities of Loggly. There is a Free edition of Loggly for small businesses. The top plan can be integrated into JIRA for project management feedback. However, it is difficult to imagine that this system would be used for development testing or monitoring. Loggly is definitely better suited to monitoring live systems rather than APIs under development.
Pros:
- Efficient Log Capture: SolarWinds Loggly excels in capturing logs effectively, ensuring comprehensive monitoring of system activities.
- Robust Reporting and Filtering: The platform offers powerful reporting and data filtering features, enabling users to extract valuable insights from their log data easily.
Cons:
- Limited AI for Dashboard Creation: SolarWinds Loggly could benefit from enhanced AI capabilities for automatically generating useful dashboards, potentially streamlining the process of visualizing and interpreting log data.
You can try Loggly and all of its features on a 14-day free trial. Loggly has a flexible four-tiered pricing plan that can fit most if not all environments. The single-user version of Loggly is a completely free tool, and the small business package starts at $79.00 (£64.70) per month for three users.
9. AppDynamics
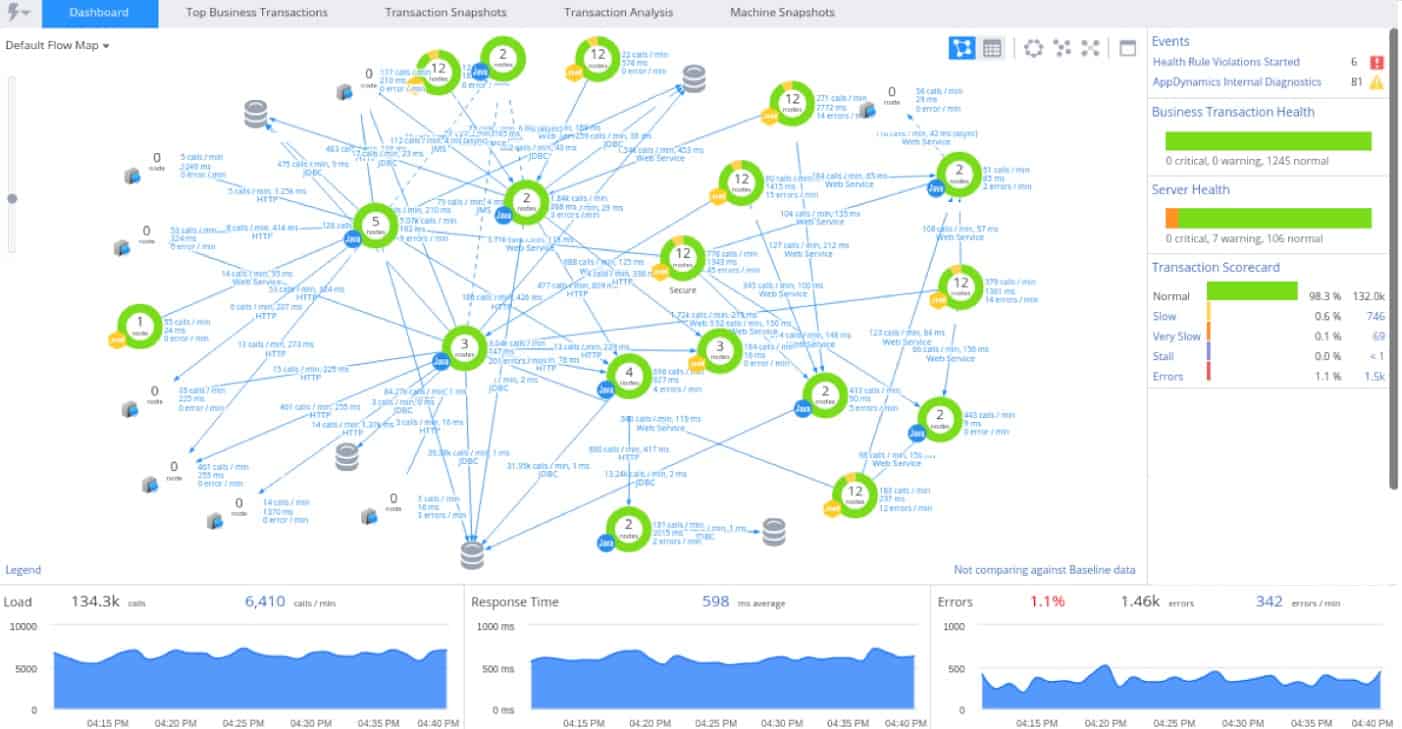
AppDynamics is a powerful API monitor that’s part of the Cisco product suite. You’ll all of the powerful features and insights you’d expect for a Cisco product inside of AppDynamics. Real-time data visualization is some of the best and most concise in the market. Is one dashboard AppDynamics has everything you need, and nothing you don’t.
Key Features:
- Real-time Monitoring and Analytics: you can find the problem and solve it quickly before it impacts end-users, ensuring optimal application performance and reliability.
- Customizable Alerting Rules: you can tailor these rules to specific requirements and conditions, ensuring that relevant stakeholders are promptly alerted to any issues that require attention.
- Customizable Dashboards and Visualizations: This enables users to track key metrics, monitor trends, and gain actionable insights into the health and performance of their applications and infrastructure.
- Integrations with Popular Monitoring and Logging Tools: this tool can easily integrate with popular monitoring and logging tools, allowing users to leverage existing investments and workflows.
Why do we recommend it?
AppDynamics is an application performance monitor. That remit also extends to Web application monitoring and API monitoring. This system is good at monitoring applications together through an application dependency map. Examining dependencies is particularly important for Web applications because of the involvement of APIs. AppDynamics can examine on-premises and cloud-based application performance and then thread through to code to identify third-party provided APIs that are running on servers that are not under the using company’s control.
With its node and tier-based visualizations, you can easily see where a problem is, and exactly what web services it will impact down the line. In a few clicks, you can select any node or call in progress to drill deeper down and get further information on its current status, past performance monitoring, and availability.
AppDynamics is backed with AI root cause analysis that works in the background to not only detect problems but diagnose them proactively. Appdynamics is powerful, and in my opinion best suited for larger cloud-based environments.

Who is it recommended for?
AppDynamics is aimed at businesses that use Web systems that include APIs. The operations team that runs AppDynamics for system monitoring might not know what APIs are involved in their live systems. However, the constant updates to the application dependency map provided by AppDynamics soon let them know what’s going on. There isn’t much that an operations team can do when a third-party application goes wrong, other than log a ticket with that system’s provider. With AppDynamics in place, that ticket can detail precisely which component of the provided system has a problem.
Pros:
- Deep Code-level Traceability and Profiling: AppDynamics offers deep insights into code-level performance, helping identify and optimize performance bottlenecks within the codebase for tangible improvements.
- Real-time Dashboards and Insights: it provides real-time dashboards and detailed insights into each layer of the application stack, enabling a transparent view of performance metrics for better decision-making.
- Proactive Issue Detection and Resolution: With AppDynamics, users can actively detect and resolve performance issues, ensuring smooth operations and preventing outages that could disrupt user experience.
- Monitoring Throughout Release Lifecycle: AppDynamics enables monitoring of stability and performance across different stages of the release lifecycle, minimizing regression risks and facilitating smooth rollouts.
Cons:
- Tracking Complexity in Distributed Systems: some users find issues in tracking transactions through complex distributed systems and microservices.
You can start a free 15-day trial of AppDynamics with no credit card required. Pricing for AppDynamics API monitoring starts at $3300.00 (£2702.58) a year.
10. API Science
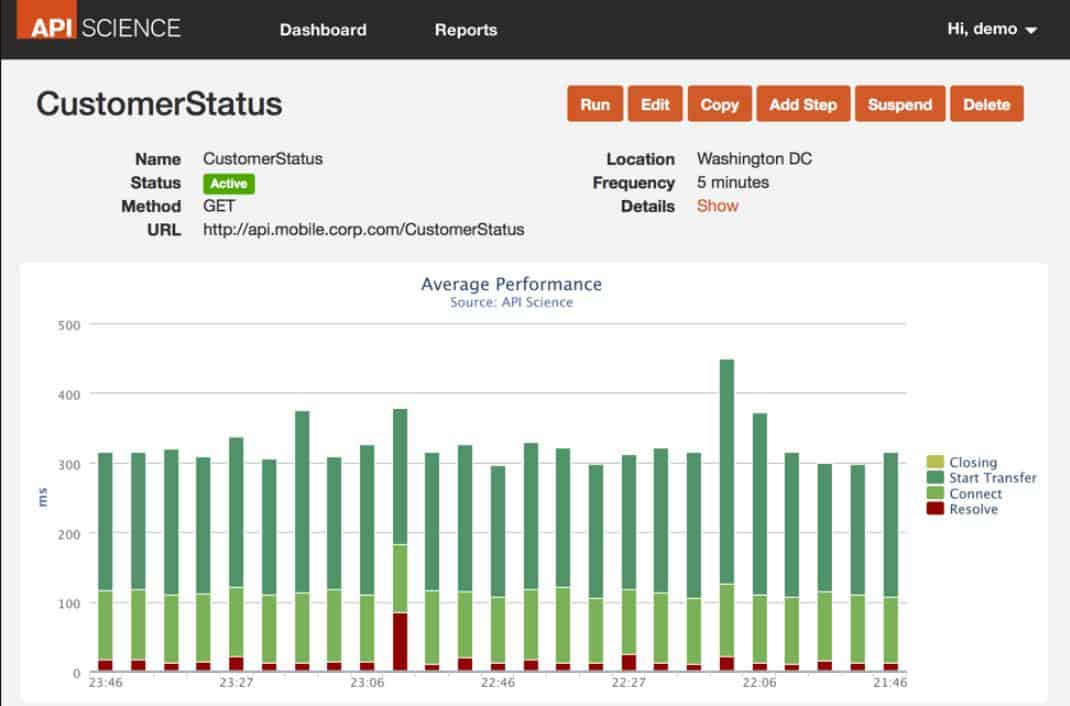
API Science was built specifically to serve and monitor REST-based API services. Like many of the list API monitors, you can expect a stunning interface and easy-to-access analytics from the reporting dashboard. API Science boasts quick and efficient onboarding, meaning less time setting up your account, and more time digging into the data that keeps your customers happy.
Key Features:
- SLA Management: it allows the tracking of API performance metrics to make sure service levels are met consistently and APIs are easily available.
- API Security: you can monitor for unauthorized access attempts, detect suspicious activities, and implement security best practices to safeguard sensitive data and prevent security breaches.
- Multi-Cloud: This feature includes monitoring API performance and availability consistently, regardless of the cloud environment in which their APIs are hosted, enhancing flexibility and scalability.
- API Monitoring: This includes detecting errors and anomalies and generating alerts to notify users of any issues that may affect API performance or user experience.
Why do we recommend it?
API Science is a package for API developers. This package includes development management and API testing. The testing features in the system can be equated to monitoring because it persists during the development lifecycle. Testing/monitoring requirements will simplify once an API goes live and reduce to availability testing once the API has been in production for a while. This isn’t a tool for ongoing monitoring by operations teams looking after third-party applications.
From the monitoring dashboard, you can quickly monitor your own APIs, as well as any third-party APIs your entire systems rely on. In addition to creating your own custom monitors, there are a number of pre-configured sample monitors to get up and running right away.
Since API Science is REST-based, you can monitor your REST API with their API giving you the flexibility and freedom to build your own custom dashboards, and integrate them into custom applications and consoles.

Who is it recommended for?
This is an API development support system. It can provide on-demand testing during code development and continuous testing for CI/CD pipelines. It isn’t so good for third-party API testing, so if you are developing an application and you want to profile an API for possible inclusion, API Science isn’t the best choice.
Pros:
- Intelligent API Diagnostics: AppDynamics offers intelligent API diagnostics, providing deep insights into API performance and behavior for effective troubleshooting and optimization.
- 60 Seconds Testing Interval: The platform allows for testing at a 60-second interval, ensuring timely and accurate monitoring of application performance.
- Customized Reporting: AppDynamics provides customizable reporting capabilities to tailor reports to their specific requirements and gain actionable insights into application performance.
- Test Scripting Capabilities: With test scripting capabilities, users can create custom scripts to simulate user interactions and test application functionality, ensuring robust performance under various conditions.
Cons:
- Limited Functionality: Some users may find that AppDynamics has limited functionality compared to other monitoring tools, potentially limiting its ability to meet specific requirements or address complex use cases.
API Science has straightforward pricing that starts at $29.00 (£23.75) per month for three users and can support up to 100,000 API calls. You can test out API Science for 30 days to see if it’s right for your API monitoring needs.
11. Bearer
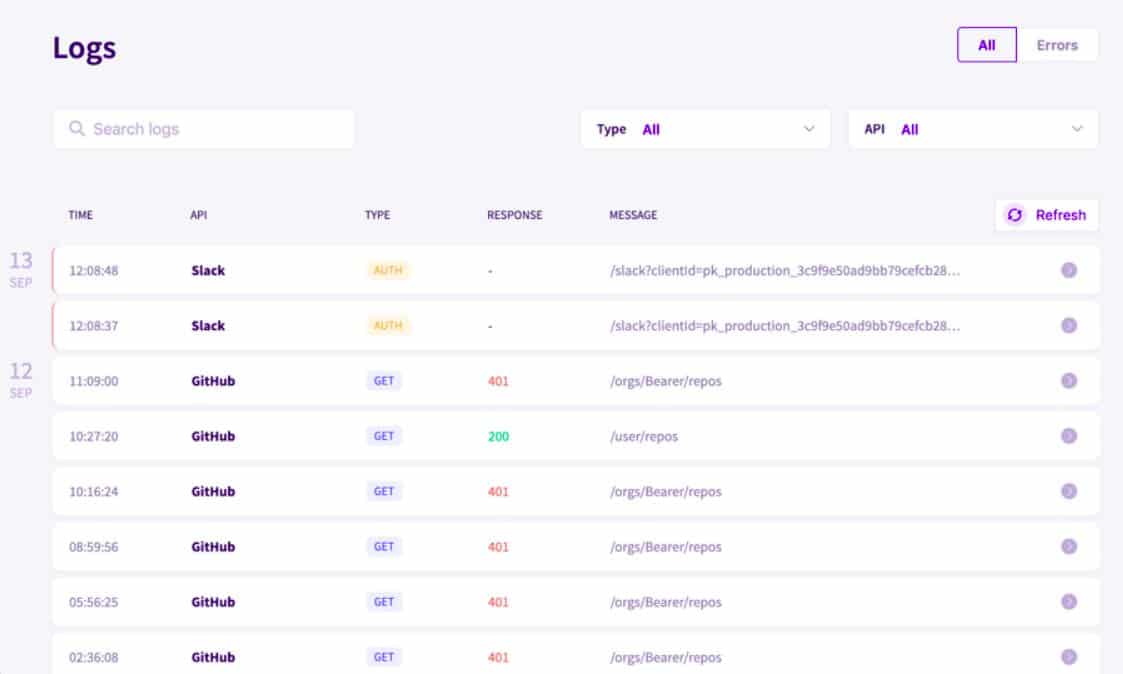
Bearer is an API monitor that has some diverse functionality to help provide automated alerts across different applications. One of my favorite features of Bearer is its simple install. With just one line of code, Bearer can be unpackaged and ready to go without any changes to the code or environment.
Key Features:
- Free & Open SAST: It allows users to conduct static analysis of their applications’ source code. This helps you to identify potential security vulnerabilities and coding errors early in the development process.
- Privacy and Security: This includes robust encryption protocols, compliance with industry standards and regulations, and proactive measures to prevent data breaches.
- Automated Anomaly Detection: By analyzing metrics and patterns, Bearer can detect and alert users to any unusual or unexpected activities, helping identify potential threats or issues early on.
- Separate Dashboards for Each Application: clear and organized view of each application’s performance, metrics, and status, enabling users to track progress, identify trends, and make informed decisions accordingly.
Why do we recommend it?
Bearer is a SAST package. SAST stands for static application security testing. This is a package for API developers and it focuses specifically on scanning through code for known security weaknesses. It can be best described as a vulnerability scanner for APIs that have not yet been released. You can use this package to test existing APIs for risk before accepting them for use in your new system, use it for development testing, or put it in continuous mode for CI/CD pipeline acceptance testing.
Quickly set up rate limits and trigger incidents defined by whatever SLA or internal requirements you adhere to. Separate dedicated dashboards keep your application monitoring easy to manage and read. You can break down your data collection into separate application metrics, or pull all of the relevant data together into a single report.
Bearer’s fast installation and ease of use make it an easy choice for anyone looking to quickly test out REST API monitoring applications.

Who is it recommended for?
This is specifically a tool for use by development teams. You wouldn’t use it for ongoing monitoring of live APIs and you certainly wouldn’t use it for bought-in apps that were developed elsewhere. As it is a code analyzer, the tool specializes in scripting languages, such as Java.
Pros:
- Tailored for REST API Monitoring: Bearer is designed specifically for monitoring REST APIs, ensuring focused functionality without unnecessary features.
- Simple UI: The platform boasts a simple user interface, making it easy to navigate and use for monitoring tasks.
- Straightforward Pricing: Bearer offers straightforward monthly pricing plans, providing clarity and predictability for budgeting purposes.
- Suited for Small to Medium-sized Teams: Bearer is well-suited for small to medium-sized teams, offering scalable monitoring solutions that meet their needs without unnecessary complexity.
Cons:
- Dashboard Improvement Needed: Some users find little trouble with dashboards, especially when viewing multiple applications in a single view.
All of Bearer’s pricing plans include error tracking, anomaly detection, and performance metrics. You can try Bearer API monitoring for free, or purchase their Pro plan starting at $49.00 per month. Pro plan includes increased log retention, 20 million API calls per month, and up to three user licenses.
12. Uptrends
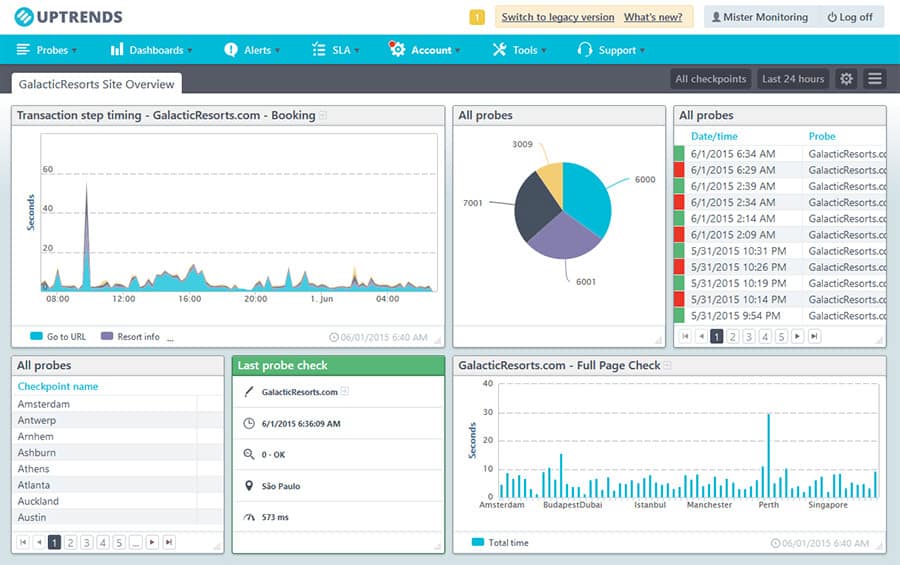
Uptrends is an API monitoring and testing tool with a simple yet powerful step editor that lets you customize your alerts to reflect the user’s exact journey. This gives you full control of the alerts you receive and ensures that your monitoring isn’t just running a simple ping check but actually testing the steps needed to fulfill your service.
Key Features:
- Synthetic & API Monitoring: It offers synthetic monitoring capabilities, allowing users to simulate user interactions with their websites or applications from various locations worldwide.
- Real User Monitoring: By monitoring fundamental user interactions, including page load times, transaction completion rates, and user demographics, organizations can identify performance issues and optimize the user experience accordingly.
- Infrastructure Monitoring: Infrastructure monitoring involves tracking the performance and health of servers, networks, and other IT infrastructure components.
- Location-based Performance Metrics: you can monitor performance from multiple locations, and organizations can identify regional variations in performance to ensure consistent user experience for global audiences.
Why do we recommend it?
Uptrends is a synthetic monitoring service that will periodically launch availability tests against a given website or Web asset, such as an API. The main purpose of this system is to make sure that an API or site is running and can be accessed by users. Uptrends offers its services on a subscription basis and there are five plans. Only the top two of those editions include API monitoring. In both of those plans (Business and Enterprise), API monitoring is a paid optional extra.
While some API monitors use virtual browsers to test websites in, Uptrends only uses real unsimulated browsers to test your web services and applications. Currently, you can test from Google Chrome, Internet Explorer, and Firefox. You can easily compare your speeds and performance data side by side with each browser to quickly find bottlenecks and opportunities to improve.
Test your APIs from over 209 different locations across the world. Uptrends also has a unique feature called Private Checkpoints, which allows you to test your APIs from behind your firewall via on-premise virtual machines. This can help identify problems internally such as DNS resolution, or LAN congestion that would otherwise not be visible from the outside.

Under the API monitoring section, you can define assertions that check for each response and ensure you’re getting the correct status codes and responses.
You also have the capability to add authentication to access and test your protected APIs in just a few steps. This mix of attention to detail combined with a drag-and-drop interface make Uptrends a serious contender and a great choice when looking for REST-capable API monitoring.
Who is it recommended for?
Uptrends is a classic Web application monitoring package. It includes synthetic monitoring, which is what you need for API monitoring and real-user monitoring. You can choose to set up alerts for different attributes, such as availability or response times. The system can also be used to run test scripts rather than just running an API – these are called multi-step monitoring services. Tests can be run for any of 231 different locations. This is a tool for operations teams and not for developers.
Pros:
- Uptime Monitoring: Bearer offers uptime monitoring for APIs and websites, ensuring that they remain accessible and operational.
Alerting Options: The platform provides alerts via email and SMS, allowing users to stay promptly informed about any issues or downtime. - Integrations: Bearer supports webhooks and integrates with popular messaging platforms, facilitating seamless communication and workflow automation.
Cons:
- Pricey Transaction Monitors: many users find the transaction monitors to be relatively expensive. But we think the functionality they offer at this price is worth it.
You can get started for free with a 30-day trial, or jump right into the Starter package for just $12.02 (£9.84) a month.
Choosing a REST API Monitoring Tool
Having a solid API monitoring system is pretty much mandatory for any organization’s environment that runs its own web services. The loss of API functionality could result in thousands of dollars of lost revenue.
While there’s clearly plenty of choices when it comes to filling your REST API monitoring needs, some tools shine brighter than others. I find Loggly to strike the best balance between usability, flexibility, functionality, and price.
AlertSite is a great runner-up, with a clean user interface, multiple alerting configurations, and codeless element-based testing. Not all monitors may suit your needs so be sure to take full advantage of any free trials that may be available.
REST API Monitoring FAQs
How to check the health of REST API?
Health checking functions vary depending on the API being used. The best way to track the health of a REST API is through an API monitoring tool, such as those listed in this article.
What are some good ways to track API usage?
API usage tracking functions depend on the ownership of the API you want to track. If the API is a partner tool from one of your own programs, you need to integrate access logging within the API code, writing to a log file on your server every time the API is accessed. If you have deployed an API from a utility owned by someone else and want to record how many times that piece of code is activated, you will need to associate a logfile record generating function with the triggering of the API.
What is the difference between REST API and RESTful API?
REST stands for “Representational State Transfer” and it is an architecture of application interface that is based on existing Web technologies and protocols, such as HTTP. The term “RESTful” simply means “written in the REST style.” So, the terms REST API and RESTful API are more or less interchangeable.
