
An amazing feature of serverless systems is that they run on servers. That makes monitoring them a whole lot easier. The “serverless” concept is a status that relates to how businesses are charged for hosting on cloud servers.
Rather than renting processing power and disk space as a virtual server, businesses just pay for the space to hold the application code and just the seconds of processing power that they use each time they run.
The serverless model is particularly appealing to the creators and operators of microservices. These are small programs that support mobile apps. Although mobile devices have quite a lot of processing power, a lot of CPU work runs down the battery quickly. Therefore, it has become common practice to make the “app” just an interface with all of the processing performed on a server somewhere.
Here is our list of the best serverless monitoring tools:
- AppOptics EDITOR’S CHOICE This cloud-based application performance monitor can interface with AWS to gather statistics on Lambda systems. Get started with a 30-day free trial.
- ManageEngine Applications Manager (FREE TRIAL) This application monitor implements distributed tracing for the AWS platform, gathering statistics on the performance of Lambda and SQS modules, for Oracle Cloud serverless systems, DynamoDB, and Node.js. Installs on Windows Server and Linux. Start a 30-day free trial.
- Site24x7 (FREE TRIAL) A cloud-based application performance monitor that is also able to monitor serverless systems. This tool includes AI processes to identify performance issues. Start a 30-day free trial.
- Datadog APM A comprehensive distributed tracing system that is integrated into a wider cloud-based application performance monitoring system.
- New Relic Serverless Monitoring A highly-respected distributed tracing system that is based in the cloud and offers 100 GB of data collection and processing for free every month with a low rate per GB thereafter.
- Dynatrace This serverless monitoring system is part of a very advanced cloud-based application and infrastructure monitoring service that integrates AI to increase task automation.
- ServiceNow Cloud Observability This serverless monitoring package was, until recently, Lightstep, which was started by the developer of Google’s own in-house distributed tracing system.
The advent of microservices provides a great outlet for web services developers. Just like SaaS projects include the processing server with the software that subscribers want to use, serverless microservices offer access to their functionality without having to copy over the software and host it. Now, these services are accessed through APIs. The user, which is the developer of a mobile app or website, just calls the function that is hosted by the producer of the service.
Serverless monitoring issues
There are two types of serverless accounts: the ones you pay for and the ones that host other people’s systems that you subscribe to.
The matter of monitoring your own serverless systems is fairly straightforward because you know where they are. However, as you don’t have any server space other than the area occupied by your code, there wouldn’t be anywhere to install an agent, which is how monitoring systems usually operate.
If you access a service through an API, there are other complexities to deal with when working out how to monitor them. First of all, you don’t know where their host is located. Secondly, you don’t know which other services those processes rely on and where those other pieces of code are hosted.
Solutions for serverless monitoring
Fortunately, there is a solution for monitoring services where there is no room on the same server to host monitoring software and when you don’t even know where those hosting servers are. There are two names for this type of monitoring: telemetry and distributed tracing.
Distributed tracing systems back chain through the API to find the location of the host. It also examines the execution of that service to see what other services feed into it, then it tracks those to their hosts, and so on. The distributed tracing system starts off working as a Web crawler to find all of the backend services for an API.
“Telemetry” refers to the way these distributed tracing systems work forward to verify the actions of each link in the web of microservices. A telemetry system operates alongside a running process. It works on the principle of examining before and after statuses of the calling procedure.
The best serverless monitoring tools
Serverless systems are at the forefront of technology and one of the fastest-growing sectors of the IT industry. Fortunately, serverless monitoring systems are being produced by great innovators.
Telemetry is a very clever concept and it could expand to implement all cross-platform and internet-bound monitoring in the future. Right now, you can experience this impressive form of monitoring thanks to the products of some of the best monitoring tool producers in the business.
Our methodology for selecting a serverless monitoring tool
We reviewed the market for serverless monitoring services and analyzed the tools based on the following criteria:
- Access to cloud platforms that offer serverless hosting
- API monitoring
- Distributed tracing to watch microservices as they run
- Tracking cold starts
- Correlation of function performance with resource usage
- A free trial or a demo system for a no-obligation chance to test the package before buying
- Value for money, provided by an integrated monitoring system for functions and their supporting infrastructure that is delivered at a fair price
1. SolarWinds AppOptics – (FREE TRIAL)

AppOptics from SolarWinds is a cloud-based application performance monitor that has great monitoring capabilities for applications hosted on-premises or on cloud servers but it is a little light in the serverless monitoring department.
Key Features:
- Distributed Tracing: Tracks microservices
- Waterfall Model: Examines subordinate functions
- Code Profiling: For test-based web scripts
- Integrates with AWS Lambda: The most widely-used serverless platform
- Correlation between Performance and Resources: Covers applications on servers and cloud platform
Why do we recommend it?
SolarWinds AppOptics is able to track microservices and the server-based system with which they interact. The package provides distributed tracing and code profiling. These tools are used for live performance monitoring and they are also pooled with other data sources, such as logs to provide a retrospective analysis utility.
The distributed tracing capabilities of AppOptics are limited to monitoring AWS Lambda-hosted serverless systems. The monitor operates by receiving status messages through the AWS platform.
AppOptics includes an application dependency map that assists in root cause analysis whenever a problem is detected in the performance of an application or a supporting resource. The system includes an alerting mechanism that triggers email and SMS notifications if the performance of an application deteriorates or if a resource is running short.
Who is it recommended for?
If you particularly need serverless monitoring, be aware that AppOptics has an interface to AWS Lambda. It is able to collect data from GCP and Azure and its distributed tracing function crosses platforms. However, you get a better service from this monitoring tool if your serverless systems are on Lambda.
Pros:
- Offers Great Visualizations: Reflect live and historical health metrics and resource consumption
- A Cloud Service: Easily scalable
- Tracks All Major Resources: Focuses on over 180 different metrics
- Virtual System Monitoring: Docker, Azure, and Hyper-V platforms
- Customizable Service: Offering more flexibility than competing options
Cons:
- No Self-Hosting Option: Only available as a cloud-based service
The AppOptics system is a subscription service and it is offered in two editions. The first of these is called Infrastructure Monitoring. However, you need the higher plan to get distributed tracing. That plan is called Infrastructure and Application Monitoring. You can experience the AppOptics system on a 30-day free trial.
EDITOR'S CHOICE
AppOptics is our top choice! A powerful serverless monitoring tool for staying on top of your serverless applications deployed on AWS Lambda using distributed traces and AMP agents. Ideal for infrastructure that is scaling and lets you manage resources effectively so as not to blow out operating costs.
Download: Access 30-day FREE Trial
Official Site: my.appoptics.com/sign_up?
OS: Cloud-based
2. ManageEngine Applications Manager (FREE TRIAL)

ManageEngine Applications Manager is able to track applications and services running on your servers or on a cloud host. It is very good at linking together applications to identify an application dependency map.
Key Features:
- Application Dependency Mapping: Provides root cause analysis
- Distributed Tracing: Watches function activity
- Code Profiling: For text-based web scripts
- Server and Platform Monitoring: Checks on resource availability
Why do we recommend it?
ManageEngine Applications Manager offers a wide set of tools to monitor all types of applications, including microservices that run on serverless systems. The package has a similar strategy to monitor web applications and what has become known as “middleware” in that it identifies the connections between software and services and even the links between software units.
This otherwise excellent monitoring system isn’t higher up on our list because it doesn’t operate a telemetry service for serverless monitoring. Its distributed tracing capabilities are limited to tracking those serverless systems that are hosted on platforms that have logging systems built into them. This list includes AWS Lambda and SQS, Oracle Cloud, DynamoDB, and Node.js.
Although it is a shame that ManageEngine hasn’t implemented telemetry, the modules that it is able to track get integrated into the applications dependency map as well as being illuminated by live performance reports in the Applications Manager dashboard.
Who is it recommended for?
This package is suitable for all types of businesses because it monitors serverless systems and also traditional applications, such as databases, Web servers, and email systems. So, it isn’t just designed for monitoring Web applications, although it does that well. A Free edition will monitor five assets but it doesn’t cover Web applications.
Pros:
- Deployment Options: Installs on Windows Server, Linux, AWS, or Azure
- Predicts Upcoming Resource Requirements: Based on the dependency map
- Log Monitoring: Track metrics like memory usage, disk IO, and cache status
- Detects Application Types: Databases, web servers, etc
Cons:
- No SaaS Option: The cloud-hosting opportunity has to be installed on your own account
Applications Manager is on-premises software that installs on Windows Server and Linux. It is offered in three editions: Free, Professional, and Enterprise. The Free edition is limited to five monitors. The Professional version is suitable for monitoring a single site and the Enterprise edition is designed for large, multi-site businesses. You can try Applications Manager on a 30-day free trial.
3. Site24x7 (FREE TRIAL)

Site24x7 APM is a cloud-based application performance monitoring service that has distributed tracing capabilities to track the actions of serverless systems. It is able to trace the activity of modules written in Java, .NET, and Node.js. However, Site24x7 doesn’t publicize which telemetry standards it implements.
Key Features:
- Compatible with the Major Serverless Platforms: AWS Lambda, GCP Functions, Azure Functions
- Distributed Tracing: Records events in functions as they run
- Code Profiling: Steps through text-based scripts
Why do we recommend it?
Site24x7 provides plans that cover every layer of the stack from networks up to real user monitoring. Its APM features deal with serverless systems. It can extract metrics from AWS Lambda, Azure Functions, and GCP Functions. The package includes distributed tracing for microservices and its code profiler will work with Java, Node.js, PHP, Python, and .NET.
The APM drills through applications, mobile apps, and websites looking into its APIs for serverless systems to track. Site24x7 links together all application processes and so its distributed tracing effort gets plugged into the application dependency maps that it plots for all regular applications.
Live operating statuses of each module that contributes to the delivery of an API request get shown on a screen in the Site24x7 dashboard. The dashboard shows the entire serverless process from start to finish, segmenting the service into individual modules. You see overall processing times and then the time that each module in the chain tool. You can drill down on each node in the graphic to get more details on a specific process.
Who is it recommended for?
The Site24x7 is appealing to all sizes of businesses and it doesn’t just cater to Web application managers because it has very wide capabilities for IT asset monitoring. All of the plans are sized and priced for small businesses with expansion rates that give capacity that is suitable for mid-sized and large companies.
Pros:
- Full Stack Observability: Monitors networks, infrastructure, and real user monitoring
- Asset Discovery: Records and maps all IT assets
- Real User Monitoring: Records events during real sessions
Cons:
- Advertised Prices are for the Smallest Implementations: Larger businesses pay a lot more
Site24x7 is charged for on a subscription with a base package that can be augmented with add-ons. The standard package includes the ability to track three applications that call serverless functions. However, you can increase that number for a fee. The plan also gives you credits to run monitoring on 40 servers or websites. Site24x7 APM is available for a 30-day free trial.
4. Datadog APM
Datadog APM is a cloud-based application performance monitor that has very strong distributed tracing services. There are two major messaging standards for distributed tracing. If the developer of a microservice uses one of these, it knows to issue status messages in a specific format. Monitors that follow the same standards. Those protocols are called OpenTracing and OpenTelemetry and Datadog APM uses both.
Key Features:
- Major Serverless Platforms: AWS Lambda, Azure Functions, and Google Cloud Functions
- Distributed Tracing: Records the performance of microservices
- Code Profiling: For text-based web languages
Why do we recommend it?
Datadog APM provides Web application monitoring for microservices with distributed tracing and code profiling. The platform also has a continuous testing unit that focuses on Web applications. Datadog is expanding all the time and the company now also offers a Serverless Monitoring package, which is more relevant to the topic of this review than the APM.
The ability of Datadog APM to process both of these telemetry standards greatly increases the likelihood that it will be able to track any serverless system that it encounters. In truth, the developers of microservices don’t really bother with any other logging standard but these two.
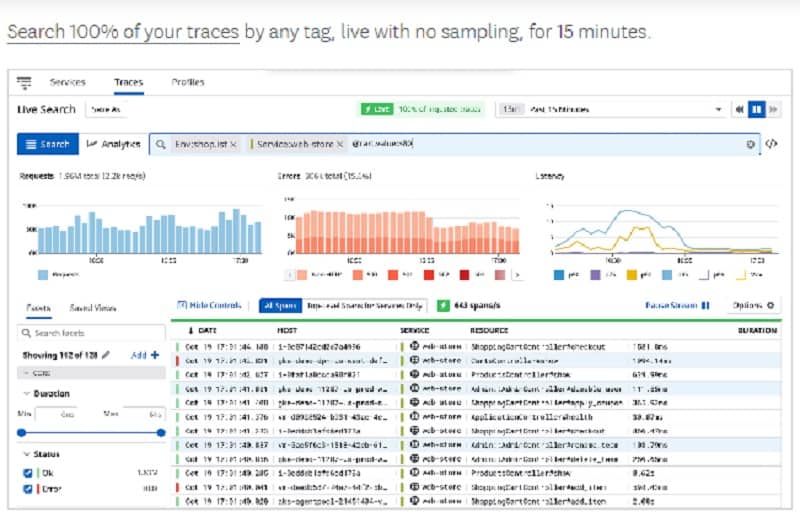
As it monitors serverless systems, Datadog generates its own reporting comments as well as catching these log messages that come out of the service. So, it has two levels of performance reporting. Datadog can also work with built-in AWS platform status reports that track the activities of their serverless object running in Lambda accounts.
With source data secured, Datadog is able to represent live performance data in the system dashboard to the same quality that it provides for all of its other monitoring services. It shows the connections between microservices in a hierarchy as they operate. This is very similar to the application dependency maps that it produces for applications and is called a Service Map.
The Service Map is clickable and each node gives access to a detail page with live reports of the operations of that particular microservice.
Datadog APM goes the extra mile to gather as much data as possible on serverless systems as they operate. The monitor is programmed to understand the two major messaging systems used by microservices for activity logging and it adds on its own external performance assessments to enhance reporting.
Who is it recommended for?
If you work with Web applications, you will need the APM. You should also subscribe to the Serverless Monitoring unit and getting the Infrastructure Monitoring service will get you access to the Integrations library, which provides you with monitoring capabilities for a wide range of technologies.
Pros:
- Cloud-Based SaaS Product: Allows monitoring with no server deployments or onboarding costs
- Autodiscovery: Creates an application dependency map
- A Platform of Services: Combine the APM with infrastructure and network monitoring
Cons:
- No On-Premises Version: Only available as a SaaS package
Datadog APM is a cloud-based subscription service and it is available for a free trial.
5. New Relic Serverless Monitoring
The New Relic Telemetry Data Platform is particularly useful for DevOps scenarios. The platform includes both the processor to run the code and the monitoring software plus a large amount of cloud storage space to retain all of the performance data that the New Relic monitor gathers.
Key Features:
- OpenTelemetry, OpenTracing, OpenCensus, and Zipkin: Distributed tracing
- Monitors Major Serverless Platforms: AWS Lambda, Azure Functions, Google Cloud Functions
- Full Stack Observability: From networks, through servers and cloud platforms, through to application and front-end responses
Why do we recommend it?
New Relic has changed a lot recently. It has expanded from a Web application monitoring tool to being a very broad observability service. The platform includes 16 modules that cover all levels of the stack and it includes a Serverless Monitoring unit that extracts metrics from AWS Lambda, Azure Functions, and Google Cloud Functions.
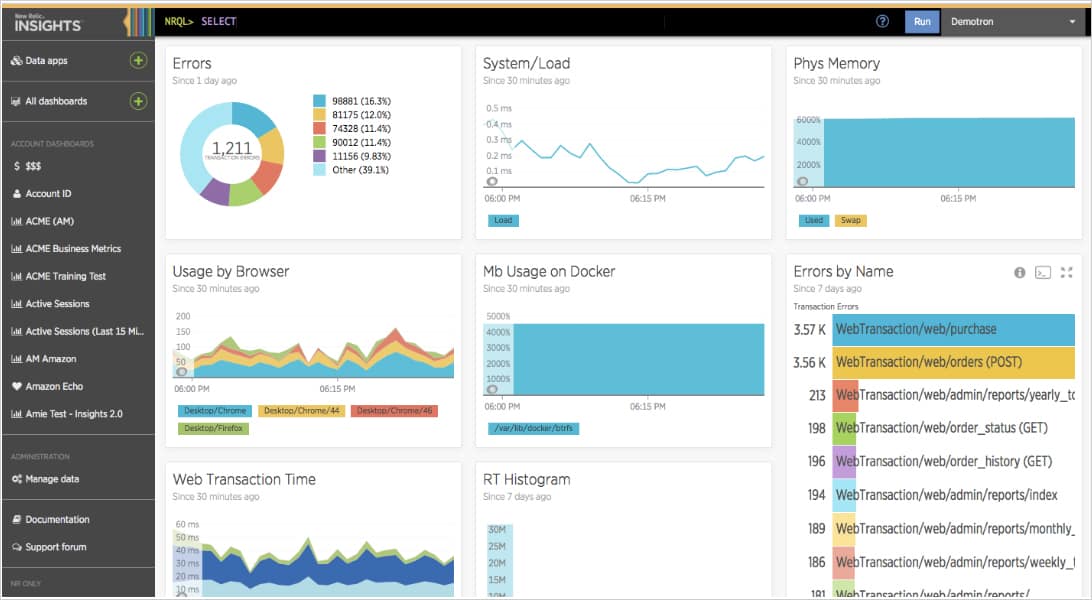
In addition to the actual tracing capabilities, the New Relic system includes tools that aid in the analysis of all of those performance logs that get gathered and it also shows all operational data live on the screens of its dashboard as it arrives.
New Relic has very broad capabilities when it comes to receiving and processing the log messages that are sent out by microservices. It can understand OpenTelemetry, OpenTracing, OpenCensus, and Zipkin. Those log messages are pooled with application event messages and New Relic’s own performance logging records to complete a multi-dimensional view of serverless system performance.
As well as using telemetry data, New Relic can receive platform messages, such as AWS tracing of Lambda-based services, Azure, Apache, and operating system log messages.
While it can’t put agents on the hosts of the serverless systems, it can insert tracing code into the websites that run APIs calling those services. The monitor also gathers connections statistics to complete the performance picture.
Who is it recommended for?
The expansion of the New Relic platform creates a lot more functionality and buyers now have one source that provides all of the monitoring tools that they need. The downside of this strategy is that you can’t subscribe to just one, or just a few modules. You pay for the whole bundle, whether you need them or not.
Pros:
- Certified for Microsoft Azure Monitoring: Also monitors AWS and GCP
- Uses Anomaly Detection: Highlights abnormal behavior
- Free Tier: Every customer gets the first 100GB of data processing for free each month
Cons:
- All-in-One Platform: This platform has many modules but you can’t subscribe to just one or two of them, you have to take them all
The first 100GB of data per month processed by the New Relic Telemetry Data Platform is free. Each GB after that costs 25 cents.
6. Dynatrace
Dynatrace is a cloud-based application and services monitor that uses AI processes and task automation in the delivery of its services.
Key Features:
- All the Major Serverless Platforms: AWS Lambda, Azure Functions, Google Cloud Functions
- AI-Based Resource Demand Predictions: Alerts on resource shortages before they happen
- Cold Start Measurements: Records delivery delays
Why do we recommend it?
Dynatrace provides integrations with the operating systems for AWS, Azure, and GCP to extract metrics directly from the systems that manage serverless accounts. The constant management of resources can help towards cloud cost management as well as performance monitoring. Issues such as cold starts and delivery mechanisms can also be tracked.
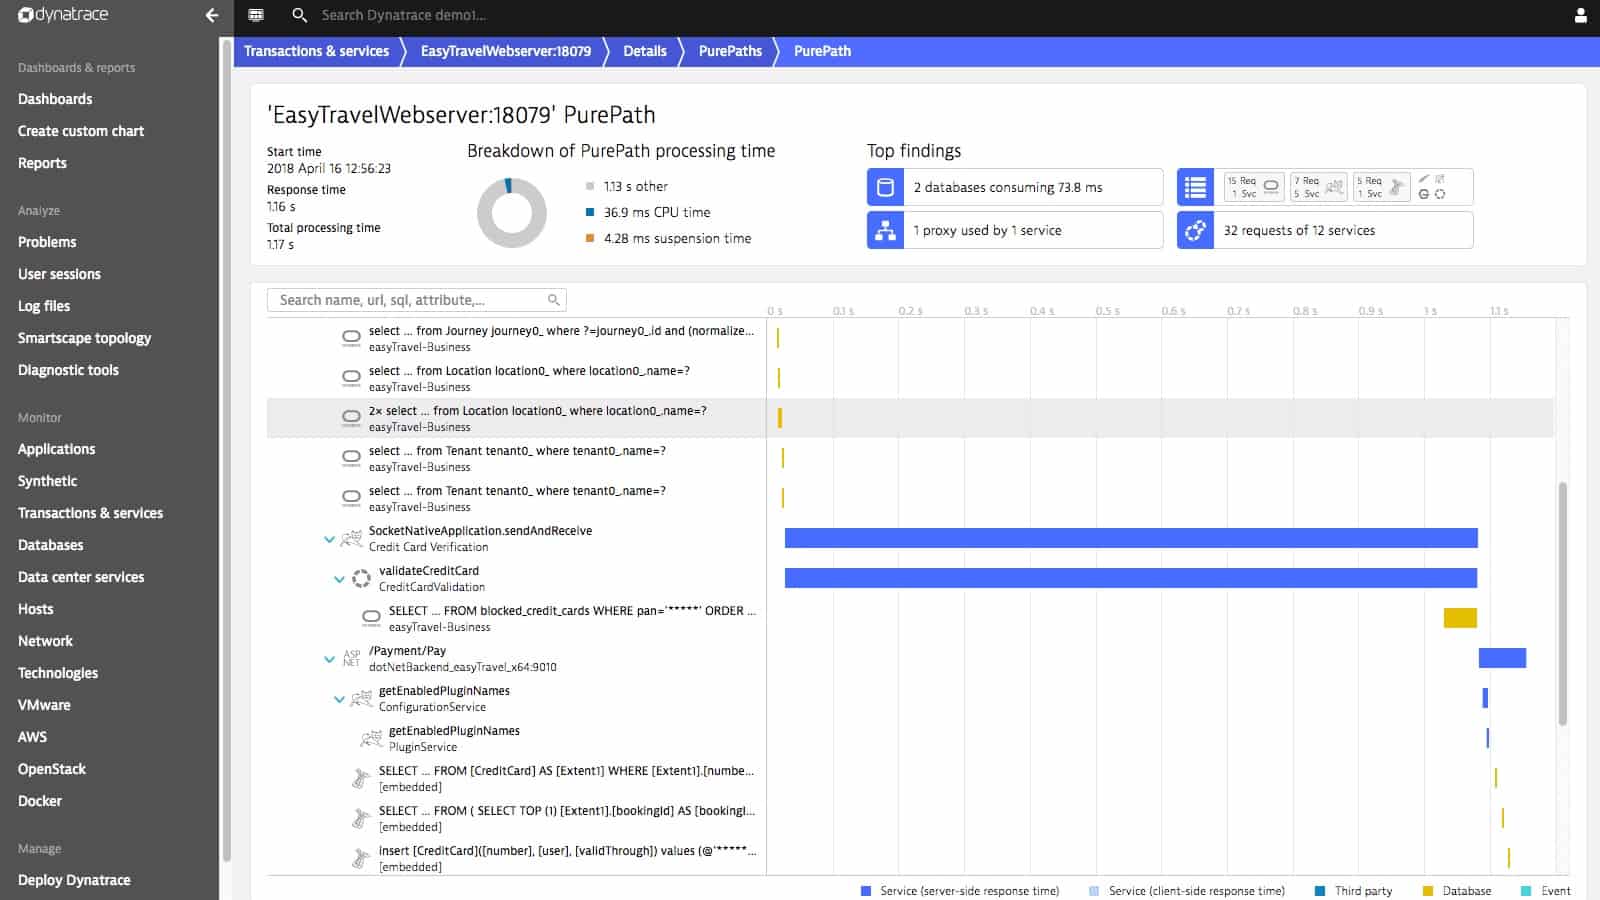
The Dynatrace system is able to collect activity messages from microservices by using the OpenTelemetry protocol. These messages add to a pool of performance data that Dynatrace receives from the Web pages and applications that call the serverless functions. It also picks up the operating system and Web server messages.
All of the performance data for serverless systems needs to be collated and sorted quickly so that it can be posted to the dashboard as performance reports as soon as possible. This great data analysis effort is a field in which Dynatrace excels and it is one of those areas to which the monitor apples AI technology.
Who is it recommended for?
This is a cloud-based service and it can track connections to server-based applications such as databases, identifying the requirements of those other systems simultaneously. This tool is also able to monitor your on-premises systems as well, so it provides full-stack monitoring for hybrid environments.
Pros:
- End-to-End Analysis: Tracks as control passes from one function to another
- Operates in the Cloud: You don’t need to worry whether you have the right operating system to host it
- Consolidates Demand from Processes that are Running Simultaneously: Doesn’t examine each function in isolation
Cons:
- Designed Specifically for Large Systems: Smaller organizations may find the product overwhelming
Dynatrace can be used for development as well as for operations monitoring. The distributed tracing capabilities of the platform are available in the Full-stack Monitoring bundle. You can get a look at Dynatrace’s telemetry services on a 15-day free trial.
7. ServiceNow Cloud Observability

ServiceNow Cloud Observability is a new product from ServiceNow, created by the purchase of Lighstep. The Lightstep service was started up by one of the lead developers on the Google Dapper project. Dapper was Google’s in-house telemetry system, which it then released as an open standard.
Key Features:
- OpenTelemetry: For distributed tracing
- Cloud Platform Monitoring: Looks at serverless products
- Container Monitoring: Delivery mechanisms
Why do we recommend it?
ServiceNow Cloud Observability is an OpenTelemetry platform and supports the creation of web applications that need to have signals built into them for OpenTelemetry logging. So, this tool will create statistics for monitoring and also provide a mechanism to gather that data along with information about cloud platform and container performance.
When Dapper became a public system, it was renamed OpenCensus. Now OpenCensus has merged with OpenTracing to form OpenTelemetry – the leading distributed tracing communication and reporting standard. So, the protocol that most of the other serverless monitoring tools use was created by the founder of Lightstep.
It goes without saying that Cloud Observability is very good at distributed tracing for serverless system monitoring. The one point against this tool is that it doesn’t integrate telemetry results in with other forms of monitoring in the way that the other tools on this list can.
The ServiceNow system is a cloud-based service and a key element in its dashboard is the Operational Diagram that it draws up for the serverless systems that it tracks. This is a hierarchy of each contributing module. Each node in the diagram is a link through to a details page for that particular module.
Who is it recommended for?
This package addresses two audiences with its three plans. The creators of Web applications will need the community edition, which is free. This supports the insertion of OpenTelemetry signals inside the code of an application. Teams that monitor Web applications will need one of the two top editions. This supports the gathering of OpenTelemetry signals along with metrics from serverless accounts and containers.
Pros:
- Manages Traces: Files and indexes traces, presenting a library for analysis
- Sysadmins can Easily Sort Through Traces: List them by operation, date, and source
- Detects Microservice Dependencies: Build up a map of an application’s components
Cons:
- ServiceNow Discontinued the Free Edition: Doesn’t publish prices for its plans
Lightstep is a subscription service and it is available in three editions: Community, Pro, and Enterprise. The Community edition is free to use and the Pro version is available on a 14-day free trial.
