As organisations store growing volumes of data across increasingly complex environments, ensuring storage systems remain stable, efficient, and secure becomes a priority. Storage monitoring tools help IT teams maintain control by providing continuous oversight of storage performance, capacity, and overall system health.
These tools are used across on-premises, cloud, and hybrid environments to support reliable storage operations and reduce the risk of disruption. They track key indicators such as disk usage, input/output performance, network activity, and system status, helping teams understand how storage resources are being used and where pressure is building.
By highlighting early signs of performance degradation or capacity strain, storage monitoring tools help organisations address issues before they escalate into outages or data loss. They also support more efficient resource use by identifying underutilised storage and potential bottlenecks.
Here is our list of the best storage management and monitoring tools:
- ManageEngine OpManager EDITOR’S CHOICE This package monitors networks and servers, which includes storage systems and load balancers for arrays. Available for Windows Server, Linux, AWS, and Azure. Start a 30-day free trial.
- Site24x7 (FREE TRIAL) This cloud platform is delivered as packages of specialist monitors, such as its storage server monitoring service.Start a 30-day free trial.
- Paessler PRTG (FREE TRIAL) This bundle of sensors will monitor networks, servers, and applications, and it includes specialized processes for watching over storage arrays. Installs on Windows Server. Start a 30-day free trial.
- IntelliMagic Vision for SAN A monitoring package that watches over storage arrays and the systems that distribute workload between individual units. This system runs as a virtual appliance.
- SolarWinds Storage Resource Monitor This package has many integrations for specific brands and models of storage systems and also provides capacity planning support. Runs on Windows Server.
- Nagios Free and paid versions of this system both provide full-stack monitoring with plug-ins for complicated storage infrastructure. Runs on Linux, Docker, or virtualizations.
- AppDynamics This SaaS package is designed to watch over applications and the infrastructure that supports them, which includes storage systems.
- Checkmk This observability package includes storage system monitoring that can be refined with plug-ins. With free and paid versions, this platform is available for Linux or as a virtual appliance.
In larger environments, where multiple storage systems and vendors are involved, manual oversight becomes increasingly difficult. Automated monitoring tools help unify this complexity by consolidating data into a single view, making it easier to compare performance across different systems and technologies.
Centralised dashboards, automated reporting, and deeper analytical capabilities further support operational efficiency, helping teams make informed, data-driven decisions about storage management.
This guide will examine some of the best storage monitoring tools available, comparing their features, benefits, and how they can help ensure storage infrastructure remains reliable, secure, and optimised. Whether managing a small setup or a large enterprise environment, these tools play a key role in maintaining data availability and performance.
Our methodology for selecting storage monitoring tools
We reviewed the market for storage monitoring systems and analyzed the options based on the following criteria:
- Monitoring for individual servers, storage arrays, workstation disks, and USB drives
- Systems that can monitor on-premises and cloud storage systems
- Automated notifications with alerts
- Data throughput rate recording
- Root cause analysis
- A free trial or a demo system that provides a pre-purchase assessment opportunity
- Value for money from a monitoring service pays for itself by averting business-damaging failure
The following sections provide greater details of the best packages to monitor storage facilities.
1. ManageEngine OpManager (FREE TRIAL)

Key Features:
- Network and server monitoring
- SAN monitoring
- Root cause analysis
Array monitoring extends to switch activity tracking and IOPS performance. This system can monitor RAID storage performance and even tape libraries and the devices that access them. With all types of storage devices, the tool provides long-term asset management as well as minute-by-minute configuration and throughput information.
Capacity planning systems in the ManageEngine package operate immediately as part of live monitoring and are also available for long-term planning assistance. This system provides templates for specific hardware, so the live monitoring and capacity planning are conducted precisely according to the quirks of a particular storage solution.
Pros:
- Provides consolidated overviews of all storage activity
- Alerts for gathering problems
- Capacity planning both short and long term
Cons:
- No SaaS option
ManageEngine provides four editions for OpManager. The first is Free but it is limited to monitoring three devices. The three paid editions provide options for some application monitoring and a version that can monitor networks and servers on multiple sites. This software installs on Windows Server, Linux, AWS, and Azure and you can examine it with a 30-day free trial.
EDITOR'S CHOICE
ManageEngine OpManager is our top pick for a storage monitoring tool because it gives IT teams comprehensive insights into storage health, utilization, and performance across networked environments. Known for its user-friendly interface, OpManager offers real-time monitoring for storage devices, SAN, and NAS systems, tracking critical parameters like disk usage, read/write latency, IOPS, and throughput. This enables IT administrators to proactively identify potential bottlenecks, optimize resource usage, and ensure continuous availability of storage resources. OpManager’s customizable dashboards and alerting systems are particularly useful for storage monitoring, allowing users to configure thresholds and receive instant notifications for any issues, such as low disk space or high latency. This proactive alerting helps in quick troubleshooting and prevents downtime, which is critical for businesses relying on high-performance storage environments. It also provides trend analysis and capacity planning, helping teams predict future storage needs and budget accordingly.
Download: Get a 30-day free trial
Official Site: https://www.manageengine.com/network-monitoring/download.html
OS: Windows Server, Linux, AWS, and Azure
2. Site24x7 (FREE TRIAL)

Site24x7 is a SaaS system, which makes it a rival to AppDynamics for businesses that prefer cloud services. However, the perspective that this system takes makes it much more like the on-premises monitoring tools in this review. It provides plans that include full-stack monitoring. You get network, server, application, and even website monitoring tools in these packages.
Key Features:
- Full stack monitoring
- Application dependency mapping
- Multi-site observability
The Site24x7 package can monitor cloud servers as well as on-premises systems. This extends to storage services as well as computing systems. This means that the tool can also track activities across platforms for hybrid systems. The storage monitoring element in the Site24x7 package can watch over NAS, SAN, RAID, and tape configurations as well as regular storage servers.
Pros:
- Monitors storage servers alongside network and application activity
- Specialized server cluster monitoring
- Multi-platform service mapping
Cons:
- No on-premises version
Site24x7 is available for a 30-day free trial.
3. Paessler PRTG (FREE TRIAL)

Paessler PRTG is a package of monitoring services. Each monitor is called a sensor and the buyer decides which of the available sensors to activate. This enables each implementation to be customized. The sensors in the PRTG package provide monitoring for networks, servers, and applications. There are sensors available specifically to monitor storage devices.
Key Features:
- Full stack monitoring
- Server monitoring
- SAN monitoring
The package will identify a network by noting all the devices connected to it. This creates an IT asset inventory and also a network topology map. These two information sources provide the basis of all system monitoring efforts, including storage monitoring. Regular servers are monitored for activity, noting storage space availability and utilization as well as throughput metrics.
SAN arrays require specialized monitoring routines because they involve load balancers as well as individual storage devices. This is the reason there is a specific sensor for SAN monitoring. This tool provides live monitoring for throughput and storage capacity. It tracks both hardware statuses and programmatic efficiency.
Pros:
- Alerts for performance problems
- Capacity availability tracking
- Connection tracking for root cause analysis
Cons:
- Not strong on forecasting
Paessler delivers PRTG as a software package for installation on Windows Server. There is also a hosted version, which is a SaaS platform. You buy an allowance of sensors with the smallest package giving you 500 of them. If you only activate 100 sensors, you never have to pay for the system. You can get a 30-day free trial with all sensors activated.
4. IntelliMagic Vision for SAN

IntelliMagic Vision for SAN is a monitoring system that can examine the performance of Storage-Attached Networks (SANs). This category of the storage system is complicated because it involves an array of servers that are fronted by a load balancer. So, these storage systems require many more levels of monitoring than conventional storage servers and drives.
Key Features:
- Monitors IOPS
- Tracks capacity
- Alerts for shortages
- Response time recording
- AI-adjusted thresholds
This monitoring package looks at the configuration of the storage array and makes sure that load is being distributed evenly. This monitor judges acceptable response times and will adjust its matrix of performance expectations by using a machine learning system. These automatically adjusted thresholds reduce the number of alerts that are generated. These are forwarded to technicians as notifications.
The alerting system means that technicians don’t have to watch over storage systems because they can assume that everything is working well unless they receive a notification. Performance thresholds are set at levels that enable technicians enough time to fix problems rather than waiting until the problems are critical.
Pros:
- Specializes in complicated storage system configurations
- Provides storage demand predictions
- Identifies requirements for extra capacity to the day
- Examine load balancing
- Provides response time analysis
Cons:
- Operates for on-premises storage and not cloud systems
IntelliMagic Vision for SAN operates as a virtual appliance and it is available for a 30-day free trial.
5. SolarWinds Storage Resource Monitor

SolarWinds Storage Resource Monitor is an on-premises system that provides specialized monitoring capabilities for a list of storage types and brands. The system isn’t restricted to one type of storage system, so you can activate several integrations if you operate a multi-vendor storage environment. For example, you could use this package to monitor a NetApp FAS, a Synology DiskStation NAS, and a Dell EqualLogic SAN simultaneously.
Key Features:
- Multi-vendor
- Tailored monitoring per storage type
- Activity tracking
- Capacity planning
Live performance tracking presents key metrics in a summary view with drill-down paths to enable each installation and then each unit. If a problem is detected, the SolarWinds system generates an alert. These alerts are shown on a screen in the console and it is possible to route a notification for each type of error to one or many technicians.
The SolarWinds Storage Resource Monitor also provides capacity demand predictions which are available in both a short-term format to warn technicians to take action and in a longer-term analysis that informs the business of future purchasing requirements to keep up with demand.
Pros:
- Monitors individual storage devices
- Tracks the performance of NAS and SAN arrays
- Provides consolidated overviews and drill-down details
- Short-term and long-term capacity demand forecasting
Cons:
- No cloud version
SolarWinds Storage Resource Monitor runs on Windows Server and you can get it on a 30-day free trial.
6. Nagios

Nagios is a full-stack observability package offering network, server, and application monitoring systems. This is an on-premises package, so you don’t have a SaaS option with Nagios. However, you do have the option of whether you want to pay or not because there is a free version available.
Key Features:
- Full stack monitoring
- Extensible with plug-ins
- Specialized storage monitoring
The free version of this package is called Nagios Core. The big problem with this option is that it doesn’t have a proper front end – you would need to pair it up with another system, such as Kibana. The paid version has a very good console, and it is called Nagios XI. Both versions of Nagios provide server monitoring that tracks capacity utilization, and both accept plug-ins.
The plug-in library is called Nagios Exchange and it is vast. For example, there are 30 plug-ins available for monitoring NetApp storage systems. You can choose a selection of plug-ins to provide monitoring capabilities for the exact brands and models of storage systems that you have.
Pros:
- Monitors networks, applications, and servers
- Plug-ins for storage monitoring
- Alerts for performance problems
Cons:
- The free version doesn’t have a user interface
You can download Nagios Core for free. This package was written for Linux and will also run on top of Docker, Hyper-V, and VMware, which helps you if you only have Windows computers. Nagios XI runs on the same systems, and you can get it on a 30-day free trial.
7. AppDynamics

AppDynamics is primarily an application performance monitoring service. However, it also provides infrastructure monitoring, which goes down to server resource tracking. This tool provides a unique perspective because it examines application activity as its main view of a system. So, its monitoring screens in the console show how applications are performing across infrastructure, rather than examining each piece of hardware individually.
Key Features:
- Application-centric
- SaaS package
- Performance analysis
The application focus of AppDynamics means that storage systems are examined more for transaction performance than hardware statuses. However, information on hardware capabilities is there in drill-down views. The tool is concerned with constantly identifying the connections between services and a, which provides a constantly prepared root cause analysis that can be accessed as soon as problems arise.
An alert from AppDynamics provides immediate reports on the reasons for the identified problem. This enables a very rapid resolution of performance issues. However, it does mean that the capacity planning and device examinations that other monitoring systems on this list provide are less prominent in the AppDynamics package.
Pros:
- Application dependency mapping
- Immediate root cause analysis
- Not bound by a specific network
Cons:
- Not strong on capacity planning
As it is a SaaS package, AppDynamics doesn’t run on your site and so isn’t restricted to one site. It tracks applications and resources all over the world if necessary. There isn’t a download for this system, but you can activate a 15-day free trial at the AppDynamics website.
8. Checkmk
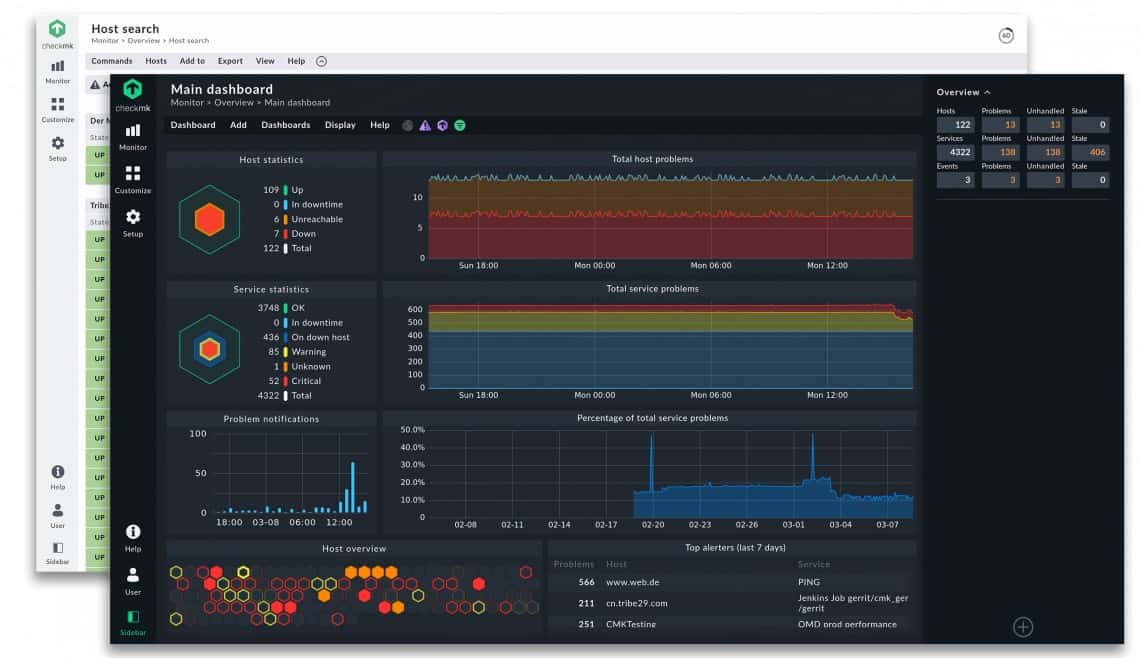
Checkmk is available in free and paid versions, and it can be deployed on-premises or taken as a SaaS subscription. This monitoring service provides network, server, and application monitoring, and it can track the activities of array-based storage configurations.
Key Features:
- Hybrid systems
- Cross-platform monitoring
- Multi-vendor environments
The storage monitoring capabilities of Checkmk include SAN performance tracking and cloud storage system monitoring, for example, for AWS S3 accounts. There are two versions of Checkmk, which are Checkmk Raw, a free, open-source package, and Checkmk Enterprise, which also has a free edition.
Pros:
- Monitors networks, applications, and servers simultaneously
- Provides alerts for performance problems or resource shortages
- Links together infrastructure services across platforms
Cons:
- The choice of different versions can be confusing
Both versions of Checkmk are written for Linux and can also be installed over Docker or run as virtual appliances. You can download Checkmk Raw for free. Checkmk Enterprise has a Free edition, which is limited to monitoring 25 hosts. The full package of Checkmk Enterprise is available for a 30-day free trial.
