
Zabbix is an enterprise-class, open-source distributed monitoring solution designed to monitor and track performance and availability of IT infrastructure including networks, servers, applications, virtual machines (VMs), and cloud services.
Zabbix monitors and provides reports on key performance metrics such as network utilization, CPU load, and disk space consumption; it enables users to collect, analyze, visualize, and get notifications regarding impending issues.
Here is our list of the best Zabbix alternatives:
- Atera EDITOR’S CHOICE A package for managed service providers that includes automated system monitoring tools. This is a cloud platform. Access the free trial.
- ManageEngine OpManager (FREE TRIAL) This software package provides network performance monitoring through the deployment of SNMP processes plus other techniques. Available for Windows Server, Linux, AWS, and Azure. Access a 30-day free trial.
- Paessler PRTG Network Monitor (FREE TRIAL) Α network monitoring tool from Paessler GmbH -a German-based company. Start a 30-day free trial.
- Site24x7 (FREE TRIAL) This cloud platform provides network, server, and application monitoring features, making it a major rival to the Zabbix system. Start a 30-day free trial.
- Nagios IT infrastructure monitoring and management software that enables organizations to identify and resolve problems before it gets out of hand.
- Checkmk Οne of the leading tools for IT infrastructure and application monitoring that uses an agentless and agent-based approach to monitor the health of IT infrastructure.
- SolarWinds Network Performance Monitor Α powerful network monitoring tool that helps organizations detect, diagnose, and resolve network performance issues.
- Icinga Α popular enterprise-grade open-source tool for IT infrastructure and application monitoring.
- Observium Α powerful auto-discovering network monitoring platform that provides real-time network and infrastructure monitoring.
- NetXMS Αn enterprise grade multi-platform open-source network management and monitoring tool.
- OpenNMS Αn open-source network management and monitoring tool developed and managed by the OpenNMS Group and a community of developers.
- Pandora FMS All-in-one network monitoring tool that uses an agentless and agent-based approach to monitor the health of IT infrastructure.
Nevertheless, Zabbix is not a one-size-fits-all perfect solution for every organization. The fact that it fits perfectly from a feature and functionality standpoint for one organization does not mean it will fit for another. In addition, Zabbix, just like every other software solution, also has its own challenges and imperfections.
For example, there have been complaints that:
- It requires a steep learning curve, and a significant amount of time and expertise to set up and maintain it.
- It requires a significant amount of system resources compared to other monitoring tools
- If not tuned properly, the database can grow large very quickly and tuning it can be a lot of work.
The best Zabbix Alternatives
If you figured out that Zabbix is not best suited for your environment and you’re considering a suitable alternative, you’ll find lots of them out there from open-source to commercial level. Choosing the right one for your business and budget can be challenging. To help you decide between the countless open-source and commercial IT infrastructure monitoring tools on the market, we’ve put together a list of the best Zabbix alternatives.
Our methodology for selecting a Zabbix alternative
We reviewed the market for system monitors like Zabbix and analyzed the options based on the following criteria:
- An automated network discovery system
- Automatic inventory and network map creation
- Constant updates on infrastructure
- Device status tracking
- Alerts for evolving problems
- A free tool or a paid system with a free trial for a no-obligation assessment
- Value for money represented by a rival to Zabbix that is so good it is worth paying for
Using this set of criteria, we looked for rivals to Zabbix that were worth using. Although there are many monitoring tools that, like Zabbix, are free to use, a lot of them aren’t any good. So, where we have selected a free alternative to Zabbix, it needs to be better than Zabbix. We also included some paid tools because the most important factor for businesses is whether a monitoring tool will pay for itself in quality of service improvements and cost-cutting efficiency.
Hopefully, this will guide you in the process of selecting the right one for your environment.
1. Atera (FREE TRIAL)

Atera is a package of tools that provides a managed service provider (MSP) with all of the tools needed to run the client support business. This includes tools for technicians to use and also systems to manage the business, such as a help desk ticketing system and support team management functions.
Key Features:
- MSP-Focused: Specifically designed to cater to the needs of managed service providers.
- Automation: Streamlines tasks with robust automation features.
- Alert System: Real-time performance alerts to keep technicians informed.
- Comprehensive Management: Offers a suite of tools for efficient system management.
Why do we recommend it?
Atera is a cloud platform with tools that enable the remote monitoring and management of entire IT systems. The package offers maintenance services, such as patch management and script execution as well as monitoring with alerts. You also get a ticketing system for problem, team, and task management.
The Remote Monitoring and Management (RMM) package that is included in Atera includes all of the tools needed to manage a system remotely. This includes monitors for networks, servers, and applications. The package implements some system management services as well, such as patch management.

At the core of the RMM is an alerts system. This sets thresholds on acceptable performance levels for a range of system activity indicators. If one of those thresholds gets crossed, the system generates an alert. The MSP technicians don’t need to sit and watch the monitoring console all of the time because they know that they will be drawn back to the dashboard if a problem starts to evolve. The thresholds are set at levels that give technicians enough to take action and head of noticeable performance impairment.
The features built into the RMM package enable each technician to be responsible for many client systems simultaneously. MSP managers can keep an eye on delivery performance by setting the monitoring package to coordinate with the service level agreements that are connected to their contracts. The system tracks the time that operators spend working for each client site as well, which makes billing a lot easier.
The Atera system is offered in three plans and there are add-on services available as well. These include an automated network discovery and mapping service. The Atera system can be expanded by integrations that interact with third-party tools.
Who is it recommended for?
This platform has two versions: one for IT departments and one for managed service providers. Each version has a number of plans that include different packages of services. The MSP versions offer contracts management tools as well as its RMM system. Pricing per technician makes this platform affordable for all sizes of businesses.
Pros:
- Scalable Design: Its architecture supports servicing multiple clients simultaneously.
- Patch Management: Automates patching to keep systems up-to-date and secure.
- Remote Capabilities: Includes tools for remote access and desktop management.
Cons:
- Mapping Extra: Charges additionally for network topology mapping, adding to the cost.
Atera is a SaaS package, so you don’t need to host the monitoring software on your own servers. It is also possible to extend access to the service out to home-based staff. Pricing starts at $129 per technician. You can get a free trial to assess Atera.
2. ManageEngine OpManager (FREE TRIAL)
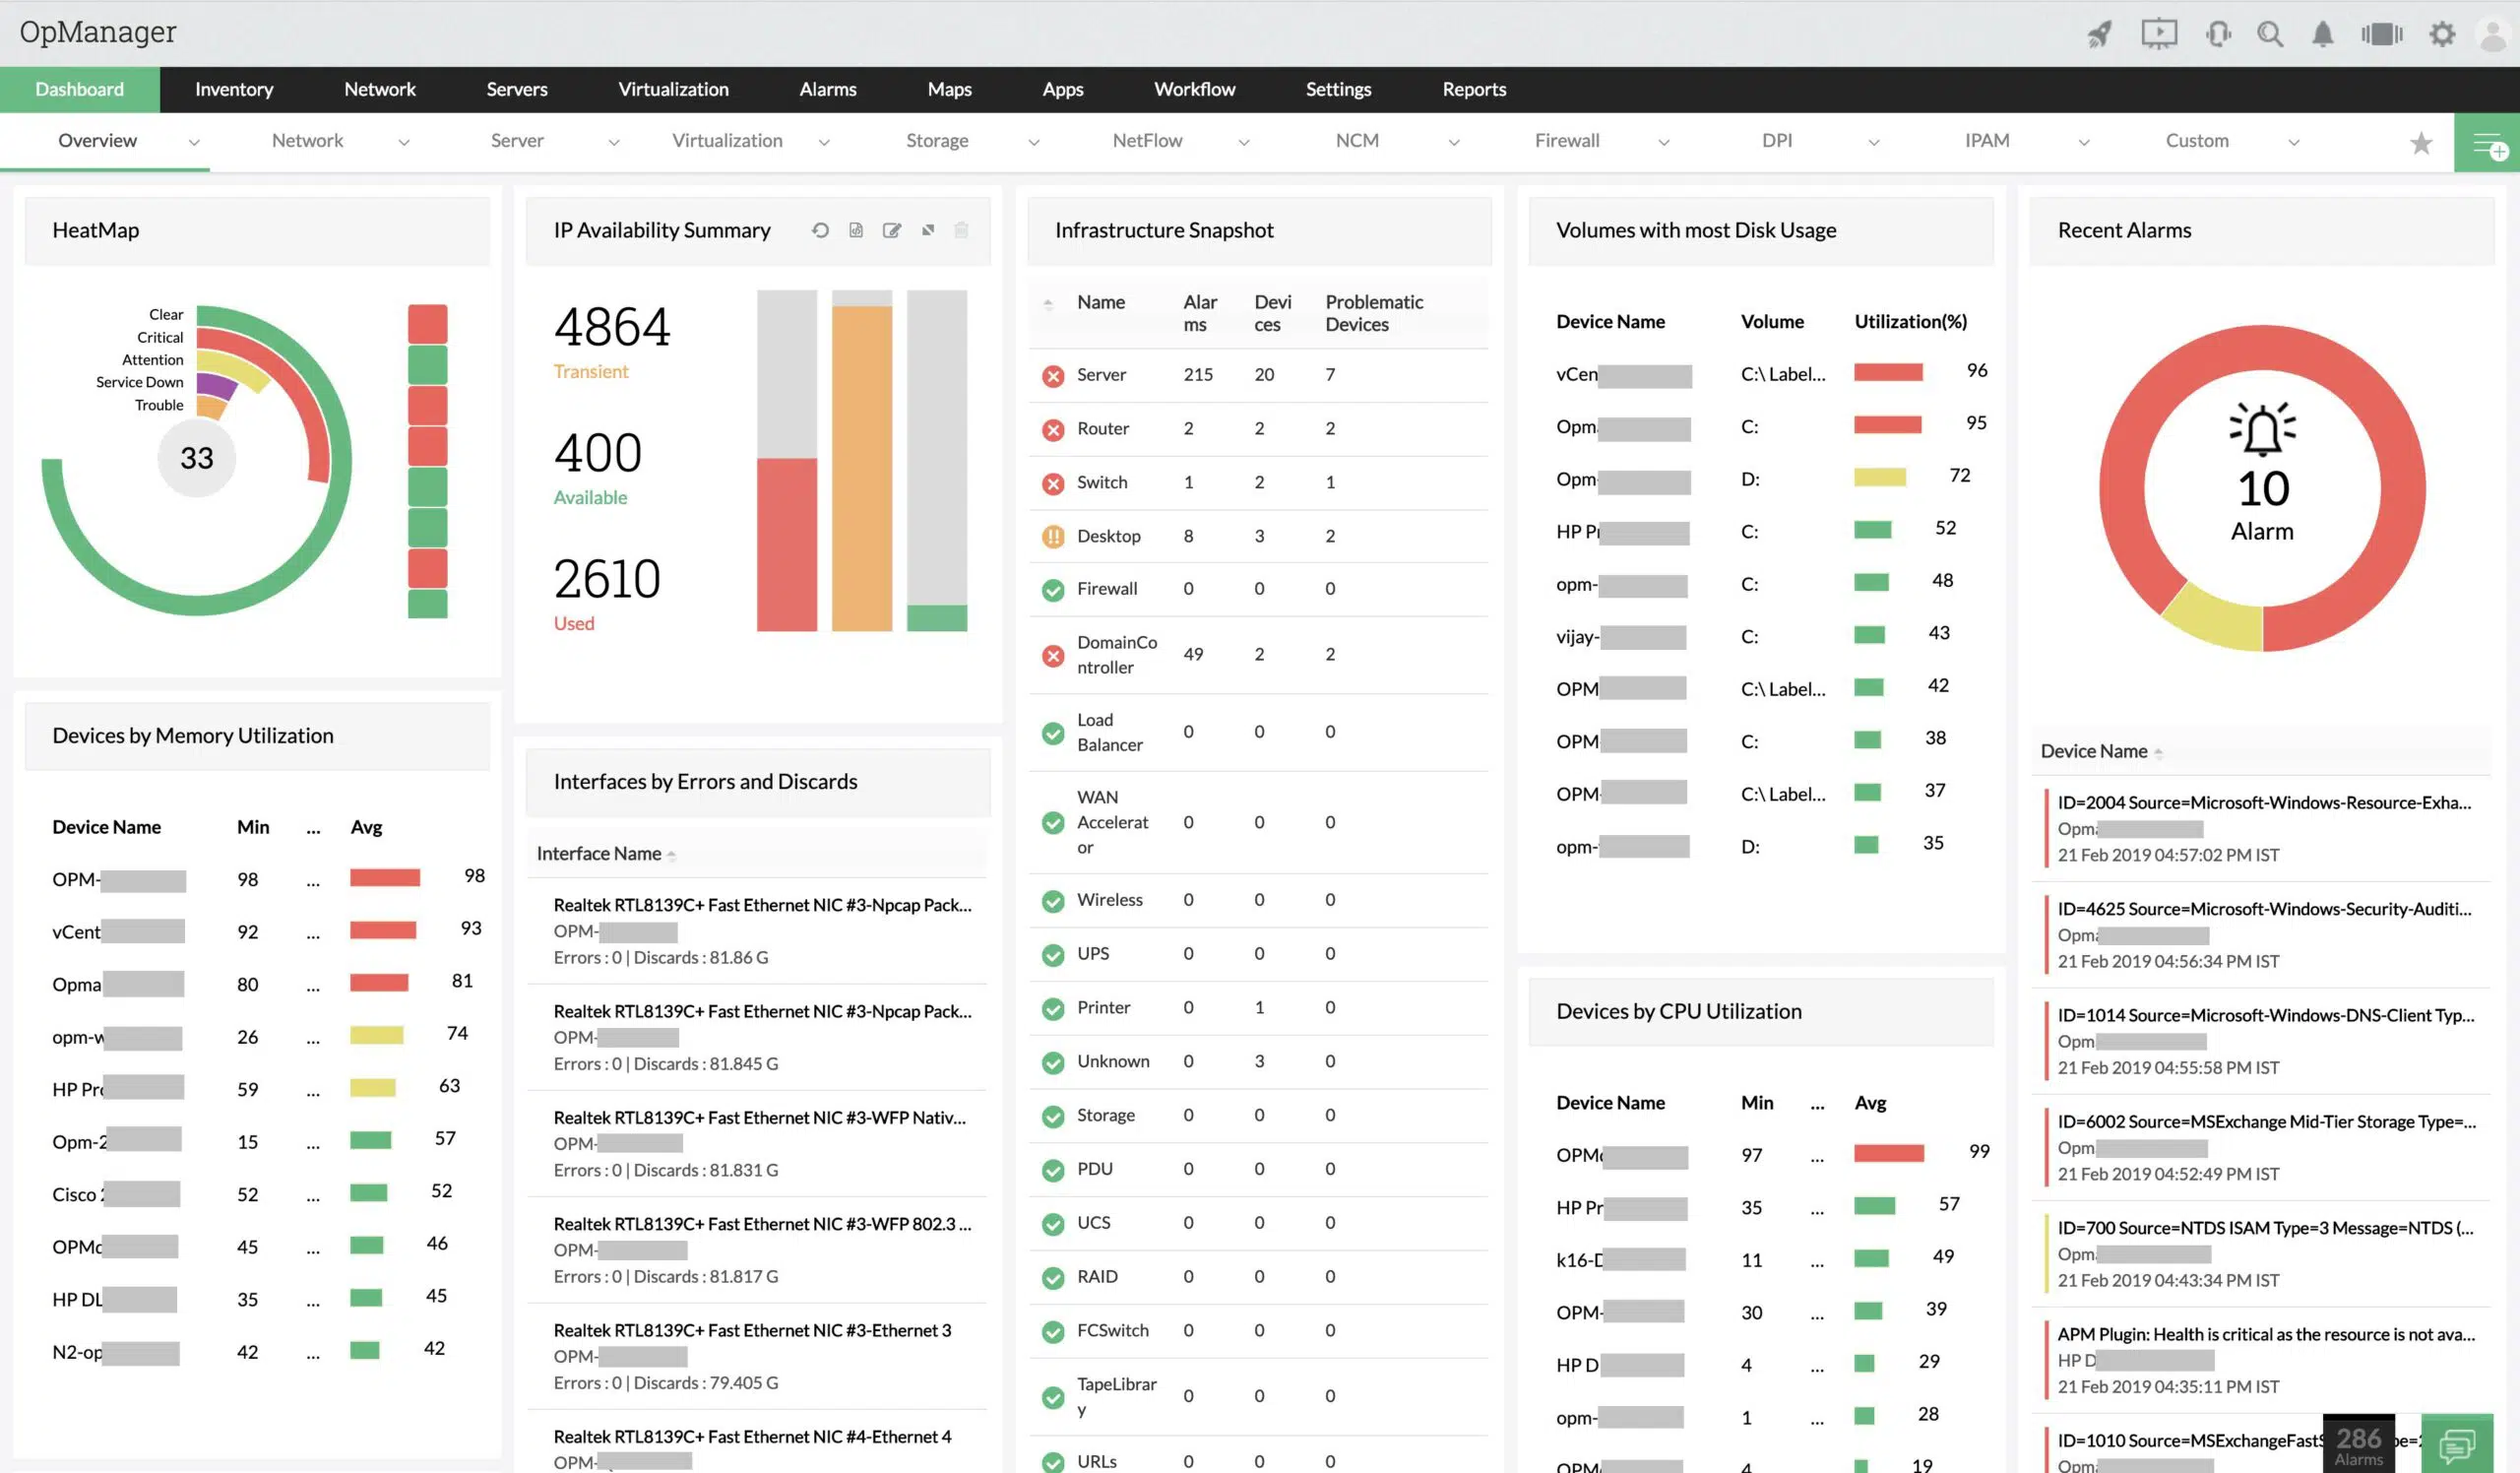
ManageEngine OpManager is a classic network performance monitor that uses the Simple Network Management Protocol (SNMP) to query device agents for status reports. From these reports, the network monitor provides live monitoring services that are displayed in charts, dials, graphs, and lists in the OpManager dashboard.
The OpManager system is able to assemble a network inventory from the SNMP reports. This list of devices gets updated with each poll of device agents. The system can track activity on switches, routers, firewalls, load balancers, endpoints, wireless LAN access points, printers, and storage devices. It is also able to monitor virtualizations.
Key Features:
- Discovery: Automated network discovery for up-to-date inventory.
- Inventory Management: Maintains a constantly updated network device list.
- Mapping Choices: Offers several formats for network visualization.
Why do we recommend it?
ManageEngine OpManager is a monitoring package that covers networks and servers. The system is based on the Simple Network Management Protocol, which enables autodiscovery and inventory compilation. OpManager draws up a network topology map from details in the inventory. The tool provides automated monitoring with alerts.
The tools in the OpManager dashboard include a network topology mapper. This generates network maps on demand from the data listed in the network inventory. As the inventory is constantly checked, the maps always show the current state of the network.

Within the monitor settings, ManageEngine offers a series of performance thresholds. These can be customized by altering their levels. A performance threshold can be placed on any of the metrics that the system tracks. When the network’s metrics cross a threshold, OpManagfer generates an alert. Alerts can be sent to technicians by email, SMS, chat app, or ticketing system.
The OpManager system also monitors the performance of servers. That includes cloud platforms and the network monitoring service will track the performance of internet connections out to those remote services. You can also set up an availability monitor on your URLs.
Analytical tools in the OpManager package include a Traceroute utility and path performance analysis. These systems can be used both for network assessments and for internet connection testing.
Who is it recommended for?
OpManager has a Free edition. However, this is limited to three devices. The lowest paid package is sized to suit small businesses and a higher plan can watch over very large networks. So, this system is suitable for all sizes of networks. The software runs on Windows Server, Linux, AWS, and Azure.
Pros:
- Free Version Available: Provides a no-cost option for small-scale monitoring.
- Intuitive Dashboard: Features a user-friendly interface with clear data visualization.
- Integrated Alerts: Can route performance alerts through various communication channels.
Cons:
- Limited Management Tools: Lacks integrated system management functionalities.
ManageEngine OpManager is a software package for Windows Server and Linux. If you have an account on AWS or Azure, you can access the OpManager system on the Marketplace of that platform. ManageEngine offers a 30-day free trial of OpManager. There is also a Free edition available that offers basic monitoring of three network devices. OpManager is also available in a multi-tenanted configuration for managed service providers.
3. PRTG Network Monitor (FREE TRIAL)

Paessler PRTG Network Monitor is a mature and well-known network monitoring tool from Paessler GmbH, a company based in Germany. There are few tools that provide the blend of maturity and rich capabilities that the PRTG tool provides.
Key Features:
- Comprehensive Monitoring: Tracks networks, servers, and applications.
- Deployment Flexibility: Available on-premises or as a cloud service.
- Network Mapping: Includes tools for detailed network visualization.
Why do we recommend it?
Paessler PRTG Network Monitor provides network, server, and application monitoring. The entire package is based on an autodiscovery function and constant network monitoring that is implemented with SNMP. Autodiscovery, asset inventory creation, and network topology mapping are all included. The PRTG system also offers network traffic analysis.
It comes in different editions and variants such as:
- PRTG Enterprise Monitor—targeted at large networks with thousands of devices and systems across multiple locations.
- PRTG Hosted Monitor—a cloud-based option that allows you to monitor from the cloud
- PRTG Desktop—allows you to manage multiple PRTG servers.
- PRTG Mobile App—allows you to check your network, devices, and sensors while on the go.

PRTG Network Monitor is agentless—which means you do not need to install any agent on the target devices and application, instead it uses network protocols such as SNMP, WMI, NetFlow, or SSH to carry out its monitoring functions. This way, not only is the burden lower, the monitoring is done quickly and easily. Other key features and capabilities include:
- In-depth reporting—runs or schedules regular reports, and gets the statistics of your specific monitoring data.
- Maps and dashboards—visualizes your network using real-time maps with live status information.
- Flexible alerting—supports SMS, email, push notification, and audio alarm.
- Distributed monitoring—monitors several networks in different locations.
- Cluster failover solution—allows failover tolerant monitoring.
- Multiple user interfaces—desktop, mobile, and web.
To install PRTG, you only need a Windows computer with sufficient computing power. In addition, a cloud-based option known as PRTG Hosted Monitor is also available. The PRTG licensing model is based on sensors (parameters that can be monitored on a device such as CPU load, port status, or network traffic) and includes one year of free support and maintenance. Most devices require between five and ten sensors to be fully monitored.
If you are looking for a viable alternative to Zabbix, PRTG Network Monitor is a great option to consider. Unlike PRTG which is much easier to set up and customize; the process for installing Zabbix involves lots of steps, which can be cumbersome for most users.
Who is it recommended for?
This package includes many individual monitoring tools, which are called sensors. You buy an allowance of sensors and then activate only the sensors that you need. Thus, you tailor the monitoring service to just the technologies that you need to track. If you only use 100 sensors the system is free to use.
Pros:
- Customizable: Allows for tailored monitoring with a focus on required sensors.
- Traffic Management: Provides both device monitoring and network traffic analysis.
- Full-Stack Coverage: Offers a wide range of monitoring capabilities across the IT spectrum.
Cons:
- No Patch Management: Lacks built-in tools for software patching and updates.
PRTG is available as freeware for up to 100 sensors. If you want to monitor more than 100 sensors, you will need to upgrade to a commercial version. If you don’t upgrade, the trial version automatically reverts to the free version after 30 days and you can continue using the free version without any time limit. You can register for a free 30-day-trial and test out your network requirements.
4. Site24x7 (FREE TRIAL)
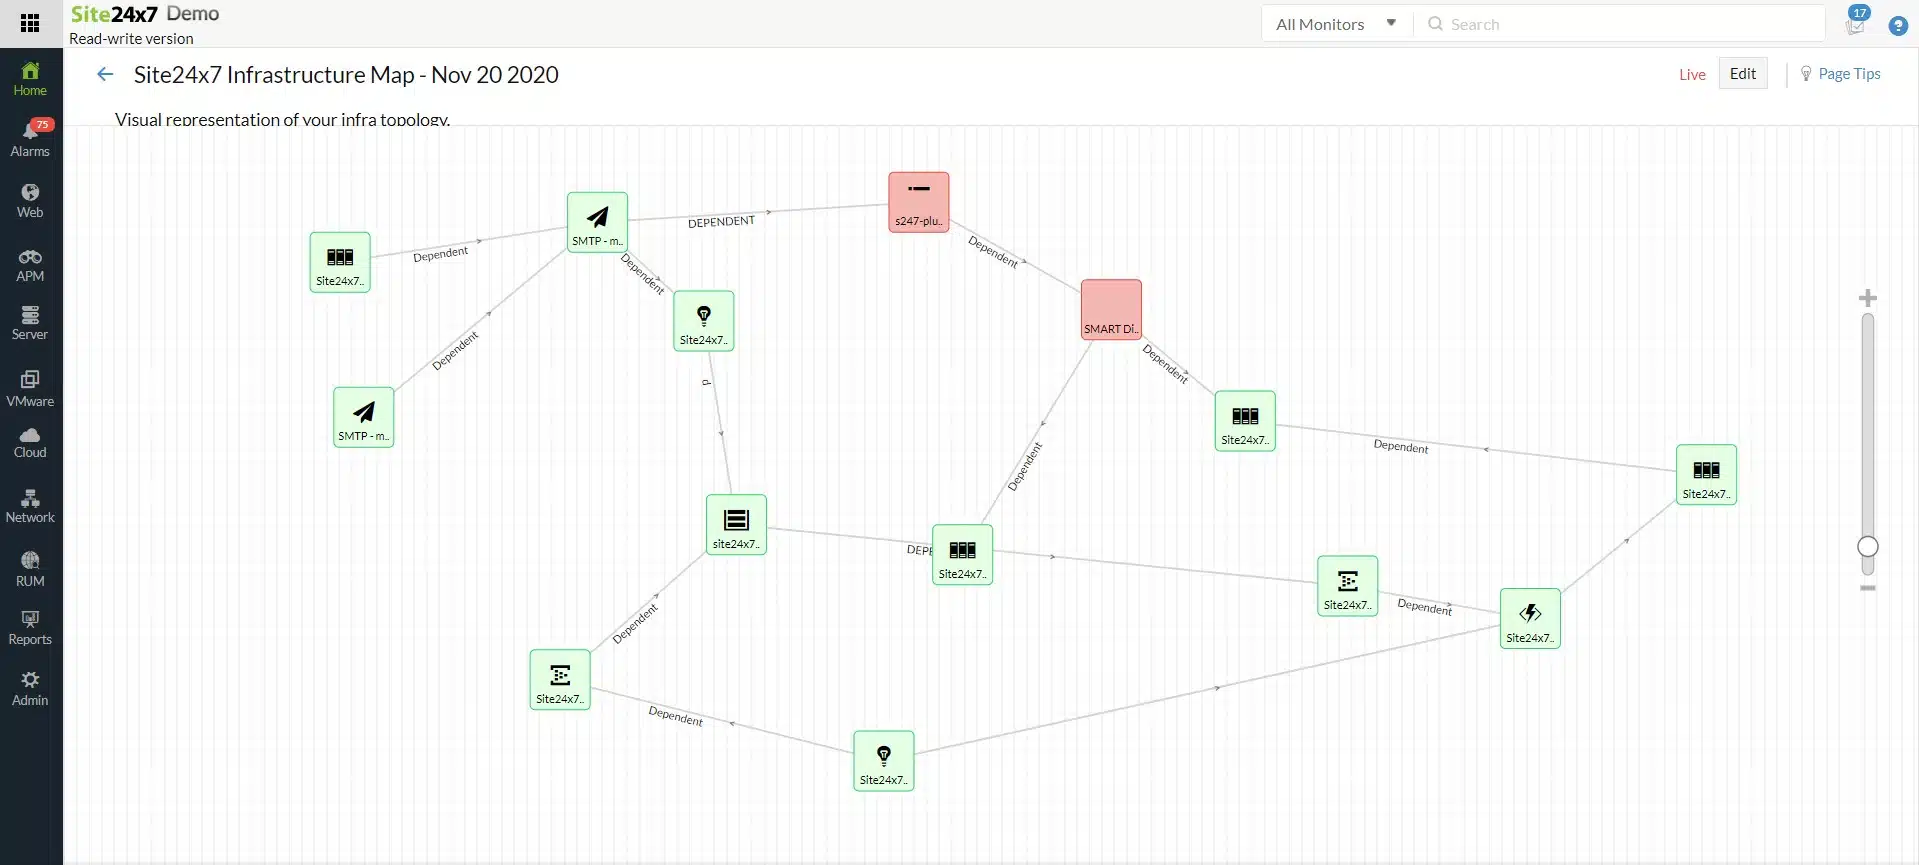
Site24x7 is a cloud-based SaaS platform that provides monitoring for networks, servers, and applications. This service also offers synthetic monitoring and real user monitoring for websites and it can track Web applications with distributed tracing and code profiling. So, the Site24x7 package has a lot of features that you won’t find in the Zabbix system. However, this service isn’t free.
Key Features:
- Wide-Ranging Monitoring: Covers networks, servers, and web applications.
Why do we recommend it?
Site24x7 provides all of the features that you get from Zabbix plus a lot more. The platform offers network discovery and automated inventory management. It also automatically draws up a network topology map. You can use this platform to monitor multiple sites and also the internet connections between them. It is also able to track Web application and website performance.
As it covers all IT assets, the Site24x7 system provides full stanc observability. This enables you to get instant root cause analysis if a problem arises. For example, if application delivery slows, you will immediately know whether that issue is caused by the network because if there is a problem with a network device, you will have already received a notification about it.

The network monitoring tools in this platform include both automated network device status checking and network traffic analysis. There are also network performance troubleshooting tools in the package.
The alerting mechanism in the Site24x7 package is a real time-saver because it removes the need for a technician to sit and watch the service’s console in order to catch a performance problem. The tool will forward alerts to technicians as notifications by SNS, voice call, Slack message, or email.
Who is it recommended for?
This package is a good choice for any business that wants to use a cloud-based SaaS package rather than a self-hosted package, such as Zabbix. However, the Site24x7 system is not free, so companies that have already trialed Zabbix will need to look hard at the extra features in the Site24x7 platform to see whether they justify the price.
Pros:
- Full-Stack Insight: Enables quick root cause analysis with comprehensive monitoring.
- Web Performance Tracking: Monitors both web applications and website functionality.
- Hybrid Monitoring: Effective for both on-premises and cloud-hosted systems.
Cons:
- Cost Comparison: Pricier than Zabbix, making it less competitive for those on a budget.
All of the units on the Site24x7 platform are marketed in bundles rather than as individual tools. You can examine Site24x7 with a 30-day free trial.
5. Nagios
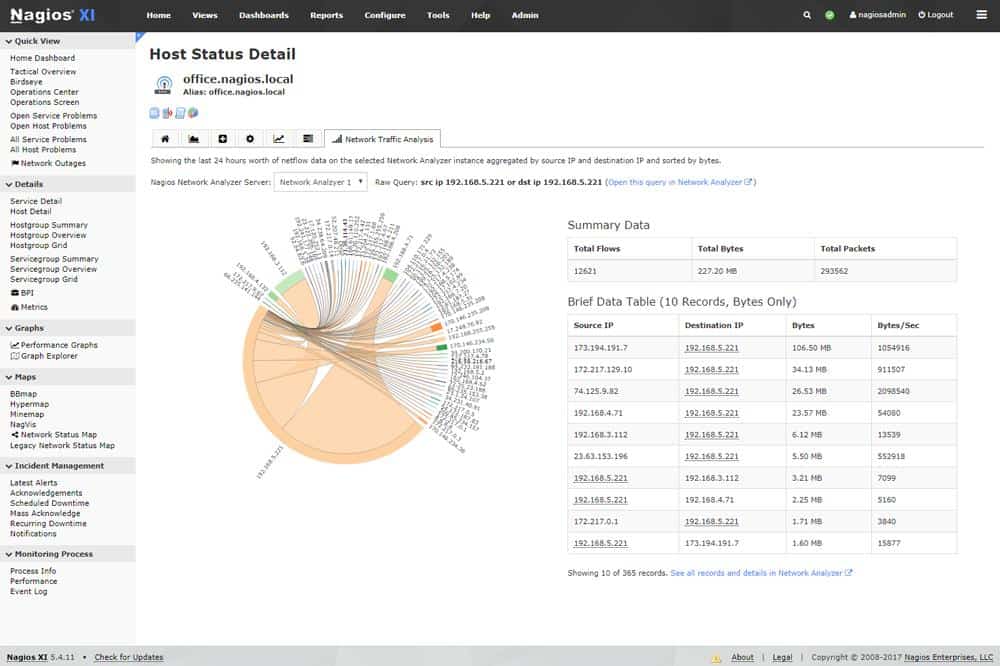
Nagios is a U.S-based company that delivers IT infrastructure monitoring and management software that enables organizations to identify and resolve problems before it gets out of hand. The product comes in two editions—Nagios Core and Nagios XI.
Key Features:
- Version Variety: Offers both free and commercial versions to suit different needs.
- Extensibility: Highly customizable with a wide array of plugins.
- Deployment Options: Flexible installation choices for on-site setups.
Why do we recommend it?
Nagios is available in free and paid versions. Both options provide network, server, and application monitoring. You get network discovery, asset inventory creation, and a topology map with this system. While the free Nagios Core provides most of the functions of Nagios XI, its interface is not so good.

Nagios Core is an agent-based free and open-source application that monitors critical IT infrastructure components such as network devices, servers, applications, including network protocols and system metrics and resources. Some of the key network protocols and system resources monitored include:
- Network protocols such as SMTP, POP3, HTTP, NNTP, ICMP, SNMP, FTP, SSH, and many more.
- Host resources such as processor load, disk usage, system logs and more, using monitoring agents.
- Hardware conditions such as temperature, alarms, and more
It alerts administrators when those critical components fail and also when they recover after the problem has been resolved. It runs on Linux and Windows operating systems. Some of the key features and capabilities include:
- Comprehensive Monitoring—monitoring of all critical infrastructure components.
- Problem Remediation—remediate failed network components, applications, and services when problems are found.
- Proactive Planning—allows you to proactively plan for upgrades.
- Multi-Tenant Capabilities—supports multi-user access and user-specific views.
- Extendable Architecture—provides integration with third-party applications via APIs and add-ons.
- Awareness—deliver alerts to IT staff via email and SMS.
- Visibility—gain visibility into your entire IT operations.
- Reporting—up-to-date availability and historical reports, among others
Nagios XI on the other hand is an easy-to-use agentless commercial edition that is targeted at large networks and enterprises. It uses Nagios Core as its back-end alongside other technologies including a built-in web configuration GUI, which makes it much easier to manage than Nagios Core. If flexibility and extensibility are what you’re after in a network monitoring tool, then Nagios XI is the way to go. It includes graphs and reports, customizable dashboards, backend API, multi-tenancy, and many other advanced features that make it much easier to use.
Who is it recommended for?
The free Nagios Core is very appealing to small businesses. However, you would probably have to match it up with a different front end, such as Kibana. The paid Nagios XI is suitable for mid-sized and large businesses and it comes with a professional support package.
Pros:
- Docker Compatibility: Can be deployed within Docker containers for ease of management.
- Community Support: Benefits from a vast library of community-developed plugins.
- Comprehensive Monitoring: Extends beyond networks to servers and applications.
Cons:
- UI Limitations: The free version lacks a user-friendly interface.
6. Checkmk
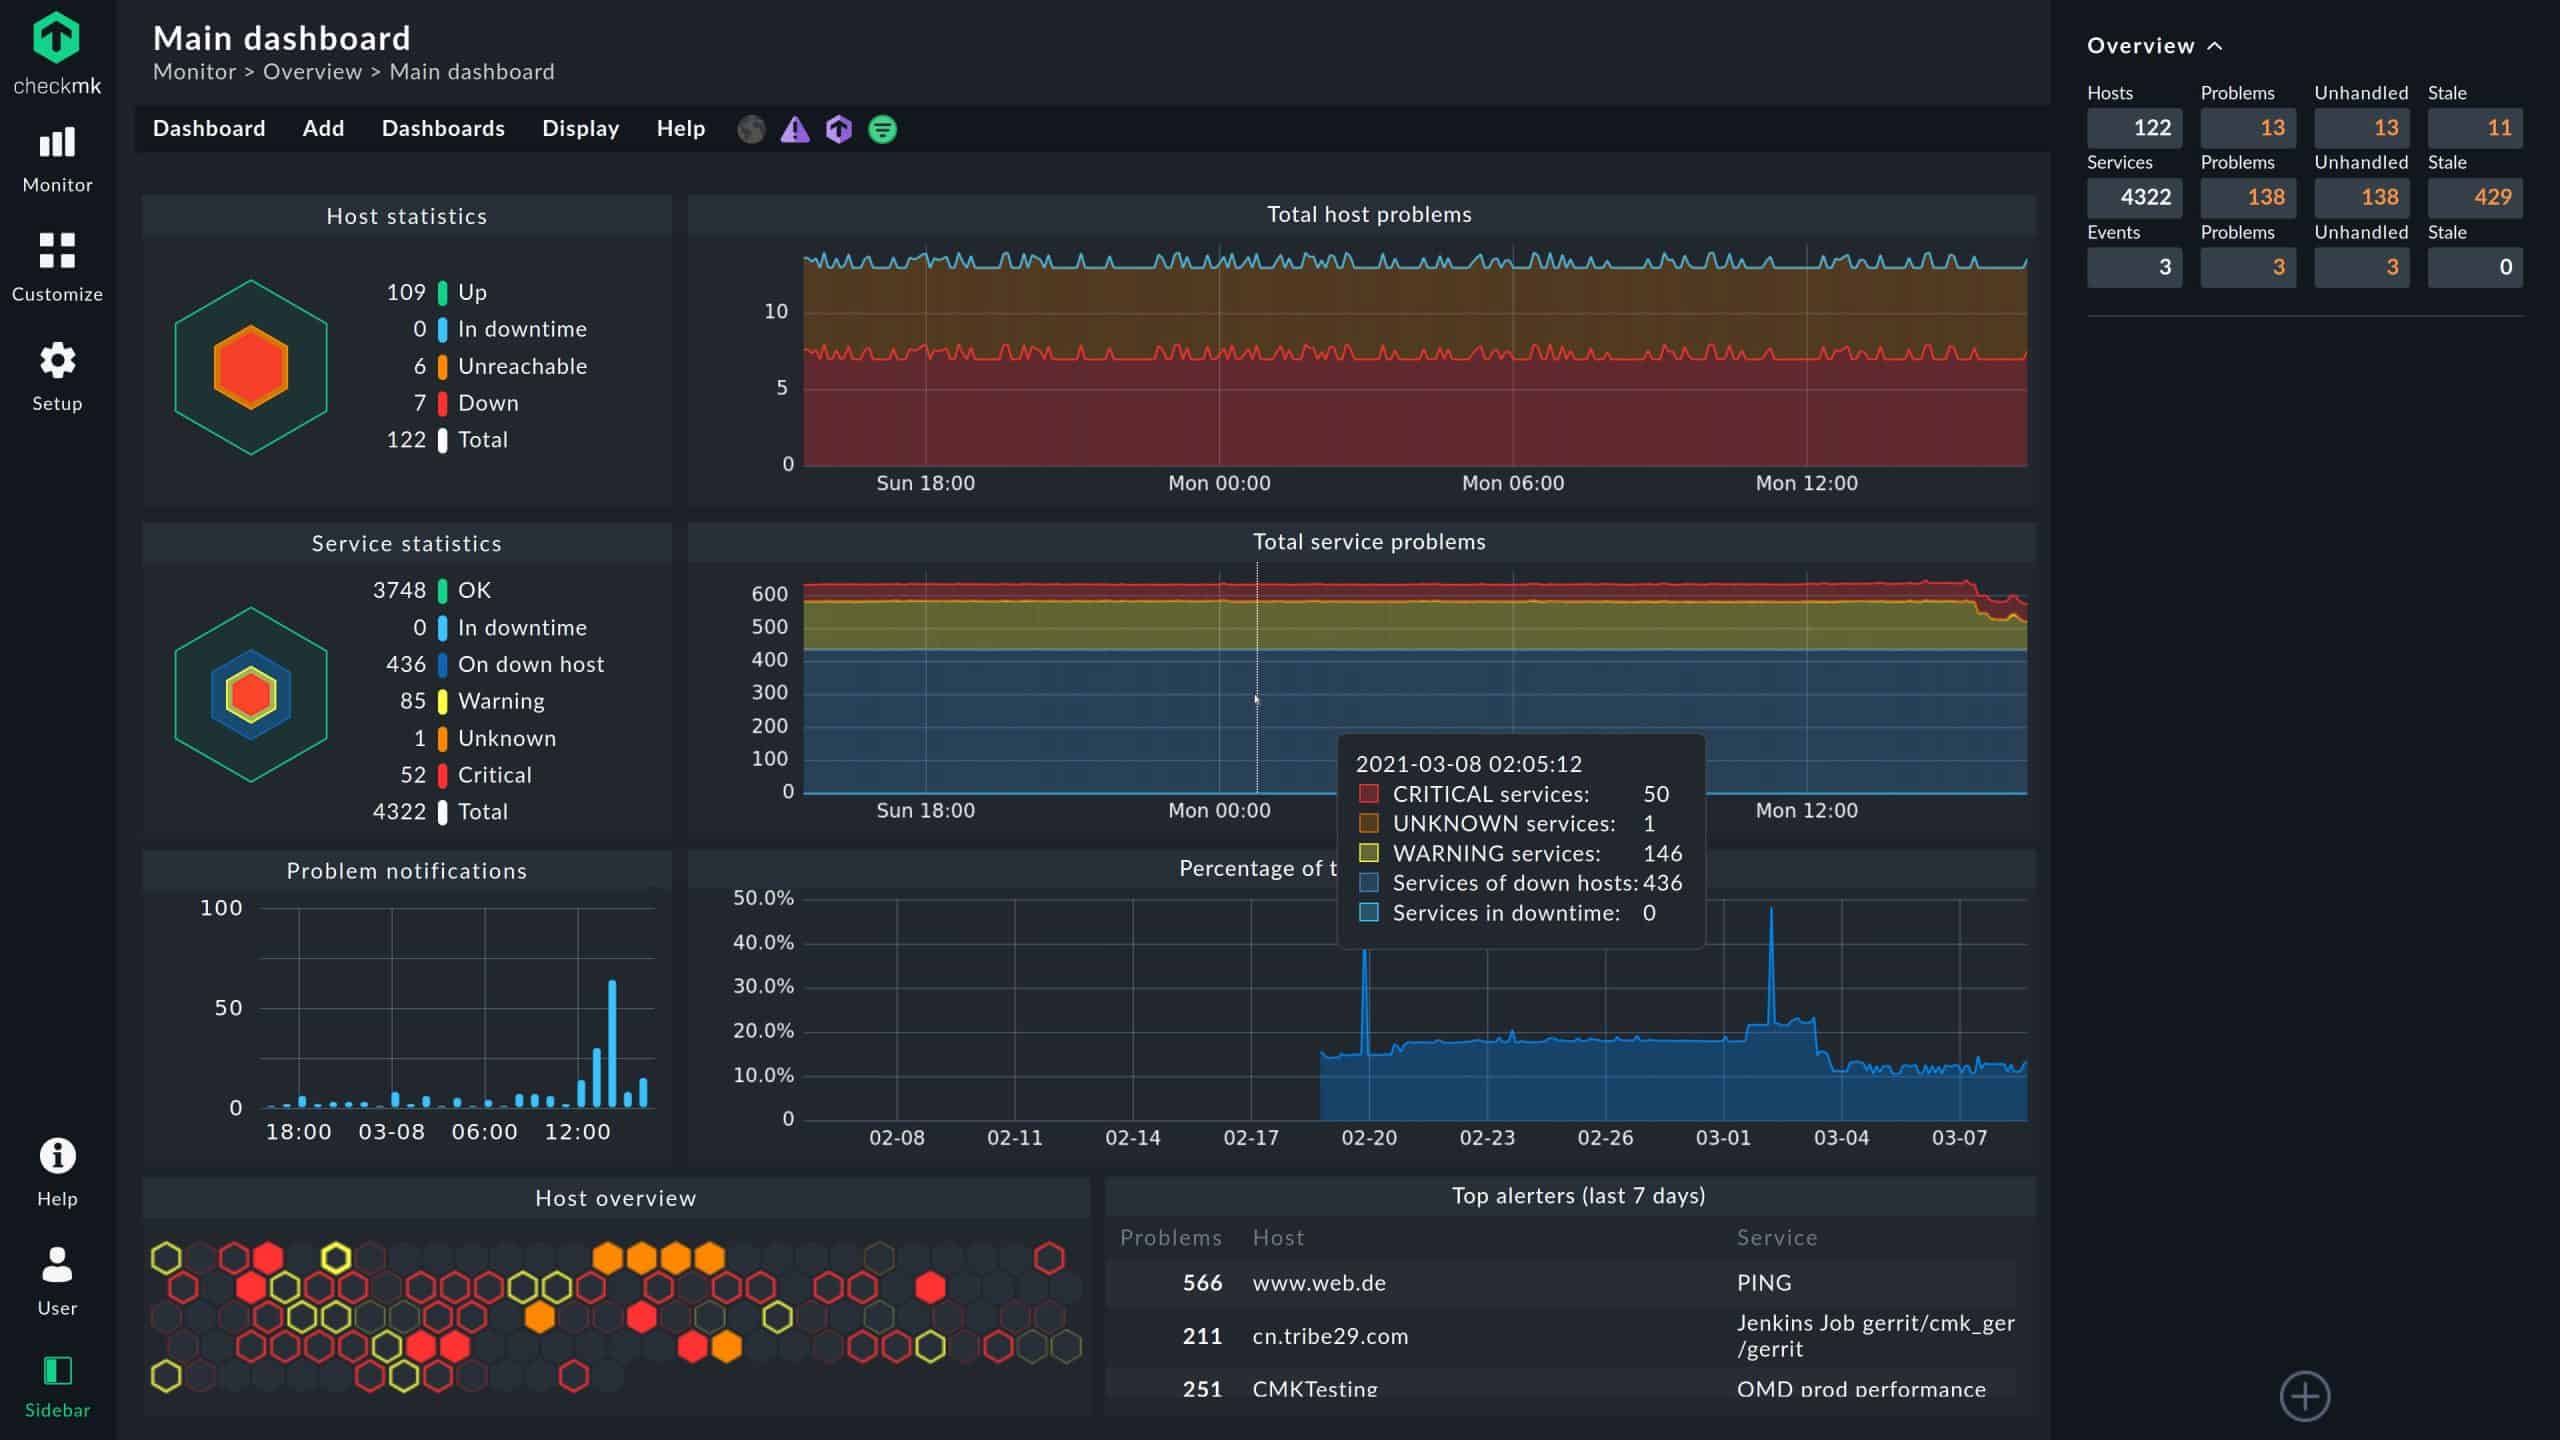
Checkmk is one of the leading tools for IT infrastructure and application monitoring. It uses an agentless and agent-based approach to monitor the health of IT infrastructure such as networks, servers, applications, storage, cloud infrastructure, IoT devices, and even business processes.
Key Features:
- Broad Monitoring: Keeps an eye on networks, servers, applications, and the cloud.
- Deployment Versatility: Suitable for both on-premises and cloud environments.
- Accessible Version: Offers a no-cost version for small-scale monitoring.
Why do we recommend it?
Checkmk provides network, server, application, and cloud monitoring. This is an on-premises package for Linux or Docker and there is also a version that is delivered as an appliance. There is also a version for managed service providers. The system includes autodiscovery, asset inventory creation, and a network topology map.
Checkmk combines the following types of IT infrastructure monitoring:
- Status-based monitoring, which records the health of a device or application.
- Metric-based monitoring enables the recording and analysis of time-series graphs.
- Log-based and event-based monitoring, in which key events can be filtered out and actions can be triggered based on those events.

The Checkmk server can only be deployed on a Linux machine. A basic knowledge of Linux is all you need to get the application up and running. All the software you need is either included in your Linux distribution or in the Checkmk package. It is also possible to run Checkmk as a virtual appliance, a physical appliance, or as a Docker-Container. The agents used by Checkmk to monitor and collect data are supported on Windows and other operating systems. Checkmk is available in various editions. Before you begin installing it, you must first decide which of the editions you want to use. A breakdown of the available editions is as shown on Table 1.0 below.
| Features | Checkmk Raw | Checkmk Enterprise | Checkmk Enterprise | Checkmk Enterprise |
|---|---|---|---|---|
| Edition | Open-source (100% free) | Free Standard Edition | Standard | Managed Services |
| Targeted At | Freelancers and the general public | Small scale users—one instance | Professional users | MSPs managing Multiple clients |
| Scalability | 1,000+ hosts | 25 hosts | 100,000+ hosts | 100,000+ hosts |
| Monitoring kernel | Nagios | Checkmk Microcore | Checkmk Microcore | Checkmk Microcore |
| Pricing | Free | Free | From €600 per year | From €1200 per year |
Who is it recommended for?
Checkmk offers two free options, which compete well with Zabbix. The first of these is Checkmk Raw, which is an open-source package. There is a paid version of Checkmk, which has a Free edition. That free tier is limited to monitoring 25 hosts, which is sufficient for small businesses.
Pros:
- Security Monitoring: Can be utilized for monitoring network security.
- Event Data Searches: Allows for custom filtering and analysis of live event data.
- Automatic Discovery: Streamlines asset management with auto-detection of IT resources.
Cons:
- Platform Restriction: Limited to Linux and Docker, excluding Windows systems.
The Free Standard Edition contains all of the features of the Standard Edition, and it’s unlimited for the first 30 days. Both the Free Standard Edition and the Raw Edition can be easily upgraded directly to the Standard Edition.
7. SolarWinds Network Performance Monitor

SolarWinds Network Performance Monitor (NPM) is a powerful network monitoring tool that helps organizations detect, diagnose, and resolve network performance issues. The tool is best suited for medium to large-scale enterprises.
Key Features:
- Multi-Vendor Support: Offers comprehensive monitoring for devices across different manufacturers.
- Deep Network Insights: Advanced discovery and visibility tools for in-depth network analysis.
- Smart Mapping: Automatically creates intelligent network topology maps for easy navigation.
- Troubleshooting Tools: Includes NetPath and PerfStack for streamlined problem-solving.
Why do we recommend it?
SolarWinds Network Performance Monitor is one of the leading network monitoring systems available and it provides processes that set the system up for you. The autodiscovery routine identifies all devices connected to the network, craetes an asset inventory, and draws up a topology map. The system then implements continuous automated monitoring.

NPM can be deployed in the cloud or on-premises using Windows server 2019, 2016 or 2012 R2. The SolarWinds Orion platform is required in order to deploy NPM either in the cloud or on-premises. The Orion Platform is the core of all SolarWinds IT products, and it allows the NPM to seamlessly work and integrate with other SolarWinds tools and software.
The SolarWinds NPM license is based on a number of items to monitor or according to the largest number of the monitored network elements. Each license tier has a stipulated maximum number of supported nodes (routers, switches, physical and virtual servers), interfaces (VLANs, ports and interfaces), and volumes (any logical disks being monitored) to manage and monitor, as shown on the table below:
| License tier | Maximum number of monitored elements |
|---|---|
| SL100 | Up to 100 nodes, 100 interfaces, and 100 volumes (300 elements in total). |
| SL250 | Up to 250 nodes, 250 interfaces, and 250 volumes (750 elements in total). |
| SL500 | Up to 500 nodes, 500 interfaces, and 500 volumes (1500 elements in total). |
| SL2000 | Up to 2000 nodes, 2000 interfaces, and 2000 volumes (6000 elements in total). |
| SLX | Virtually unlimited number of elements |
Who is it recommended for?
This tool is suitable for large and complicated networks. It will issue an alert if it detects a problem with a network device. This means that you don’t have to watch the console to identify issues. Alert thresholds are set at levels that trigger early enough to buy you time to fix identified problems.
Pros:
- Robust Stability: Highly reliable software with a stable performance track record.
- Expert Support: Backed by an excellent professional support team for troubleshooting..
Cons:
- No Cloud Service: Lacks a Software as a Service (SaaS) option, limiting deployment flexibility.
- Resource-Intensive: Requires significant system resources, which might necessitate hardware upgrades.
One potential downside to this tool is that the capabilities that it offers come at the expense of enormous system resource requirements. This means that to get the most of this software, you need a hardware and software server that will be capable of handling all that SolarWinds NPM has to offer. You can check out the 30-day fully functional free trial to confirm its capabilities and make sure it’s the right fit for your organization before purchase.
8. Icinga

Icinga is a popular enterprise-grade open-source tool for IT infrastructure and application monitoring. It checks the availability of your network resources, notifies you of outages, and generates performance data for reporting. Icinga was originally created as a fork of the Nagios Core application in 2009. The goal is to improve upon the groundwork laid by Nagios, including the addition of new features and capabilities.
Key Features:
- Broad Monitoring: Covers servers, network devices, and environmental sensors.
- Plugin Flexibility: Easily extendable with custom and Nagios plugins.
- Protocol Checks: Supports checks for key network services.
- Resource Monitoring: Tracks CPU, disk usage, and more.
- Comprehensive Alerts: Offers detailed notification and reporting tools.
- Open Source: No cost for software, optional paid support.
Why do we recommend it?
The free Icinga system monitoring package was forked from the free Nagios system. It resolves the problems with the two versions of Nagis which are that the interface of Nagios Core isn’t much use and the Nagios XI system isn’t free. Like Zabbix, Icinga provides traffic analysis, which isn’t included with Nagios.
The application is scalable, extensible, and can monitor large networks that span multiple locations.
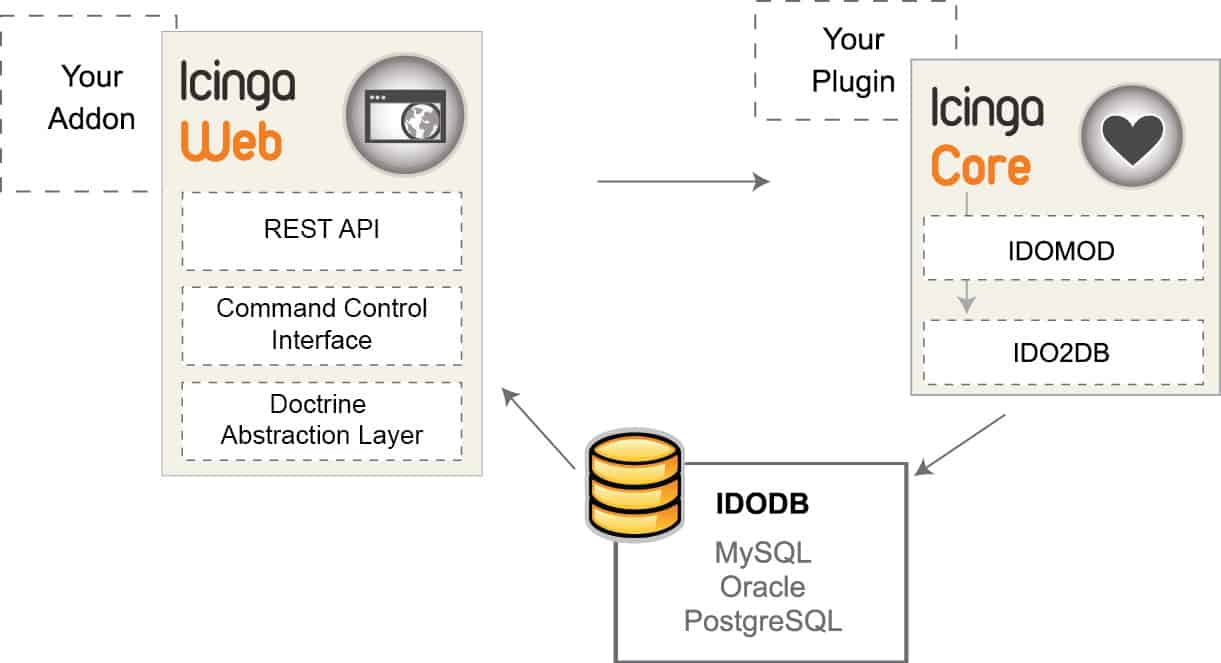
Icinga is made up of the following core products:
- Icinga 2 (server)—this is the core of the Icinga monitoring application that runs on a Linux machine
- Icinga Web 2—a web interface for users to view monitoring results and send commands to the Icinga Core
- Icinga DB—a synchronisation daemon between Icinga 2 (Redis) and Icinga Web 2 (MySQL)
- Icinga Director—the configuration deployment tool for Icinga 2
Icinga has been successfully deployed in large and complex environments with thousands of hosts and services, in distributed and failover setups.
Who is it recommended for?
Icinga is suitable for businesses of all sizes. The free system will appeal to small businesses and larger organizations can subscribe to a professional support package to make the system viable for business insurance purposes. The monitoring package will watch over virtual systems as well as physical servers and networks.
Pros:
- Versatile Monitoring: Keeps an eye on both network and server health.
- Scalable Solution: Adapts to monitor extensive, multi-site networks efficiently.
- Automation Friendly: Simplifies routine monitoring tasks through automation.
Cons:
- No Cloud Version: Lacks a direct Software as a Service (SaaS) offering.
9. Observium
Observium is a powerful auto-discovering network monitoring platform that provides real-time network and infrastructure monitoring. Observium is designed to run on Linux but can also monitor Windows and also supports other platforms such as Cisco, Juniper, FreeBSD, Citrix Netscaler, NetApp and many more.
Key Features:
- Wide Compatibility: Supports a diverse range of platforms and OS.
- Billing Data: Facilitates usage-based billing with detailed data collection.
- Capacity Planning: Assists in planning for growth and disaster recovery.
- Advanced Alerting: Offers external integration and customizable alerts.
- Auto-Discovery: Automatically identifies and maps network elements.
- Traffic Analysis: Provides insights into network traffic and usage.
Why do we recommend it?
Observium is available in free and paid versions. This tool provides a network discovery cycle that creates and maintains a network inventory. The system will also draw up a network map. That is the limit of the free Community edition. For automated monitoring with alerts, you need to upgrade to one of the paid editions.

It uses SNMP to collect data, which is then presented via a friendly web-based user interface. Since Apache and MySQL are prerequisites for installation of Observium, your server needs to meet the hardware requirements to run them.
Observium comes in different editions which are tailored to suit your network and server monitoring requirements as shown on Table 3.0 below:
| Features | Community | Professional | Enterprise |
| Ideal For | Personal/Home labs | SME and ISPs | large Enterprises |
| Number of monitored devices, ports and sensors | Unlimited | Unlimited | Unlimited |
| Traffic accounting system | No | Yes | Yes |
| Priority consideration and support | No | No | Yes |
| Pricing (USD) | Free | 280 per year | 1,400.00 per year |
Unlike other monitoring tools, Observium is easy to install and set up. If you are looking for a viable alternative to Zabbix, Observium is also a good option to consider. Unlike Zabbix, Observium is much easier to set up and customize even though it shares similar requirements. However, Observium does not run on Windows and has no data export.
Who is it recommended for?
The Community edition doesn’t offer many features beyond the system discovery and documentation features, so it doesn’t compete well with the full monitoring service of Zabbix. The paid version provides network monitoring but no server or application monitoring services. The software runs on Linux.
Pros:
- User-Friendly Interface: Features a professional and intuitive dashboard.
- Device Health Monitoring: Keeps tabs on the performance of network devices.
Cons:
- Linux Only: Not available for Windows or other operating systems.
10. NetXMS

NetXMS is an enterprise-grade multi-platform open-source network management and monitoring tool. NetXMS runs natively on both Windows and Linux/Unix-based operating systems and can be used to monitor your entire IT infrastructure including servers and applications.
Key Features:
- Nagios Compatibility: Supports most Nagios plugins out of the box.
- Comprehensive Monitoring: Manages networks, servers, and applications.
- Efficient Data Collection: Utilizes SNMP and native agents for data gathering.
- Low Resource Use: Operates smoothly with minimal system resources.
- Unified Management: Offers a cohesive console for both Windows and Unix.
- Network Discovery: Automated discovery for efficient network management.
Why do we recommend it?
NetXMS is a relatively new Nagios-style network monitoring tool. It competes with Zabbix because it is free to use. This system provides autodiscovery, network inventory creation, and network mapping. The system is customizable and it is compatible with Nagios plug-ins, which are available for free.
NetXMS is capable of auto-discovering devices in your network and collects information from them using agents. The collected information is sent back to the NetXMS servers for processing and storage. Network administrators can access collected data using desktop, web or a mobile (Android) management console.

Who is it recommended for?
NetXMS doesn’t provide server or application monitoring out of the box. However, you can explore Nagios Exchange for extensions that will add those functions to the package. Small businesses will be attracted to this tool. Larger businesses will want to sign up for a paid support package. This software is available for Linux and Windows.
Pros:
- Cross-Platform Support: Available on a wide range of operating systems.
- Extensive Device Coverage: Monitors a variety of devices and services.
- Plugin Integration: Enhances functionality with Nagios plugins.
Cons:
- Limited Mapping Features: Network mapping capabilities could be improved.
NetXMS is available for download free of charge. Check the administration manual for a detailed guide.
11. OpenNMS
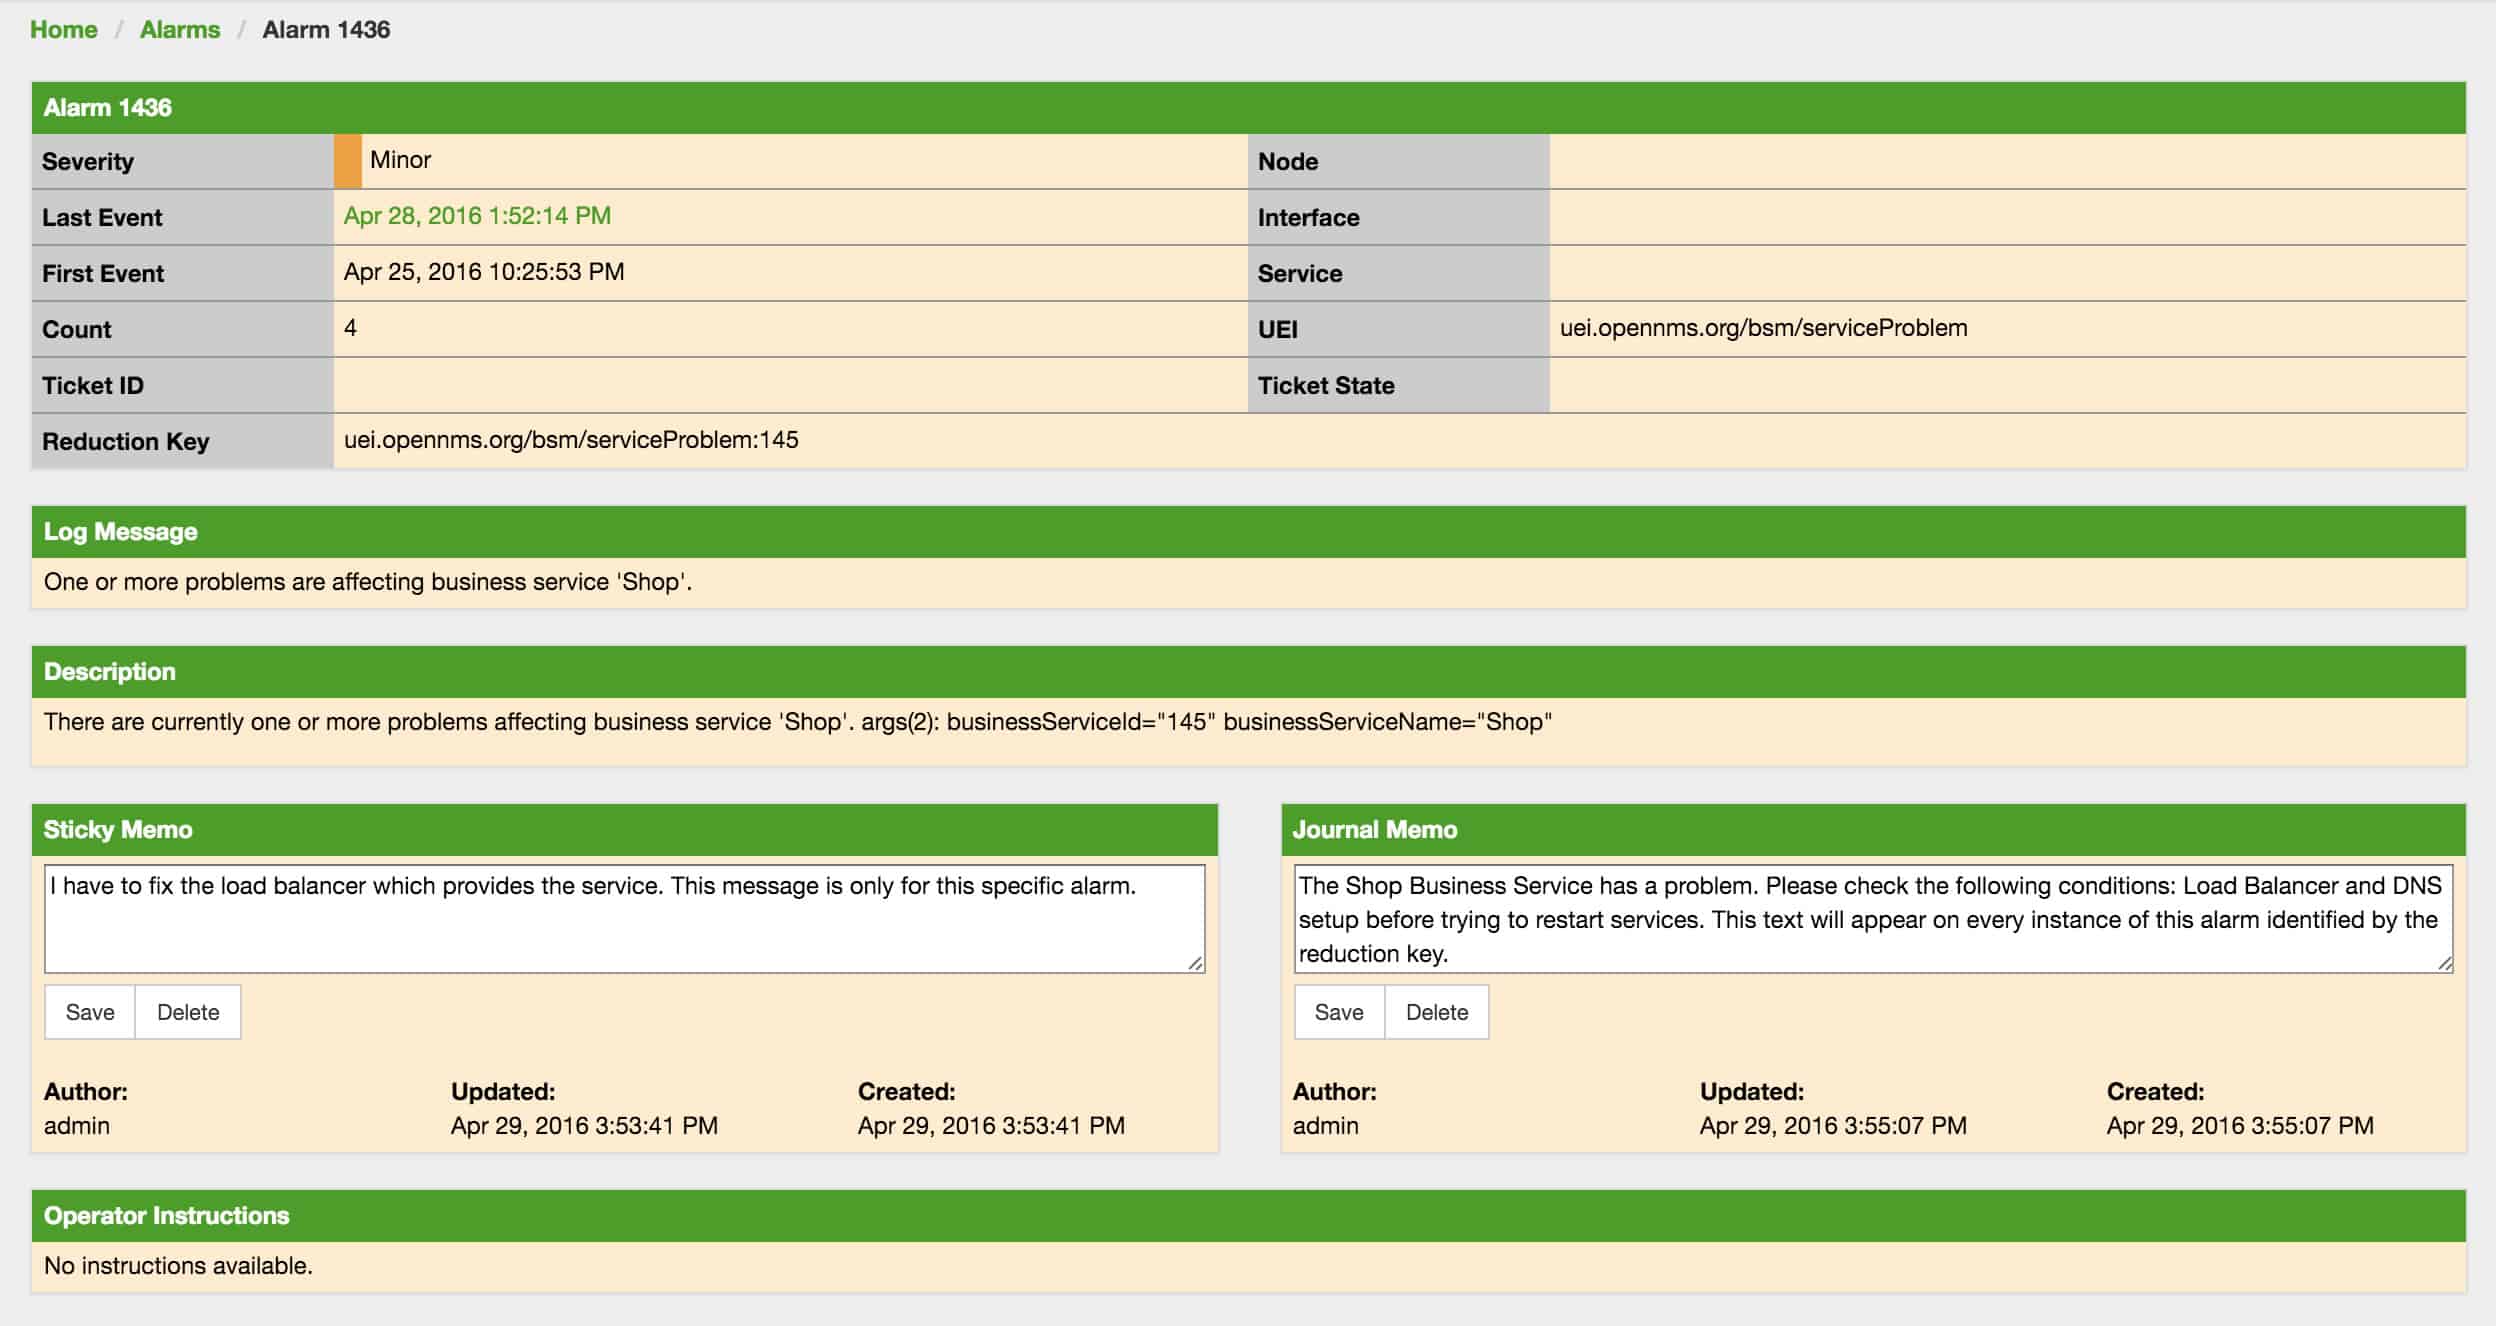
OpenNMS is an open-source network management and monitoring tool developed and managed by the OpenNMS Group and a community of developers. The product is 100% free with no licensing requirements. It prides itself as the first enterprise-grade network management platform developed under the open-source model. The business model is to offer it free of charge and earn revenue through consulting services provided by the OpenNMS Group.
Key Features:
Network Discovery: Automatically identifies network devices and services.
SNMP Monitoring: Leverages SNMP for detailed device management.
Topology Mapping: Visualizes network structures and relationships.
Why do we recommend it?
OpenNMS stands for Open Network Monitoring System. This tool competes with the network monitoring part of Zabbix but it doesn’t offer server or application monitoring capabilities. The package is offered in a free version, called OpenNMS Horizon, and a paid system, called OpenNMS Meridian.
OpenNMS is designed to be flexible, scalable and distributed, with the ability to manage tens of thousands of devices from a single server. OpenNMS runs natively on both Windows and Linux/Unix-based operating systems as long as Java SDK and PostgreSQL database is supported.
The following are the four main functional areas of OpenNMS:
- Discovery and Provisioning—discovers and adds devices to the management system either manually or automatically.
- Service Monitoring—determines if network-based services such as ICMP, HTTP, DNS are available.
- Event Management and Notifications—receives events via SNMP, syslog and other methods and generates email, SMS and other forms of notification.
- Data Collection—collects performance data for a number of network protocols such as SNMP, HTTP, JMX, WMI, and others.
Who is it recommended for?
The OpenNMS Meridian is suitable for large organizations. The package is able to monitor very large networks. The OpenNMS Horizon service is good for small businesses. The package provides automatic network discovery, inventory creation, and network topology mapping. This software is available for both versions runs on Linux.
Pros:
- Flexible Deployment: Supports a wide range of operating systems.
- Scalable Architecture: Manages large networks with ease.
- Dual Editions: Offers both free and premium versions to suit different needs.
Cons:
- No SaaS Option: Does not provide a cloud-based service model.
OpenNMS is freely available for download via Sourceforge. Check the installation and administration manual for a detailed guide.
12. Pandora Flexible Monitoring Solution (FMS)
Pandora FMS is an all-in-one network monitoring tool. It uses an agentless and agent-based approach to monitor the health of IT infrastructure such as network, servers, applications, databases, and much more. Pandora FMS supports both on-premise or cloud deployment options.
Key Features:
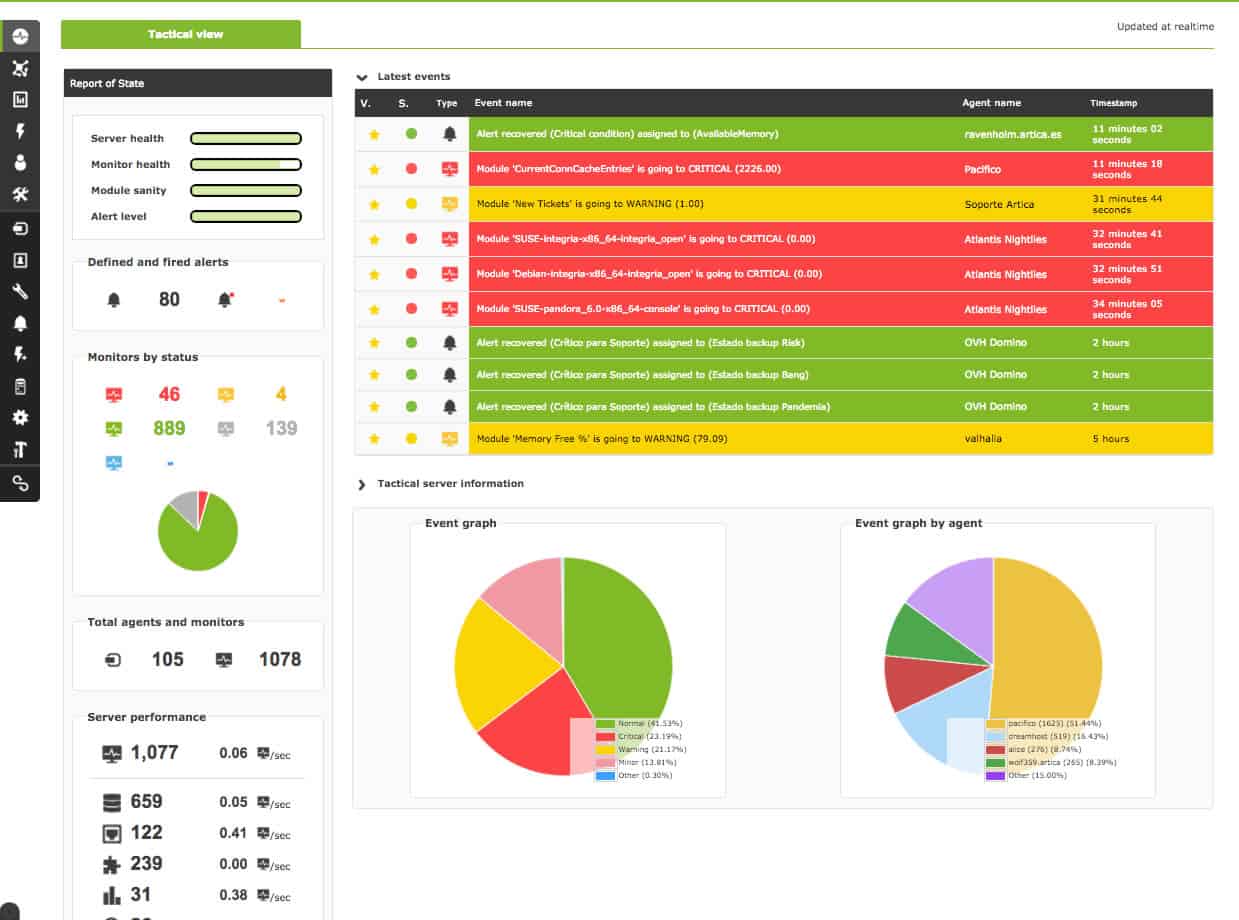
- Comprehensive Reporting: Delivers detailed performance and availability reports.
- Network Management: Utilizes NetFlow for in-depth traffic analysis.
- Agent-Based Monitoring: Offers flexible monitoring options for various platforms.
- Customizable Mapping: Allows users to tailor network maps to their needs.
- Configuration Tracking: Detects changes in device settings for security.
- Historical Data: Maintains logs and graphs for long-term analysis.
- Auto-Discovery: Efficiently discovers network devices and topology.
Why do we recommend it?
Pandora Flexible Monitoring Solution (FMS) monitors networks and servers. There is a free Community edition, which competes with Zabbix. This system also includes log management and it is possible to access remote devices to run software on them. The service provides automated monitoring with network discovery, inventory creation, and mapping.
With Pandora FMS you will be able to supervise and analyze your entire IT infrastructure in a single view. Pandora FMS is supported in almost any operating system. However, Linux seems to be the preferred OS for installation.

Who is it recommended for?
The Enterprise edition includes a special module for monitoring SAP environments, which is a service that none of the other options on this list offers. The package is available for installation or as a SaaS system. The on-premises version runs on Linux or Docker. Each endpoint on the network will need an agent program installed on it.
Pros:
- Full-Stack Observability: Monitors the entire IT infrastructure from a single platform.
- Advanced Network Insights: Provides thorough device monitoring and traffic analysis.
- Long-Term Analysis: Stores historical data for trend analysis and planning.
Cons:
- Lacks Patch Management: Does not include features for managing software updates.
The product is available in two editions:
- Community edition: A 100% free and open-source version that is targeted at individuals and small businesses.
- Enterprise edition: A fully functional premium version designed for businesses with large networks
Pandora FMS Community edition is available for download. A 30-day free trial of the Enterprise edition with full access to all the features is also available. The easiest way to install Pandora FMS is to use the ISO image, which contains a customized version of CentOS Linux with all the dependencies.
Zabbix alternatives FAQs
Is NetXMS free?
NextXMS is a free network monitoring system.
What is open source network?
An open-source system is a software package that allows you to view and change the source code. Generally, open source projects are free to use. In many cases, such as Nagios or Checkmk, there will be a base package that is open source and free with higher versions that add on more useful services, for which you have to pay. Very frequently, there is no professional support team for an open source package. An open-source network system is a network monitoring tool that gives you access to the package’s source code.
