A continuous profiler is a code development support tool. This system runs through, noting the resources that each line requires. This type of service lets developers see the effects of each function in a program, and so they can trace the root cause of performance problems, which might be due to clashes with locks on resources held by other software.
Here is our list of the four best continuous profilers:
- Datadog Continuous Profiler EDITOR’S CHOICE This cloud-based tool is part of an application performance monitoring package that also provides distributed tracing. Track through the execution of Web applications wherever they are hosted and get a continuous assessment of each text-based program liner-by-line.
- Granulate gProfiler This is a standalone tool available in versions for Google Cloud Platform, Azure, AWS, and on-premises servers.
- Amazon CodeGuru This online service is offered in versions for developers and live applications running on the AWS platform.
- Google Cloud Profiler This service from Google is aimed at developers and can analyze code on other cloud platforms, not just Google. It can also examine code performance on your servers.
You can read more about each of these options in the following sections.
The continuous profiler gives a live insight into the operations of the code that programmers traditionally would put in debugging messages to reveal.
Although developers mainly use continuous profilers, they can also be helpful during system testing, acceptance testing, and operations. The feedback from a program running in different environments will change according to various resource capacities and other software that competes for the same resources.
It is expected that a production test will reveal problems that weren’t apparent in the test environment. These revelations can result in programs being sent back to the development team for rework.
Why use a continuous profiler?
A continuous profile offers an automated testing service that analyzes resource access and doesn’t look for coding errors. Instead, the profiler report zooms in on the parts of the program that seemed to present problems. Resolving these problems can avoid resource locks and also help code to run faster.
Continuous profilers specifically look at CPU, memory, and I/O interface activity. They record the time spent on the CPU and the percentage of the CPU capacity that the code used. I/O demands, memory allocation over time, and the total time a task takes to complete is also recorded.
There aren’t any specific guidelines over how much CPU or memory a process should use. However, in many cases, it is clear to see spikes in utilizing those resources during the execution of the code.
Problems with continuous profiling
Although an examination of the way a program runs when it is under development can be helpful, those tests aren’t conclusive. Even during acceptance testing in a sandbox environment, you don’t get a complete picture of how a program will perform when it is live. This is because continuous profilers are usually deployed once an application has moved to production.
Even once the software is running live, its problems might not become immediately apparent. For example, the combination of software all running simultaneously can cause problems, and those resource issues won’t always occur. So, the software might be running for some time before it encounters a specific set of circumstances with a precise combination of other software running that creates a problem. The issue arises whether the new program needs to be adjusted or one of the other packages contributed to the resource shortage.
This means that the continuous profiler would have to be run, as the name implies, continuously to spot problems. Of course, there might never be any problems, so you are running this system testing software constantly for no real benefit. If you have system monitoring tools in place, then you would catch server resource shortages. If you have an application performance monitor, that would tell you which piece of software is pushing the processor over the edge.
Continuous Profiler types
There are two types of continuous profiling tools. These are sampling profilers and instrumenting profilers.
Sampling Profiler
A sampling profiler doesn’t take a constant reading of the CPU and memory utilization. Instead, it periodically checks, which is where the name “sampling” comes from. The profiler also looks at the application’s call stack, which extracts the line of the code running at that moment.
Instrumenting Profiler
An instrumenting profiler is an automated version of what programmers traditionally do to debug a program. That is, it inserts messages and system tests that write out to a log file.
The procedures of the instrumenting profiler system can create a lot of overhead and generate a lot of feedback data. Therefore, this type of profiler is less popular than the sampling profiler.
Using a continuous profiler
The continuous profiler offers a trace of resource usage with a record of the point in the code that the program had reached that moment. These profiles can be run for a period. It is then standard practice to compare profiles against each other. This lets you see anomalies. If, for example, you get similar CPU and memory activity repeatedly and then get a spike in metrics, then you can return to that point in time and see exactly what was running.
Some continuous profiling systems will perform comparisons for you. Another option is to feed the output from the constant profiler into a data analysis tool, such as Splunk, to compare operating periods for variations in performance.
As the value of code execution profiling requires establishing a baseline for performance, you should also start and stop the trace. Choosing times for profiling is known as ad-hoc profiling rather than continuous profiling. The decision over when to perform these traces is a personal one. An alternative strategy for ad hoc profiling would be to sample daily periods at regular intervals over a week. The starting and stopping of the trace can then be automated on a schedule.
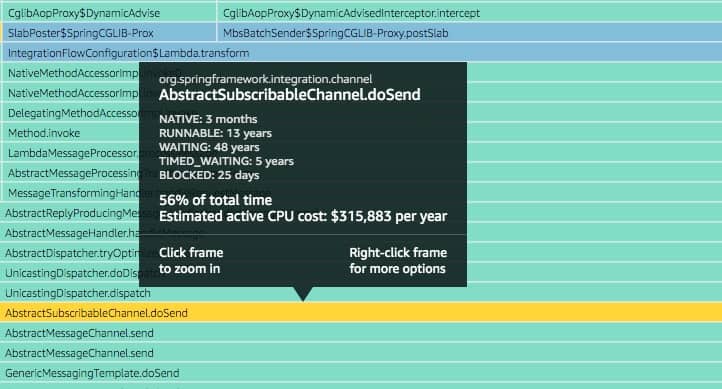
Flame graphs
A frequently-used layout for communicating the results of a continuous profiler is the flame graph. These show the consumption of a resource, such as CPU capacity as a stack with the longest-running processes at the base, tailoring up to the shortest-running process at any given time. The coloring chosen for the flame graph is often yellow, orange, and red, emphasizing the name of this visual format.
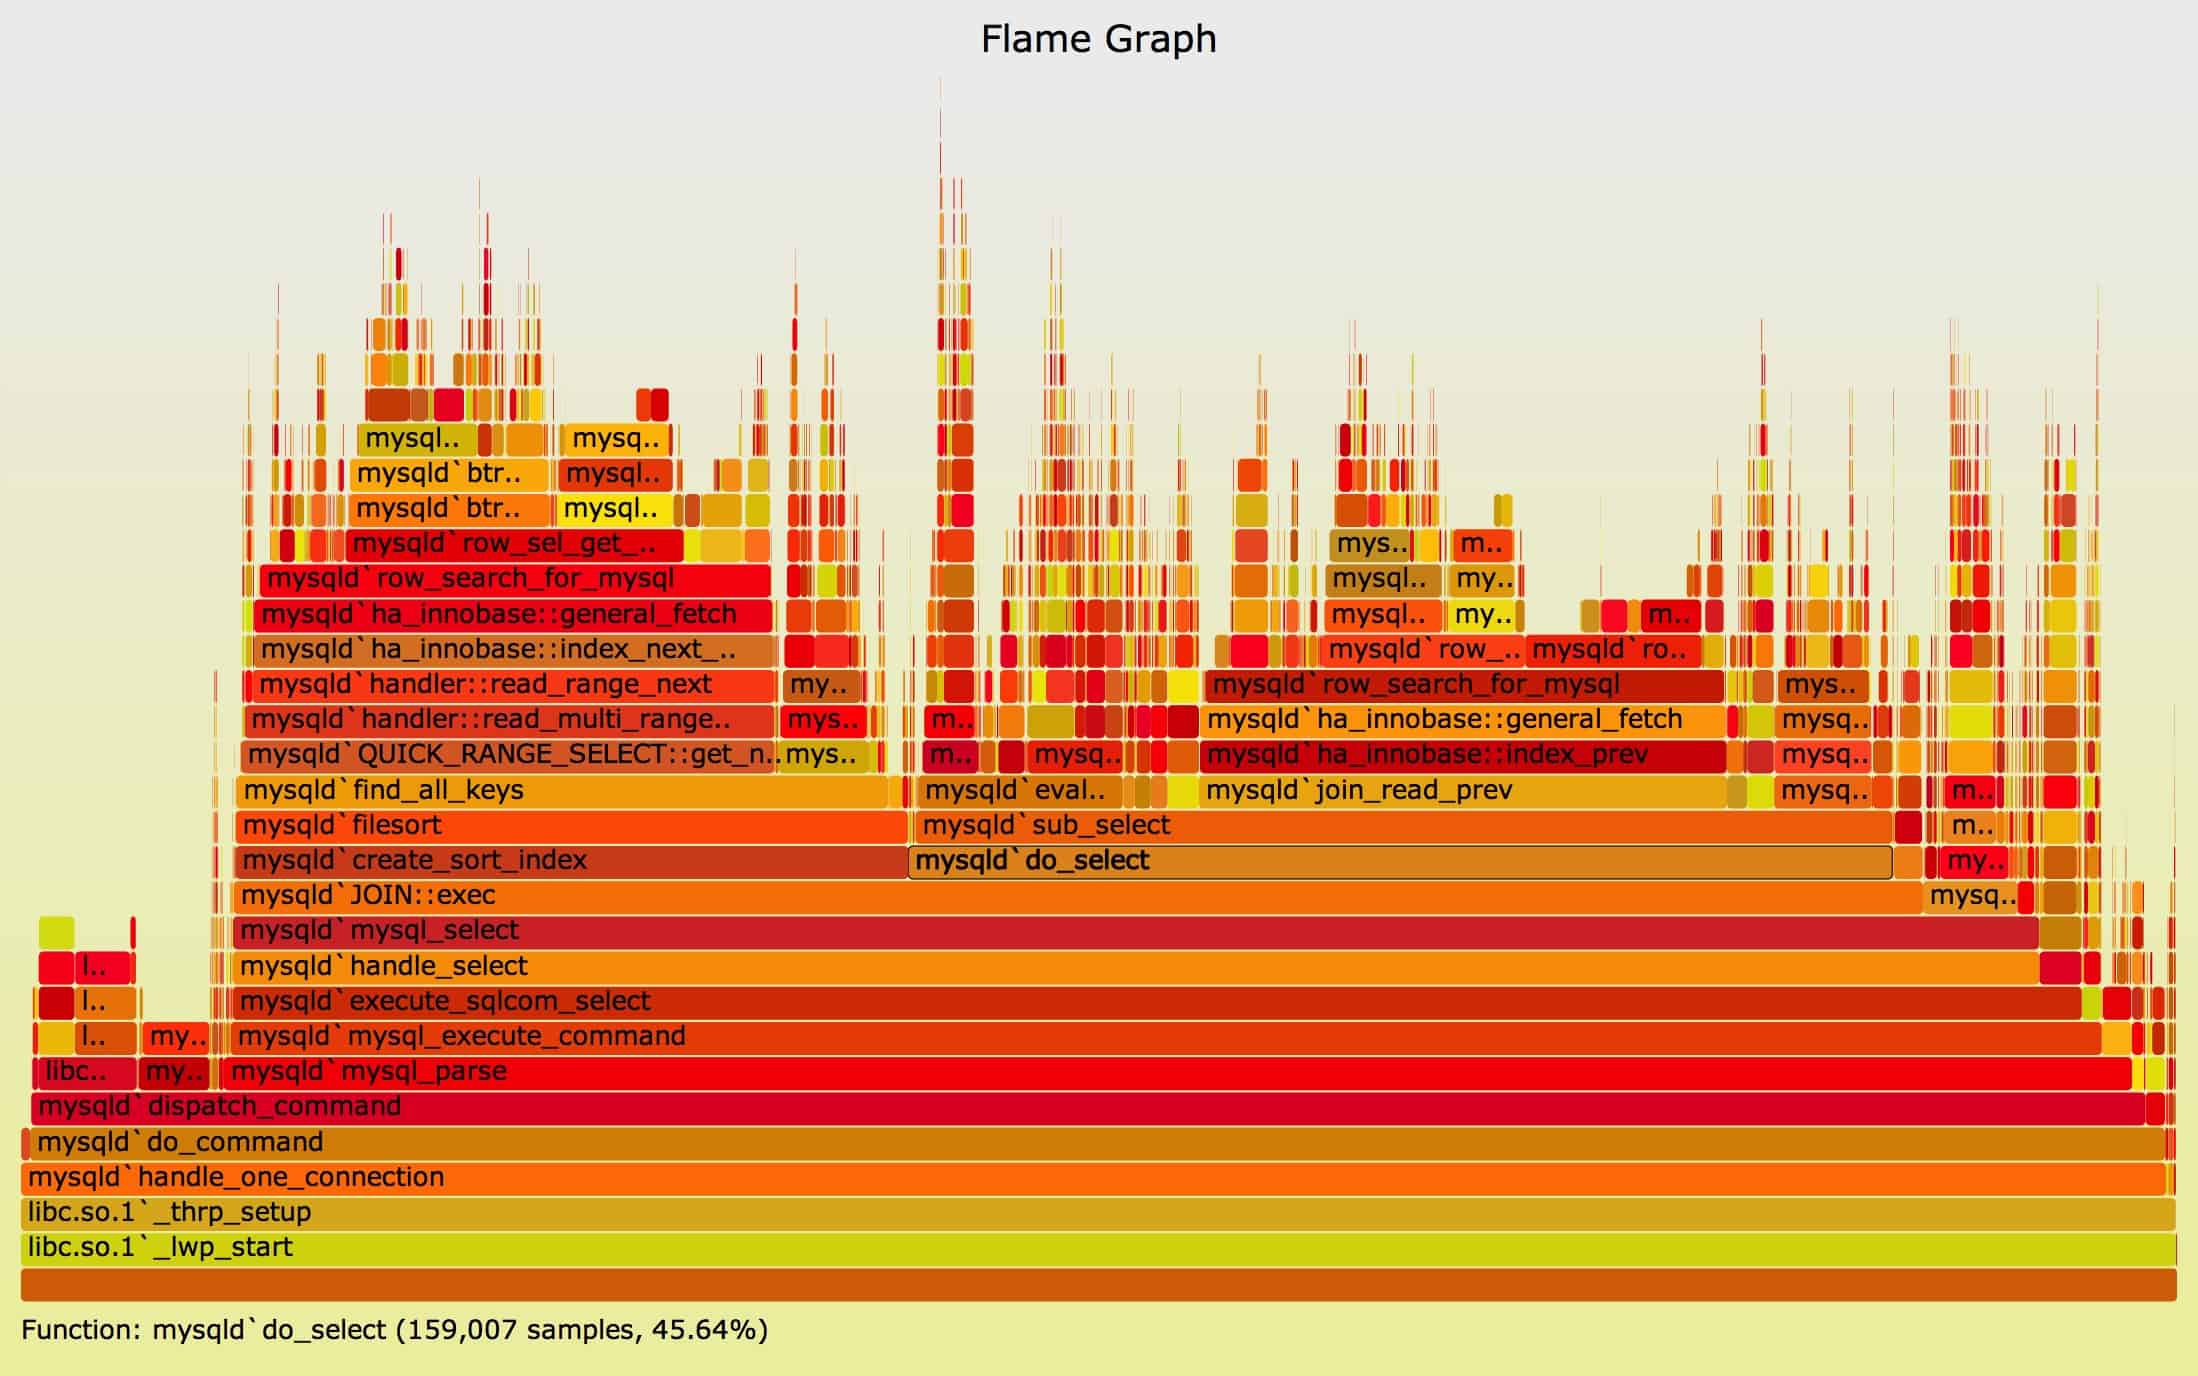
Not all continuous profiling tools use this format. Some monitoring services use the flame graph for other functions as well as the constant profiler. For example, Datadog used a flame graph for its continuous profiler and distributed tracing service in its output screen.
Tools for continuous profiling
There are a small number of continuous profilers available on the market today. A significant consideration that you need to consider when choosing a continuous profiler is the programming language that your code is written in. This is because constant profilers need to get into the code and understand its format to identify each instruction. Another variable to look out for is the platform that the continuous profiler will run on. For example, if you have your code running in an AWS account, you need to run your constant profiler in that same environment.
Our methodology for selecting a continuous profiler
We reviewed the market for continuous profiling tools and analyzed the options based on the following criteria:
- The choice for ad-hoc profiling as well as constant profiling
- A tool that has a graphical output for profiles
- A facility to compare profiles
- The option to export profiles for analysis in other tools
- A package that can scan through many different programming languages
- A free trial or a demo system for a no-cost assessment
- A system that can integrate with applications and cloud platforms but is offered at a reasonable price
Using this set of criteria, we looked at available continuous profiling tools. Unfortunately, there aren’t many systems available, but we have made sure to include standalone tools and continuous profilers that are part of a more comprehensive suite of system monitoring and management tools.
The Best Continuous Profilers
1. Datadog Continuous Profiler
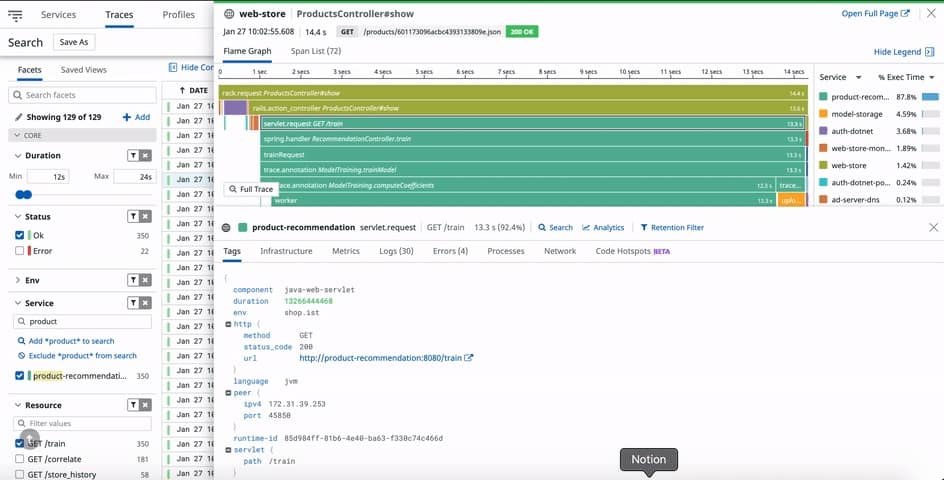
Datadog is a SaaS platform that offers different modules for system monitoring. One of the plans available from this platform is the Application Performance Monitor + Continuous Profiler. Combining these two services lets you leave the APM constantly running while using the profiler for specific periods that show worrying performance issues. The Continuous Profiler uses the same technology that Datadog applies to distributed tracing for microservices.
Key Features:
- Combined with an APM
- Linked distributed tracing
- Compares code changes
- Useful for operations
- Option for CI/CD testing
Why do we recommend it?
The Datadog Continuous Profiler is part of the Datadog APM plan. This application performance monitor specializes in tracking issues with Web applications. The package includes a distributed tracing service and the continuous profiler will step through code that is accessible. The coding languages that this system can deal with are Python, PHP, Nod.js, Go, Ruby, C++, and Java, plus the .NET framework.
The Continuous Profiler is meant for use in production. It can work through code written in .NET, Python, Go, Node JS, C++, Java, Ruby, and PHP.
Who is it recommended for?
This tool is an important service for businesses that run Web applications. However, it is particularly essential for those companies that develop and support Web applications with DevOps teams.
Pros:
- Provides quick insights into multiple servers through templates and prebuilt monitors
- Great interface, easy to use, and highly customizable
- Cloud-based SaaS product allows monitoring with no server deployments or onboarding fees
- Supports auto-discovery that builds network topology maps on the fly
Cons:
- Would like to see a longer 30-day trial
The APM + Continuous Profiler package is a subscription service, and it can be used in conjunction with other modules, such as Datadog Infrastructure, to improve resource monitoring. In addition, Datadog makes the Continuous Profiler and other modules available on a 14-day free trial.
EDITOR'S CHOICE
Datadog Continuous Profiler is, in our opinion, the best continuous profiling package on the market today because it can be set to run automatically as part of a wider application performance monitor. The APM will discover and map all applications and then set up constant monitoring. This capability extended to the detection of microservices and activity tracking with distributed tracing. When an application activates text-based programs, the Code Profiler is activated to watch the execution of the code line by line. The tool will spot changes to code and highlight them.
OS: Cloud based
2. Granulate gProfiler
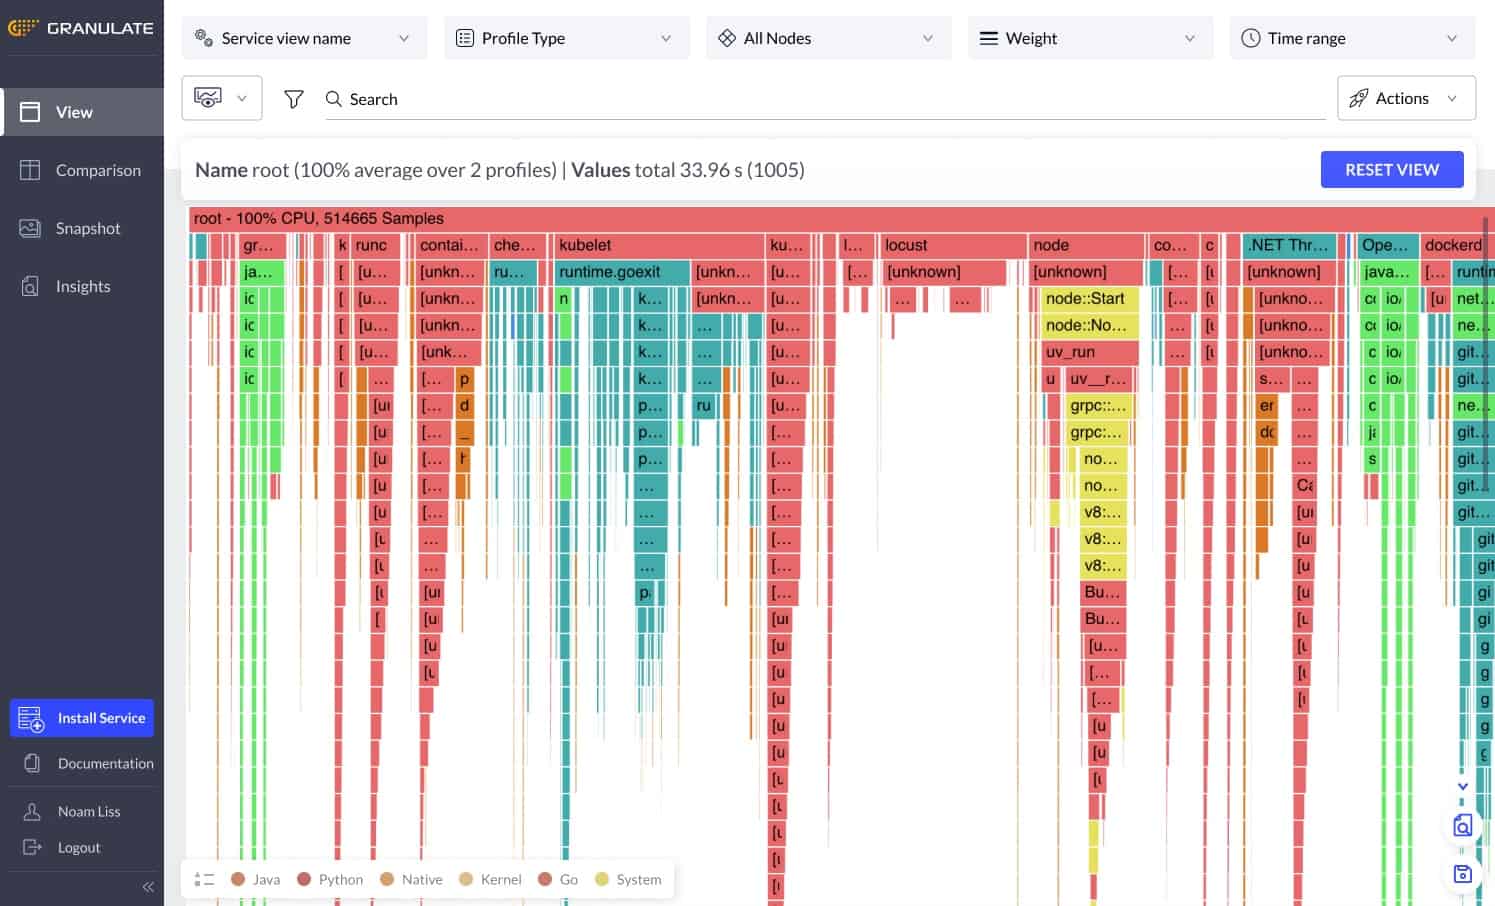
Granulate is a system optimization platform and offers an additional tool in its continuous profiler called gProfiler. The system is available on a range of media, with installation on the platform you want to implement profiling; this includes Google Cloud Platform, AWS, Azure, and on-site servers over Docker. This system is designed for the profiling of live applications.
Key Features:
- Editions for cloud platforms
- Correlates to server activity
- Code version comparison
- Identifies performance changes
Why do we recommend it?
The Granulate gProfiler tool is an open-source package that you can install on your servers over Docker or on a cloud account with AWS, Azure, and Google Cloud Platform. Granulate also offers the continuous profiler as part of its system and application optimization services.
The gProfiler can look through Java, Go, Python, Scala, Clojure, and Kotlin. It is intended to be set to run continuously rather than on an ad-hoc basis.
Who is it recommended for?
The continuous profiler can trace through code written in Clojure, Scala, C/C++, Ruby, Java, Python, JS, PHP, and Go. Although this system is intended for use on live Web applications, there is nothing to stop you from using it during development or as an acceptance tester. You host the system and the code is available for adaptation.
Pros:
- Great interface – highly customizable
- Supports a wide range of languages
- Completely free and open source version available
Cons:
- Can take time to fully explore the platform
The gProfiler is a free, open-source system, but it can be included with a subscription to the central Granulate platform, giving you performance analysis and optimization actions.
3. Amazon CodeGuru
Amazon CodeGuru is available to analyze programs hosted on the AWS platform or your site. The system is available in two versions: CodeGuru Reviewer, for use by developers, and CodeGuru Profiler, for use in production. In addition, the system can scan code written in Java and Python.
Key Features:
- AWS service
- Suitable for development
- AI for performance baselining
Why do we recommend it?
Amazon CodeGuru is available for scanning code that is hosted on an AWS account. This can be a serverless system. The profiler identifies the resource usage of each line in a Web application as it runs. This system is not free. However, it can be bundled into your regular monthly AWS bill.
CodeGuru Profiler performs baselining as it captures statistics, so there is no need to create a snapshot of regular activity to compare ongoing performance too. In addition, the package uses Machine Learning routines to make this standard for each application rather than expecting a typical performance profile.
The service will track the performance of code running on Amazon EC2, Amazon ECS, AWS Fargate, Amazon EKS, AWS Lambda, or on-premises. The tool mainly focuses on CPU utilization, and the analyzer included in the package will recommend changes to code that will improve performance and efficiency.
Who is it recommended for?
Amazon CodeGuru will be of interest to businesses that develop and support Web applications either for in house use or for use by clients on a subscription service. One version of the tool is designed for use during development and another is built for profiling live applications.
Pros:
- Provides automated and manual profiling tools
- Generous 90-day trial period within AWS
- Leverages machine learning to discover easy optimization opportunities
- Uses simple visuals to illustrate areas for improvement
Cons:
- Better suited for those already using AWS
Amazon offers both of the CodeGuru services for free for 90 days.
4. Google Cloud Profiler
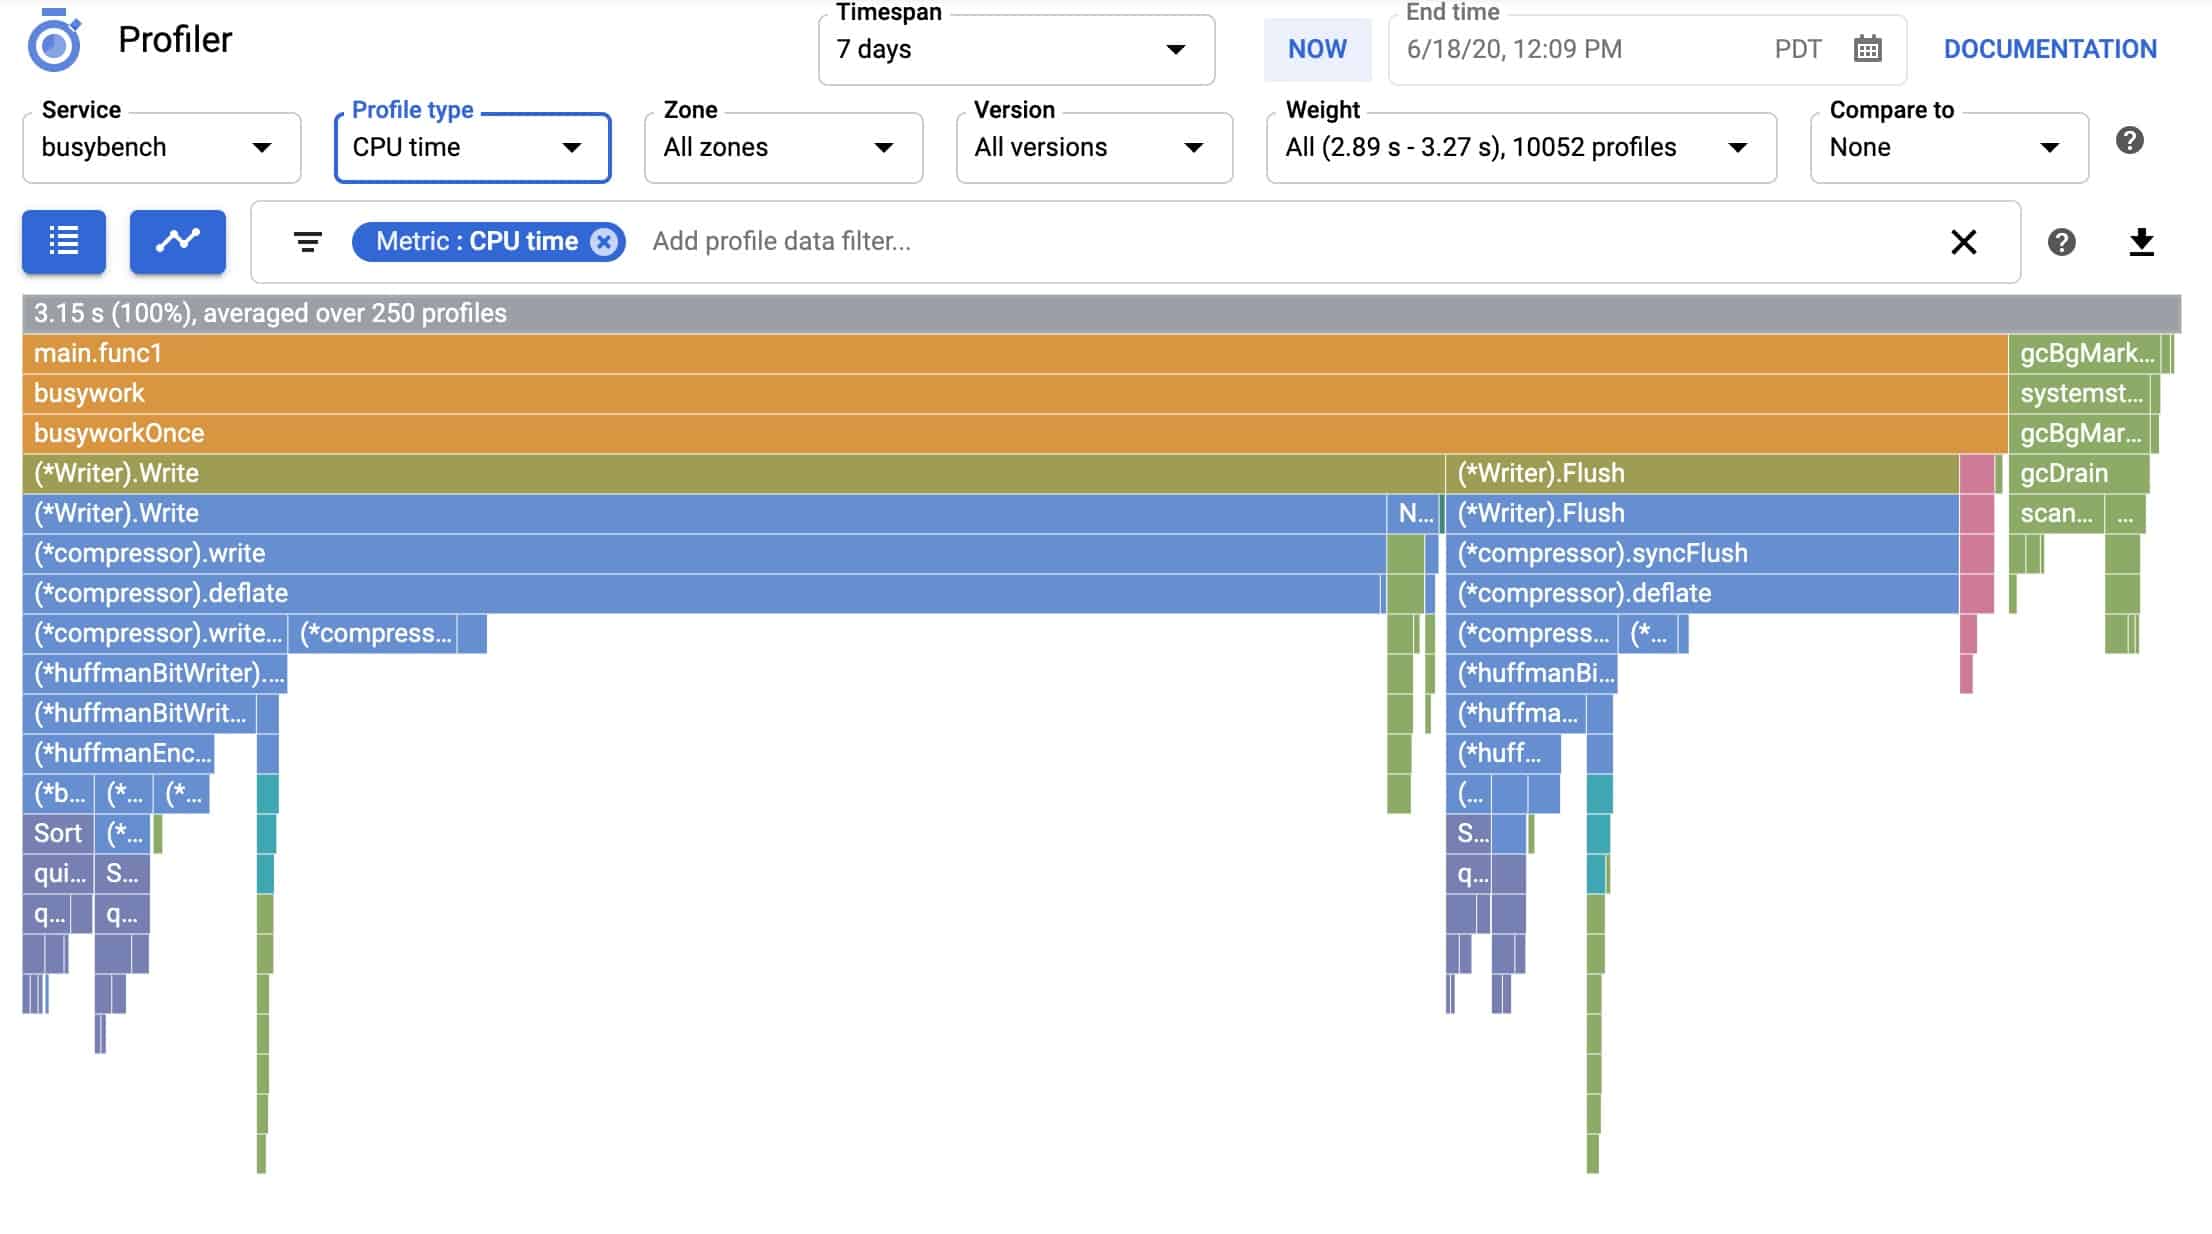
Cloud Profiler from Google is a free service for customers of Google Cloud. Although this system is hosted on the Google Cloud Platform, it can perform continuous profiling for programs running on AWS and Azure. It can also trace the performance of applications running on your servers.
Key Features:
- Use for live systems
- Match to server activity
- Fire graph
Why do we recommend it?
Google Cloud Profiler isn’t limited to scanning code hosted on the Google Cloud Platform. It can also assess code that is running on your own servers or on the cloud platforms of AWS and Azure. The tool is free to use, which gives it a marketing advantage over the AWS CodeGuru service.
The Cloud Profiler is intended for use with applications that are running in production. It tracks activity in the CPU and memory. It is designed to be left operating continuously, and it uses the sample profiling strategy. The system has two elements – an agent and a server, which include the dashboard.
The console for the system shows live time-series graphs, including a fire graph. It also makes traced statistics available for later analysis. In addition, the system can profile code written in Java, Go, Node.js, and Python.
Who is it recommended for?
This system has a wide appeal because it doesn’t matter where your applications are hosted. The service is intended for use with live Web applications, but you could also use it in a sandbox environment to try out your applications before you release them.
Pros:
- Offers continuous profiling
- Free for Google Cloud users
- Simple interface – easy to use
- Extensively documented
Cons:
- Better suited for those using Google Cloud services
Although you need a Google Cloud account to use the Cloud Profiler, you can get started with a free trial structured as a $300 credit for metered Google Cloud services, which should be used over 90 days. Using the Cloud Profiler won’t use up any of that credit.
Continuous Profiler FAQs
What is continuous profiling?
Continuous profiling involves following lines of code as they run. This monitoring method is designed for Web applications that are written in text-based scripting languages, such as JavaScript and Python. Code profiling is a suitable method for ad-hoc examination of code but continuous profiling provides a strategy for ongoing automated performance monitoring. Continuous profiling systems also examine the activities and capacity of hosting servers to ensure that the resources accessed by the scripts do not run short.
What is application performance profiling?
Application performance profiling can range from memory profiling to code profiling. “Profiling” means establishing a pattern of behavior for a module and it is possible to deploy this type of analysis on code that is ready for integration testing or when it is already released into production. The purpose of application performance profiling is to ensure that the application makes efficient use of resources and that the supporting infrastructure is able to provide enough resources.
What are profiling tools?
Profiling applications is a little more complicated than a manual code review because it requires all contributing modules that can be included in a running application and these components might be hosted on many different remote servers. So, a profiling task begins by tracking down all of those modules and creating a map. With the list of modules identified by one tool, such as an APM, you can then move on to simultaneously follow the execution of the application’s code and the server resources that it requires. These tasks can’t effectively be performed without specialist profiling tools.
