Monitoring tools are crucial for maintaining the performance, reliability, and scalability of applications and infrastructure. Among the leading platforms in this space, Datadog and Instana each bring unique strengths tailored to different operational needs.
Datadog is a cloud-based monitoring and analytics platform renowned for its versatility and broad visibility. It provides a unified interface for tracking servers, databases, applications, logs, and metrics across cloud, on-premises, and hybrid environments. With extensive integrations and a strong focus on observability, Datadog enables teams to monitor complex systems in real time, making it ideal for organizations managing multi-layered infrastructures.
Instana, in contrast, emphasizes automation and efficiency, particularly in microservices and containerized environments. Its automatic discovery and instrumentation streamline monitoring, reducing manual setup and configuration. Designed for modern, distributed systems, Instana works seamlessly with technologies like Kubernetes and Docker. AI-driven insights and real-time performance data empower teams to detect and resolve issues rapidly in dynamic environments.
While both platforms aim to optimize performance and reliability, they diverge in their approach. Datadog prioritizes comprehensive visibility across diverse environments, whereas Instana focuses on automated monitoring tailored for containerized and microservices-based architectures. Understanding these differences can help organizations choose the platform that best aligns with their technical requirements and operational priorities.
Overview of Datadog Observability Platform
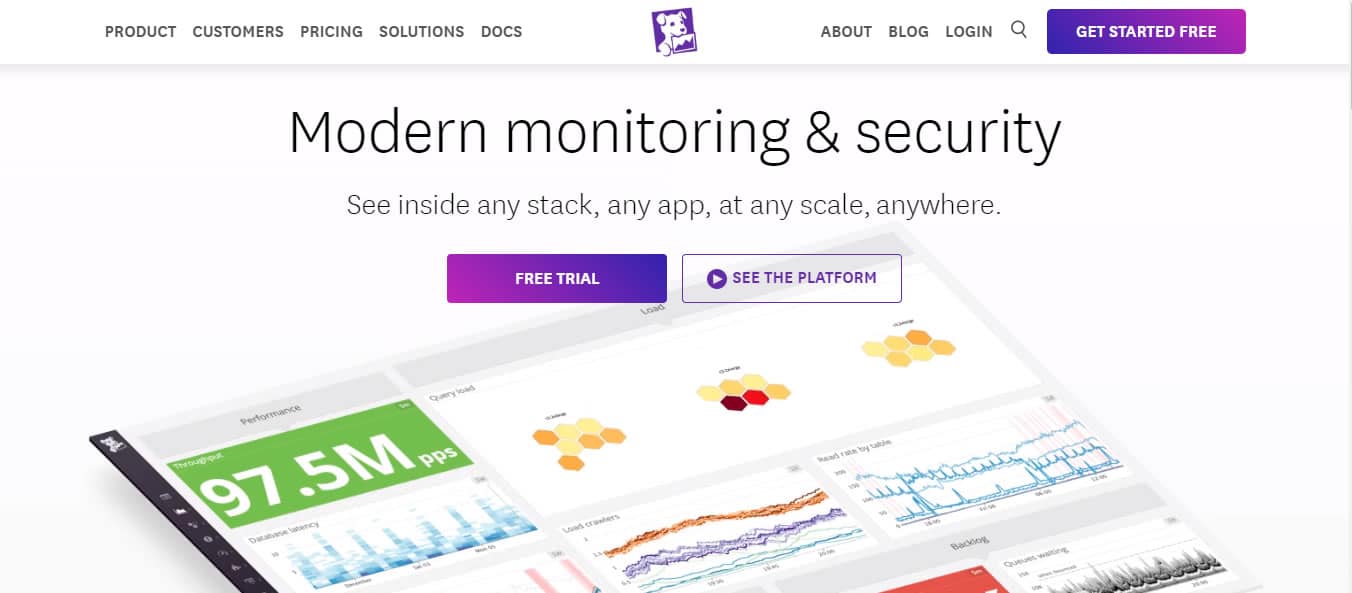
Datadog is an agent-based observability service for cloud-scale applications. It provides real-time monitoring services for cloud applications, servers, databases, tools, and other services, through a SaaS-based data analytics platform. Datadog brings together end-to-end traces, metrics, and logs to make your applications, infrastructure, and third-party services entirely observable. These capabilities help businesses secure their systems, avoid downtime, and ensure customers are getting the best user experience.
Datadog was named Leader in the 2022 Gartner Magic Quadrant for Application Performance Monitoring (APM) and Observability. Some of the key observability products and services offered on the Datadog SaaS-based platform include
- Application Performance Monitoring (APM) Provides end-to-end distributed tracing from browser and mobile apps to databases and individual lines of code.
- Infrastructure Monitoring Provides metrics, visualizations, and alerting to ensure your engineering teams can maintain and optimize your cloud or hybrid environments.
- Network Performance Monitoring Provides full visibility into every network component that makes up your on-prem, cloud, and hybrid environments, with little to no overhead.
- Real User Monitoring (RUM) Provides insight into your application’s frontend performance from the perspective of real users.
- Synthetic Monitoring This allows you to create code-free tests that proactively simulate user transactions on your applications and monitor key network endpoints across various layers of your systems.
- Log Management & Analytics Unifies logs, metrics, and traces in a single view, giving you rich context for analyzing log data.
With more than 600 built-in integrations, Datadog allows you to see across all your systems, apps, and services while aggregating metrics and events across the full DevOps stack. A free 14-day trial with full access to all the features is available on request. After that, the software is generally sold through monthly subscription plans based on hosts, events, or logs.
Overview of Instana Cloud Platform
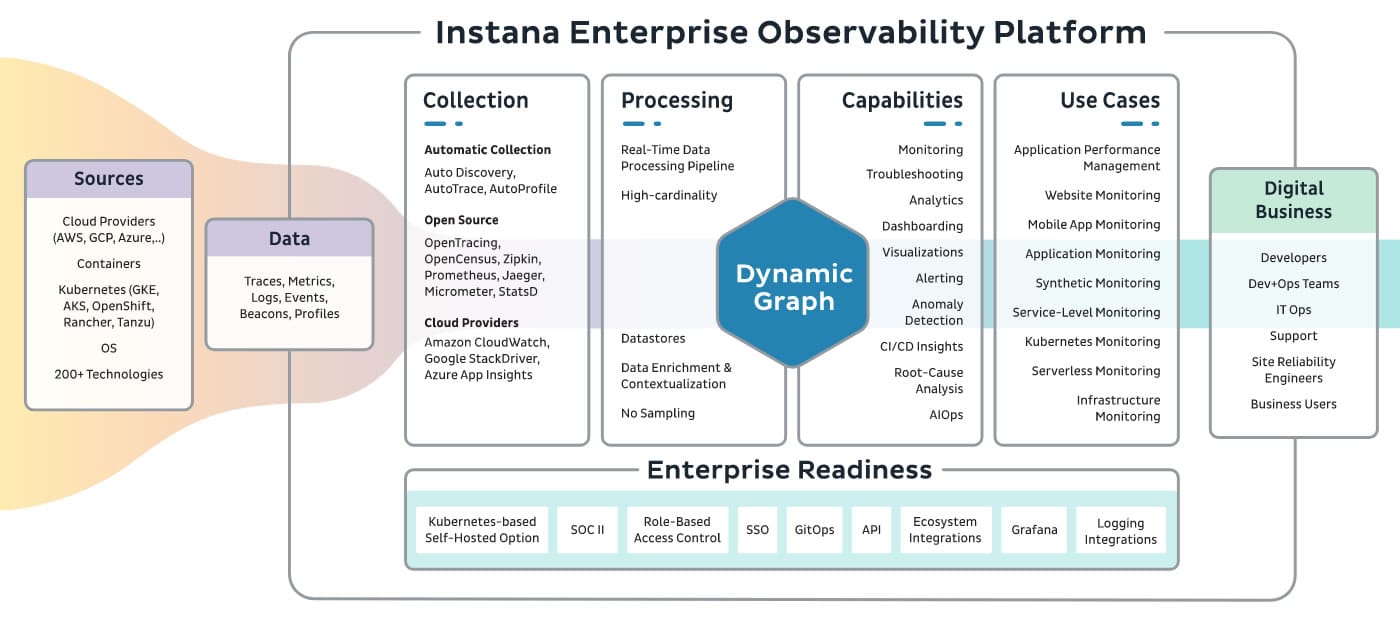
Instana is an agent-based enterprise observability and Application Performance Management (APM) platform. It is designed for use in monitoring and managing the performance of applications used in microservice architectures. Although the observability and APM market is a crowded one, Instana has worked its way up as one of the leading solution providers in the market. Instana was named Leader in the 2022 Gartner Magic Quadrant for Application Performance Monitoring (APM) and Observability. Instana stands out, especially when it comes to monitoring software used in “container orchestration” and cloud-native applications and microservices. The Instana platform also provides Web Site Monitoring and Cloud & Infrastructure Monitoring capabilities with automatic visualization of performance through graphs generated using machine learning algorithms.
Instana works by collecting sensor data through the agents deployed on a monitored system and aggregates it before sending it to the Instana cloud-based backend. The Instana cloud-based backend platform ingests observability data, including metrics, traces, logs, and profiles. It then uses the ingested data to automatically discover and map all services, infrastructure, and their inter-dependencies and provides notifications regarding performance.
Key features and capabilities include:
- Enterprise Observability Ingests all performance metrics, traces all requests, and profiles every process, along with the capabilities needed to make observability work for the enterprise
- Application Performance Monitoring Automatically observes, monitors, and fixes any application, service, or request. It also provides rich and immediate contextual information about the quality of every service which improves application performance.
- Website Monitoring Optimizes user experience with detailed browser performance data correlated to backend performance
- Cloud & Infrastructure Monitoring Enables you to automatically monitor and visualize containers, hosts, middleware, and Kubernetes to gain a better understanding of the health of your infrastructure.
- Microservices Monitoring Automates the discovery of application services, platforms, and infrastructure, including configuration and dependencies, tracing, and root cause analysis.
A 14-day free trial with full access, to all the features, is available on request with no credit card required. After the 14-day trial, you will be required to purchase a valid license to continue using the service.
Datadog vs Instana: How They Compare
Installation and Set Up
Datadog is a SaaS-based application, there are no on-premises system requirements and no installation hassles. However, you’ll be required to install local agents specific to the device or service you wish to monitor for the most part. An agent-based mode means no auto-discovery feature, so you have to deploy an agent for all your devices individually. Datadog supports integration with VMware vSphere, but the setup process is a bit complicated. That said, Datagod provides enough documentation and setup instructions to guide you through the installation and configuration process.
On the other hand, Instana offers both SaaS-based and self-hosted (on-premises) versions. The SaaS-based version needs no installation other than the usual sign-up process using an internet-connected device with a supported browser. The SaaS solution can be hosted in multiple public clouds like AWS and Google Cloud. However, just like Datadog, you will be required to install local agents on each host that Instana uses to collect data from your monitored systems. To use the self-hosted (on-premises) version, you need to install both the Instana backend and the Instana agents. Self-hosted platforms give you granular control over the system, but you also have to manage it yourself. Once the setup or installation process is completed, you can automatically begin to visualize and monitor your entire infrastructure.
Dashboards and Visualizations
Datadog dashboards are generally more user-friendly and aesthetically pleasing from a visual perspective with their clean and modern dashboard design. In addition, Datadog allows you to customize your dashboards with a vast library of visualization tools and drag-and-drop widgets. But it requires a lot of setup work to get things working. Once set up, there are two primary ways of visualizing your data:
- Screenboards These are grid-based dashboards with free-form layouts that include images, tables, host maps, graphs, and logs. They are commonly used as status boards or storytelling views that update in real-time or represent fixed points in the past.
- Timeboards This represents a single point in time—fixed or real-time—across the entire dashboard. They are commonly used for troubleshooting, correlation, and general data exploration. In addition, you also get a time series that can plot any metric being captured from your hosts, such as CPU usage, uptime, or memory usage.
Instana comes with a visually appealing, intuitive, responsive, and easy-to-use Web UI. The main dashboard shows an overview of all applications, web apps, sites, infrastructure, platforms, analytics, and events. Instana also provides default and custom dashboards to enable you to gain better visibility into your infrastructure. The default dashboards are built-in ready-to-use dashboards that present you with the health of your applications. The custom dashboard provides better visualization but requires customization to make it fit for purpose. Instana also allows you to use plugins to build dashboards in external solutions.
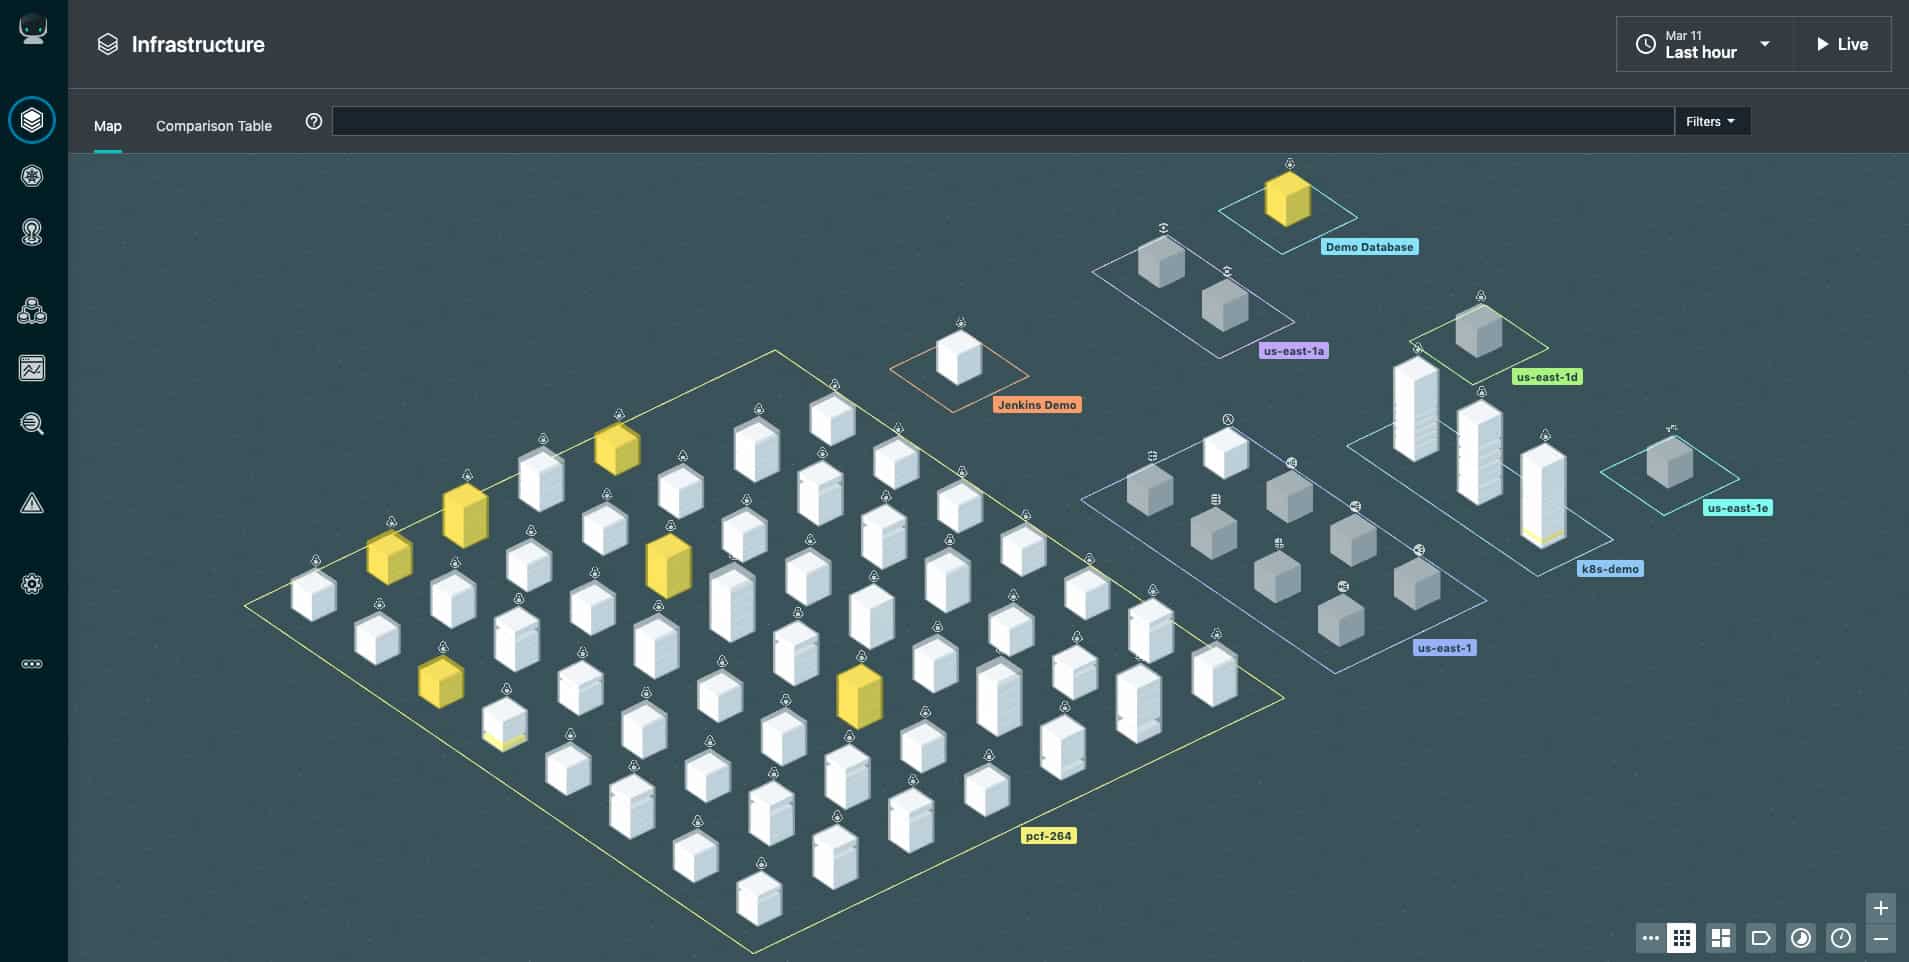
For example, you can create Instana dashboards in Grafana. This allows you to leverage both the richness of Grafana’s visualization capabilities and the capability to build dashboards that integrate multiple data sources in addition to Instana itself. The Instana infrastructure map provides an overview of all your monitored systems, grouped by named zones, and within each zone are pillars composed of opaque blocks that represent the software components running on that system.
Alerts and Notifications
Datadog’s approach to alerts and notifications is based on machine learning (ML), which it calls Watchdog. Watchdog uses ML techniques to identify problems in your infrastructure, applications efficiency, and services, and flag anomalies. Alerts in Datadog are called Monitors. Users can receive alerts using Pagerduty, Slack, and email. These can be based on nearly any metric that Datadog can capture. As a result, every alert is specific, actionable, and contextual—even in large and temporary environments. This unique approach to alerts and notifications makes Datadog stand out and helps to minimize downtime and prevent alert fatigue.
Instana makes it easy to manage events and alerts. Instana built-in events and custom events help to spot problems in the monitored system as soon as they start to appear. The alerting system is designed to elicit a response in a timely fashion and accelerate issue resolution. Instana supports integration with external alert management and notification tools to enable easy integration into your existing ecosystem. Instana can forward alerts to technicians via the following technologies: Email, Google chat, Microsoft Teams, Office 365, Opsgenie, PagerDuty, Prometheus, Slack, Splunk, IBM Watson AIOps, and more.
Reporting and Integration
Instead of generating the usual out-of-the-box reports that most network admins expect, Datadog’s approach to reporting aims to make metrics easily searchable, and it does excellently. Although some network managers prefer reports to be generated in good old PDF format, not everybody needs it in that format these days. Therefore, Datadog also comes equipped with an easy-to-use API that can significantly extend the range of what Datadog can track. The Datadog API is an HTTP REST API that can access the Datadog platform programmatically and returns JSON from all requests. Similarly, Datadog’s ability to support and integrate with more than 600 technologies makes it more versatile and adapted to many different functions than Splunk.
Instana provides various exportable out-of-the-box reports and integration capabilities. The real power of the Instana cloud platform lies in its ability to integrate with tons of notable third-party cloud platforms such as Amazon Web Services (AWS), Azure, IBM Cloud, and Google Cloud Program (GCP), among others. Instana integration capabilities can also be extended with its REST API features that allow you to query whatever data you want out of Instana and use it as you wish. For instance, the API can be used to embed some metrics in the email or other forms of messages you send to key stakeholders. The API can also be used to automatically load some of the Instana reports into an Excel spreadsheet using a macro. All this and more is possible by accessing the free-form REST API.
Licensing and Price Plans
Datadog pricing model is based on per server, per month, and it’s free for up to 5 hosts (with 1-day data retention). But some customers complain that it becomes costly at scale. As a result, Datadog is available in several different pricing tiers:
- The Network Performance tier – suitable for monitoring networks and systems for most small to midsize businesses.
- The Infrastructure tier – ideal for organizations that want to use the software as a centralized monitoring service for systems and services.
- The APM tier – designed for larger organizations looking to fix service and device-layer problems.
- Serverless tier – aimed at those looking to monitor network and application issues.
- Log Management tier – meant for companies with large amounts of log data to parse for context and retention.
- There are also other security, synthetic, and accurate user monitoring, each appropriate pricing for the core task.
All Datadog prices are billed annually, making it one of the most price-customizable management apps.
The Instana platform pricing model is based on a per host per month basis, billed annually in advance. A host is considered to be any physical or virtual OS instance that you monitor with Instana. The price for a subscription to the Instana SaaS platform is $75 per host per month, while the self-hosted version costs $93.80 per host/per month. All plan prices include support such as software updates and customer support.
| Features | Instana | Datadog |
|---|---|---|
| Target market | Ideal solution for medium to large-scale enterprises, including IT Operations, DevOps teams, Site Reliability Engineers | Developers, freelancers, IT operations teams, security engineers, and business users from SMB to large organizations in the cloud age. |
| Security capabilities | None | Cloud SIEM, workload security, application Security monitoring, and more |
| Deployment model | SaaS, self-hosted | SaaS |
| Integration | 200+ | 500+ |
| REST API | Yes | Yes |
| Support methods | Email Blogs and Documentation Video Guides Knowledge Base | Phone Online Knowledge base Video tutorials |
| Licensing and pricing model | Free trial available Subscription-based Pricing model is based on per host per month | Free trial available Subscription-based Pricing model is based on per server, per month |
Table 1.0 | Comparison of Instana and Datadog key features and capabilities
Choosing Between Datadog and Instana
Datadog and Instana are two leaders that have distinguished themselves in the observability and performance monitoring space. Deciding between the duo shouldn’t be about which is better, but about the one that best meets your performance monitoring needs.
Datadog’s SaaS-based model makes it ideal for organizations that don’t want to burden themselves with any resource-intensive on-premise monitoring solution. Service-oriented companies, SMBs, or smaller networks that don’t have dedicated IT personnel to keep tabs on the infrastructure at a granular level will find this feature-rich tool suitable. More extensive networks with multiple remote locations may find Datadog’s agent-based model inconvenient since agents will need to be individually installed. But if you can successfully get past the agent installation and configuration process, Datadog is a mature and excellent network observability platform.
Instana’s flexible deployment model makes it ideal for organizations that want to be in complete control, but it comes at the cost of a skilled human resource to manage it, and a steep learning curve. Nonetheless, organizations seeking all-encompassing observability, website monitoring, cloud infrastructure monitoring, Kubernetes, and microservices monitoring solutions will find their needs met in Instana.
