Host sFlow is a lightweight, open-source monitoring solution that provides real-time insight into network traffic and system performance at the host level. Based on the sFlow standard, it is designed to deliver continuous visibility into how applications, devices, and infrastructure components are behaving across a network.
Modern IT environments generate large volumes of traffic and telemetry, making it difficult to maintain clear visibility using traditional monitoring approaches. Host sFlow helps address this challenge by exposing detailed performance data directly from individual hosts, rather than relying solely on aggregated network-level metrics.
This host-centric approach makes it possible to observe activity with greater precision, particularly in distributed or high-throughput environments where subtle performance issues can otherwise go unnoticed.
Because it is designed to be efficient, Host sFlow can scale across large infrastructures without introducing significant overhead. This makes it suitable for environments where performance monitoring must run continuously in the background without impacting system resources. It also works alongside a wide range of analytics and monitoring platforms, allowing teams to incorporate it into existing observability stacks.
This guide explores how Host sFlow works in practice, covering setup, configuration, and practical usage tips to help you build a clearer picture of network and system behaviour across your environment.
About sFlow
The sFlow standard is a message format; it isn’t a piece of software or a list of guidelines on how to generate an sFlow report. The implementation of an sFlow collector is up to each individual developer. However, there are sFlow programs out there, including collectors and device agents. Some are produced by the manufacturers of network devices and are loaded into the firmware, while others are independent. Other sFlow collectors are integrated into packet sniffers, such as Wireshark.
The standard is maintained by a not-for-profit organization called sflow.org. The organization is run by the IT industry, with major manufacturers, such as Alcatel-Lucent, HP, and Hitachi contributing resources.
The sFlow standard was created by InMon Corp, and the company assembled the sFlow.org board along with its rivals to make the standard an industry-wide system rather than a proprietary solution. This enables the standard to be adopted by more device creators without the worry of handing a competitive advantage to a rival producer.
The name “sFlow” stands for “sampled flow” and the system was intended to rival the NetFlow system that was developed by Cisco Systems. NetFlow is widely used by network device producers and so is its vendor-independent successor, IPFIX. Many network traffic monitors have the capabilities of receiving sFlow messages as well as IPFIX, NetFlow, and the J-Flow format created by Juniper Networks.
The protocol is a Layer 2 system, which means that it operates on frames rather than packets. It operates on switches rather than routers.
About Host sFlow
Host sFlow is managed by sflow.net, an offshoot of sflow.org, and it is an open-source project. Just like sFlow, Host sFlow is available for use by anyone without payment. However, while sFlow is a standard, Host sFlow is an actual piece of software that you can download for free.
The idea behind Host sFlow is that it assembles an MIB to send out on request. It isn’t a collector, it is a generator. So, you would need to have a collector somewhere on the network. That program will send out a request for a report, and the Host sFlow sends back its MIB. In between requests, the daemon keeps checking on the various factors needed to fill in and update the fields in its MIB so that the next time it receives a request, the MIB contains new and up-to-date information.
To use Host sFlow, you need to install the Host sFlow program on your server and also have a monitoring tool that can collect the MIB. If you don’t have an sFlow-capable monitor running, it is a waste of time to install the Host sFlow program.
Where to install Host sFlow
The Host sFlow software is available for AIX and Free BSD Unix, RHEL, CentOS, Rocky, Fedora, Debian, Ubuntu, and Cumulus Linux. It will also run on Windows and Windows Server. You can run it along with your Docker software, and there is a special build for Citrix XenServer and Citrix XenCloud.
As well as Docker and Xen, the Host sFlow service can report on Hyper-V, KVM, and Nutanix AHV, but not VMware.
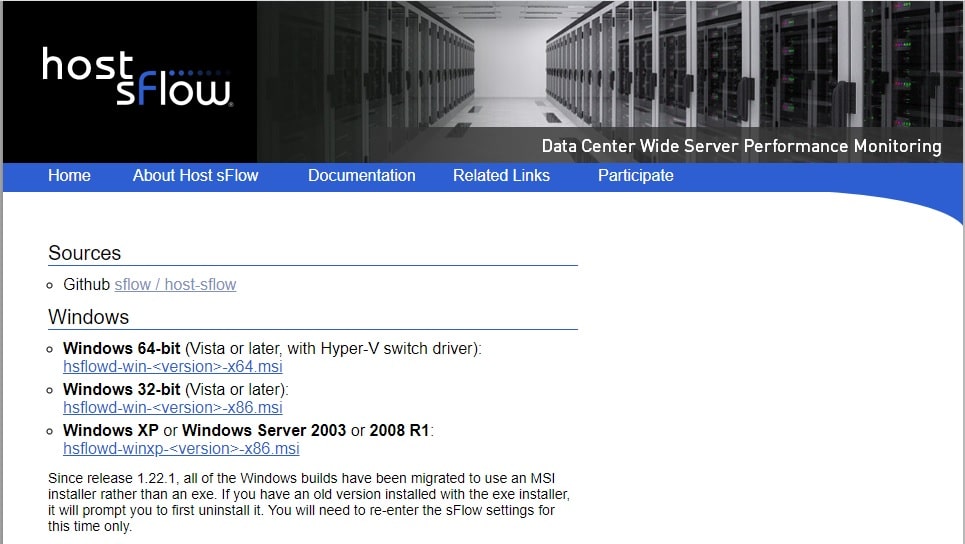
Where to get Host sFlow
The sflow.net website has a Download page. This is the source for the installer that gets you Host sFlow on Windows. The service is also available on GitHub. The repository contains an sFlow implementation as well as the Host sFlow adaptation.
Installation instructions
Install on Windows
Get the version of the installer for your version of Windows from the sflow.net Download page.
- Once the MSI file has been downloaded onto your computer, click on it to run it.
- Click on the Next button through the setup wizard, agreeing to the License Agreement as you pass through that page.
- Finally, click on the Install button, when it is presented.
- When the User Access Control challenger appears, click on Yes.
- Click on Finish.
The installation process is very quick. You don’t have to start or stop the daemon – the installer starts it up and sets it up to start whenever you start up the computer. You can open the Task Manager and search for sFlow. The Host sFlow Agent should be displayed as a background process.
Install on Linux
Unlike many Linux utilities, you can’t install this tool directly by connecting to the GitHub repository. Instead, you have to download the relevant RPM from the sflow.net Download page for your Linux distro.
RHEL, CentOS, and Fedora all install off the same file. There is a special file for NVidia GPU monitoring and a separate RMP for RockyLinux. In the commands below, x.rpm represents the name of the installer file that you downloaded, so put in the real name instead when you run:
sudo yum install x.rpm
sudo systemctl enable hsflowd # or chkconfig --add hsflowd
sudo vi /etc/hsflowd.conf
sudo service hsflowd start
For Debian and Ubuntu, download the relevant DEB and then run the following, substituting the actual DEB file name for x.deb:
sudo dpkg -i hsflowd_<version>.amd64.deb
sudo systemctl enable hsflowd # or update-rc.d hsflowd defaults
sudo vi /etc/hsflowd.conf
sudo service hsflowd start
Host sFlow settings
By default, the Host sFlow system uses the destination IP address and other factors, such as polling frequency and sample size from the DNS-based Service Discovery system, so you should leave that as the default setting when installing on Windows – the issue doesn’t arise in the Linux installation process.
You can adapt the settings later. You should always leave the default port as UDP 6343 because that is where any sFlow-enabled collector will look.
It is easier to change the Host sFlow settings on Linux than on Windows, and the Linux configuration mechanism provides many more options than the Windows version.
HostsFlow settings on Linux
In any Linux distro, look at the file /etc/hsflowd.conf. This is where you set up the configuration of your implementation. The format for a configuration statement is:
sflow{

}
The settings that you want should be written between the curly brackets ({}). Here are some examples of the types of settings you can specify.
To use the default settings laid down by the DNS-SD system, your configuration file should have the statement:
sflow {
  dns-sd { domain = <yourDNS>.com }
}
To specify a destination IP address for the collector, write:
sflow {
  DNSSD = off
  collector { ip = 999.999.999.999 }
}
In the above case, substitute the destination address for 999.999.999.999.
You can list many settings within a single sflow statement, simply by adding multiple lines between the brackets. It is also possible to have multiple collectors in one configuration file.
Annoyingly, sflow.net doesn’t produce a definitive list of configuration keywords – some have sub-options. However, there is a sample hsflowd.conf file in the GitHub repository, which gives the following examples, all commented out initially:
# hsflowd configuration file
# http://sflow.net/host-sflow-linux-config.php

sflow {
  # ======  Agent IP selection ======
  # Selection is automatic, unless:
  # (1) override with preferred CIDR:
  #   agent.cidr = 192.168.0.0/16
  # (2) Override with interface:
  #   agent = eth0

  # ====== Sampling/Polling/Collectors ======
  # EITHER: automatic (DNS SRV+TXT from _sflow._udp):
  #   DNS-SD { }
  # OR: manual:
  #   Counter Polling:
  #     polling = 30
  #   default sampling N:
  #     sampling = 400
  #   sampling N on interfaces with ifSpeed:
  #     sampling.bps_ratio = 1000000
  #     sampling.100M = 100
  #     sampling.1G = 1000
  #     sampling.10G = 10000
  #     sampling.40G = 40000
  #   sampling N for apache, nginx:
  #     sampling.http = 50
  #   sampling N for application (requires json):
  #     sampling.app.myapp = 100
  #   collectors:
  collector { ip=127.0.0.1 udpport=6343 }
  #   add additional collectors here

  # ====== Local configuration ======
  # listen for JSON-encoded input:
  #   json { UDPport = 36343 }
  # PCAP+BPF packet-sampling:
  #   Bridge example:
  #     pcap { dev = docker0 }
  #   NIC example:
  #     pcap { dev = eth0 }
  #     pcap { dev = eth1 }
  #   All NICs example:
  #     pcap { speed=1G-1T }
  # NFLOG packet-sampling:
  #   nflog { group = 5  probability = 0.0025 }
  # ULOG packet-sampling:
  #   ulog { group = 1  probability = 0.0025 }
  # PSAMPLE packet-sampling:
  #   psample { group=1 egress=on }
  # PSAMPLE config via tc:
  #   dent { sw=on switchport=enp.* }
  # packet drop monitoring:
  #   dropmon { start=on limit=50 }
  # Nvidia NVML GPU monitoring:
  #   nvml { }
  # Xen hypervisor and VM monitoring:
  #   xen { }
  # Open vSwitch sFlow configuration:
  #   ovs { }
  # KVM (libvirt) hypervisor and VM monitoring:
  #   kvm { }
  # Docker container monitoring:
  #   docker { }
  # TCP round-trip-time/loss/jitter
  #   tcp { }
  # monitoring of systemd cgroups
  #   systemd { }
  # DBUS agent
  #   dbus { }
  # Learn config from Arista EAPI
  #   eapi { }
}
You can use the sample configuration file and uncomment the lines that you need or store the file as a reference and just build a new, clean configuration file that contains only the lines that you need.
Changes to the configuration file won’t take effect until you start the agent again. To stop the agent, use:
sudo service hsflowd stop
To start it again, use:
sudo service hsflowd stop
Host sFlow settings on Windows
On Windows, instead of using a configuration file, Host sFlow inserts keys in the registry. So, you will need to open the Registry Editor to see them or change them. Type reged in the Start search bar to get access to it.
Go to HKEY_LOCAL_MACHINE\SYSTEM\CurrentControlSet\Services\hsflowd\Parameters to see the current settings for your implementation.
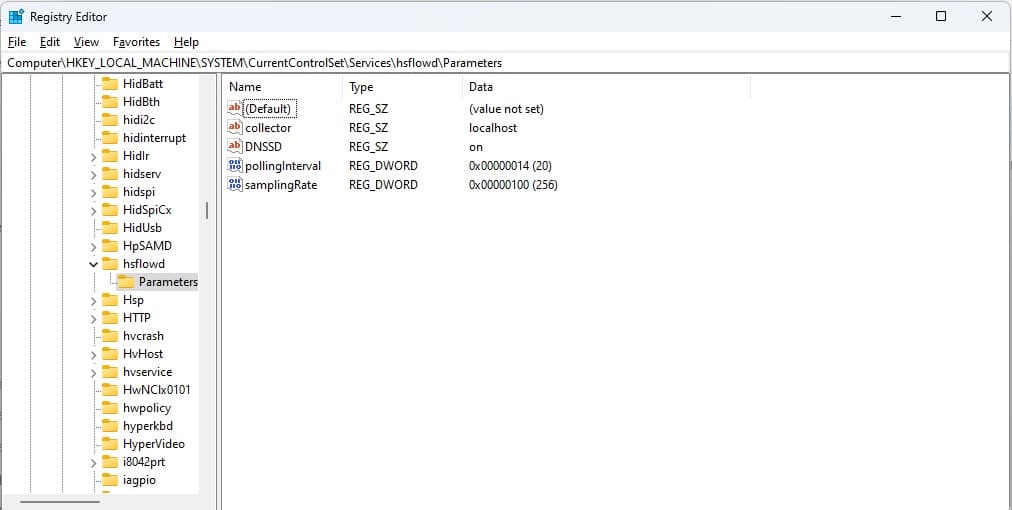
In the example shown above, all of the parameters for the Host sFlow system are managed by DNS-SD. So, unless the value of that parameter is changed to off, the other values in the screen are ignored.
The sFlow MIB
The sFlow agent constantly scans the device that hosts it. The discoveries of this scan are recorded in a structure called a Management Information Base (MIB). The sFlow MIB was taken directly from the definition of the MIB in the Simple Network Management Protocol (SNMP) v2.
Ordinarily, an sFlow agent would be resident on a network switch. However, the purpose of the Host sFlow unit is to extend this capability to servers. The Host sFlow agent can also gather operating data on applications.
The strengths of Host sFlow
Servers and applications routinely generate log messages to inform systems administrators of operating conditions and errors. So, Host sFlow is just duplicating this effort. However, if your network manager already has an sFlow collector in place, running Host sFlow can get your physical and virtual server status reports and application running statuses channeled into that single monitoring tool.
The sFlow system isn’t as widely used as its older counterpart, NetFlow. However, the extension of the uses for sFlow with programs such as sFlow strengthens the appeal of using this vendor-neutral standard for system operating data collection.
The weaknesses of Host sFlow
Although the producers of Host sFlow explain that it can collect operating data for containers, such as Docker, and for virtualizations, the capabilities of the tool have some serious gaps. It can’t record Kubernetes settings, and although it can interface with Hyper-V, Nutanix, KVM, and Citrix systems, it has a blindspot for VMware.
The Host sFlow system is an attempt to channel server and application monitoring data into a network monitoring system. However, the majority of network performance monitors focus on gathering statistics with SNMP, which can also be used on endpoints as well as network devices. Monitoring system vendors usually hive off traffic analysis functions into a secondary module, and it is those tools that can collect data with sFlow.
Most businesses are more likely to have the capability to collect SNMP data than sFlow data. Also, the importance of collecting, storing, and searching through log messages has increased since the creation of data privacy standards, such as GDPR, HIPAA, and PCI DSS. These standards dictate that all log messages must be collected and stored; they don’t demand that sFlow data be collected. Host sFlow duplicates the efforts of log managers that feed data into SIEM systems.
So, of the three possible methods of collecting operations data from endpoints: log files, SNMP, and Host sFlow, the Host sFlow option is the least important and therefore, the least likely to be implemented.
Working with sFlow collectors
Implementing sFlow data exchanges is fairly straightforward. As with SNMP, all of the controls and timing issues are managed in the collector, not in the agent. This is particularly true if you stick with the DNS-SD method of configuring Host sFlow because this technique can help coordinate agents on multiple endpoints on a network, ensuring that a monitoring tool gets data from all endpoints at the same time.
Several tools can collect and represent Host sFlow data. Some of these tools are free and many can present the collected data in graphical format, such as charts and graphs.
Recommended sFlow collectors
Take a look at the following tools for collecting data from Host sFlow agents.
- ManageEngine NetFlow Analyzer (FREE TRIAL) A network traffic monitoring and bandwidth analysis tool. It supports sFlow export from multi-vendor devices and provides real-time visibility into bandwidth usage, top talkers, applications, QoS, and more. The software can also capture full packet headers for L2–L7 analysis. So it is perfect for traffic forensics and drill-down reporting while remaining lightweight compared to NetFlow. The tool integrates with the broader ManageEngine suite and is available for Windows. Get a 30-day free trial.
- Wireshark is a packet sniffer that has its own filtering language. Those filters can be applied to packets as they are read, which reduces the amount of data that gets read. The filters can also be used for packets already displayed in the data viewer. Some filters specifically relate to sFlow and you can interpret field values to identify whether the source of each message is a switch or a server. Download this free tool for Windows, macOS, and Linux.
- Site24x7 is a cloud-based SaaS package that is part of a platform of system monitoring and management tools. The system installs its own agent on each site this going to be monitored and that acts as an sFlow collector, uploading records to the cloud server for processing. You can get the tool on a 30-day free trial.
- Paessler PRTG is a flexible package of sensors, and you decide which to activate. The collection includes an sFlow collector. The tool is available as an on-premises software package for Windows Server, and there is also a cloud-based SaaS option. Get either package on a 30-day free trial.
- SolarWinds NetFlow Traffic Analyzer can collect NetFlow, IPFIX, J-Flow, and NetStream messages as well as sFlow. It will get your Host sFlow messages along with the network device sFlow data. This tool can be set up to raise alerts if performance issues occur. This is a software package for Windows Server and you can get it in a 30-day free trial.
