
Riemann is a real-time monitoring system built around an event-driven architecture, designed to help IT teams observe and react to changes in infrastructure as they happen. Rather than relying on traditional polling-based monitoring, it processes streams of events, offering a more immediate and flexible way to understand system behaviour.
This approach makes it well suited to modern, fast-changing environments where infrastructure, services, and applications generate continuous streams of data. By collecting events, metrics, and logs from across a system, Riemann provides a live view of operational health and performance.
Data can be aggregated from a wide range of sources, including servers, applications, network devices, and distributed services. Once ingested, this information can be processed in real time using custom rules that define how events should be evaluated, filtered, or escalated.
One of Riemann’s key advantages is its adaptability. Instead of enforcing a fixed monitoring structure, it allows users to design their own event-processing pipelines, tailoring alerting logic and workflows to match specific operational requirements. This makes it suitable for everything from simple server monitoring to complex distributed systems.
Riemann also integrates with many existing tools and platforms, enabling it to function as part of a broader observability stack rather than a standalone system.
This guide introduces the basics of Riemann, including installation, configuration, and practical setup considerations, helping you build a responsive monitoring system aligned with your environment.
A Brief History of Riemann
Riemann had its first stable release in March 2012 with version 0.1.0. The system is named after Bernhardt Riemann, but he didn’t write it. Riemann was a German mathematician who was active in the mid-1800s. The Riemann system was created by Kyle Kingsbury and developed in collaboration with a few friends. The Riemann system has now evolved into an open-source project with its repository on GitHub.
The Riemann system is written in Clojure, an obscure programming language that is a variation of Lisp. Clojure was first created in 2007, specifically to provide a Lisp programming system that is compatible with Java. The Riemann system runs on a Java Virtual Machine (JVM).
The purpose of Riemann is to collect operating statistics from computers. This would make it like StatsD or collectd, however, this data collection system can process statistics and branch to actions. Those actions can be notifications of problems or a transfer of data in a stream to a third-party tool. In short, Riemann doesn’t just collect and forward data, it also manipulates it.
How does Riemann Work?
The Riemann system queries server statuses. That is, it gathers statistics on resources, which includes their total capacity and current utilization. This data can be segmented per attribute, for example, CPU usage per process. It can then also be summarized, so you can get a total figure for CPU usage as well as per process.
Riemann can examine many attributes and statuses of a server, which, in the terminology of the system, are called “events”. That term clashes a little with the name of Windows Events. These are not the same thing because Windows Events are log messages, whereas a Riemann event can be just a regular factor of a computer, such as total disk space, and does not necessarily relate to an operational problem.
The Riemann process can assemble streams of data and send them to monitoring packages via Graphite. The streams don’t have to end up in Graphite but can be bounced through that system as a forwarder to a third-party tool that can take Graphite-formatted data. It is possible to get data from Riemann passed into Splunk in this way.
The Riemann service is particularly strong at raising alerts and sending notifications. The program can be set up to interface with email systems and communication applications, such as PagerDuty. This notification feature means that it is possible to compose system monitoring features entirely within the Riemann environment. However, you would still have the task of producing a display of data to enable notified technicians to analyze recent events and deduce the cause of the notified problem. This can be achieved with a dashboard template that is part of the Riemann suite of programs.
Riemann Architecture
The Riemann system creates a stream for an event. In this terminology, an event is a status change, which could be provoked by a query, such as a scheduled polling of CPU utilization. Or it could be provided by a status on the device, such as the Wi-Fi connection being lost.
As they have different triggers, it isn’t possible to get all stream updates in lockstep, so each stream is treated as an individual series. However, each stream will always have a current value to refer to. While some streams get frequent updates to their current values, others might retain the same values for a long time.
To summarize, a stream is a pipeline for a series of updates on the same factor. An event is an instance of that factor, like the current readout of a resource level.
There are three elements of Riemann:
- Client Collects data
- Server Processes data
- Dashboard The console for defining a project and displaying stream values
The dashboard provides the easiest way to communicate with the client and server when you are creating a project.
Riemann Client
The client is a collector and acts as an agent on each device. You can process many streams with one client. The stream is a pass-through, and it doesn’t retain the current state of the data that is channeling, in other words, it doesn’t store the last value it received. Instead, Riemann uses a database called the Index, to which the current value of a stream is written and constantly overwritten, providing the latest available value.
Riemann Server
The server receives a stream from a client and processes the data in some way. This action can be a calculation to generate an alert, a formatting action to forward data to another tool, or the creation of a derived metric that involves comparing elements from different streams.
Riemann Dashboard
The dashboard is an interface to the Riemann system, and you can use it to set up streams and define the actions of the server. The dashboard also provides a display of all the streams processed by a server.
As a rule of thumb, you can think of their being a one-to-one relationship between a dashboard and a server. There can be many clients feeding into each server. If you have multiple servers, you would need to connect the same dashboard template to each server in turn, build a different dashboard for each server if those servers present different streams, or create a server of servers to aggregate data into one location. For example, you could have a server on each site and then aggregate those servers into one central server for centralized monitoring.
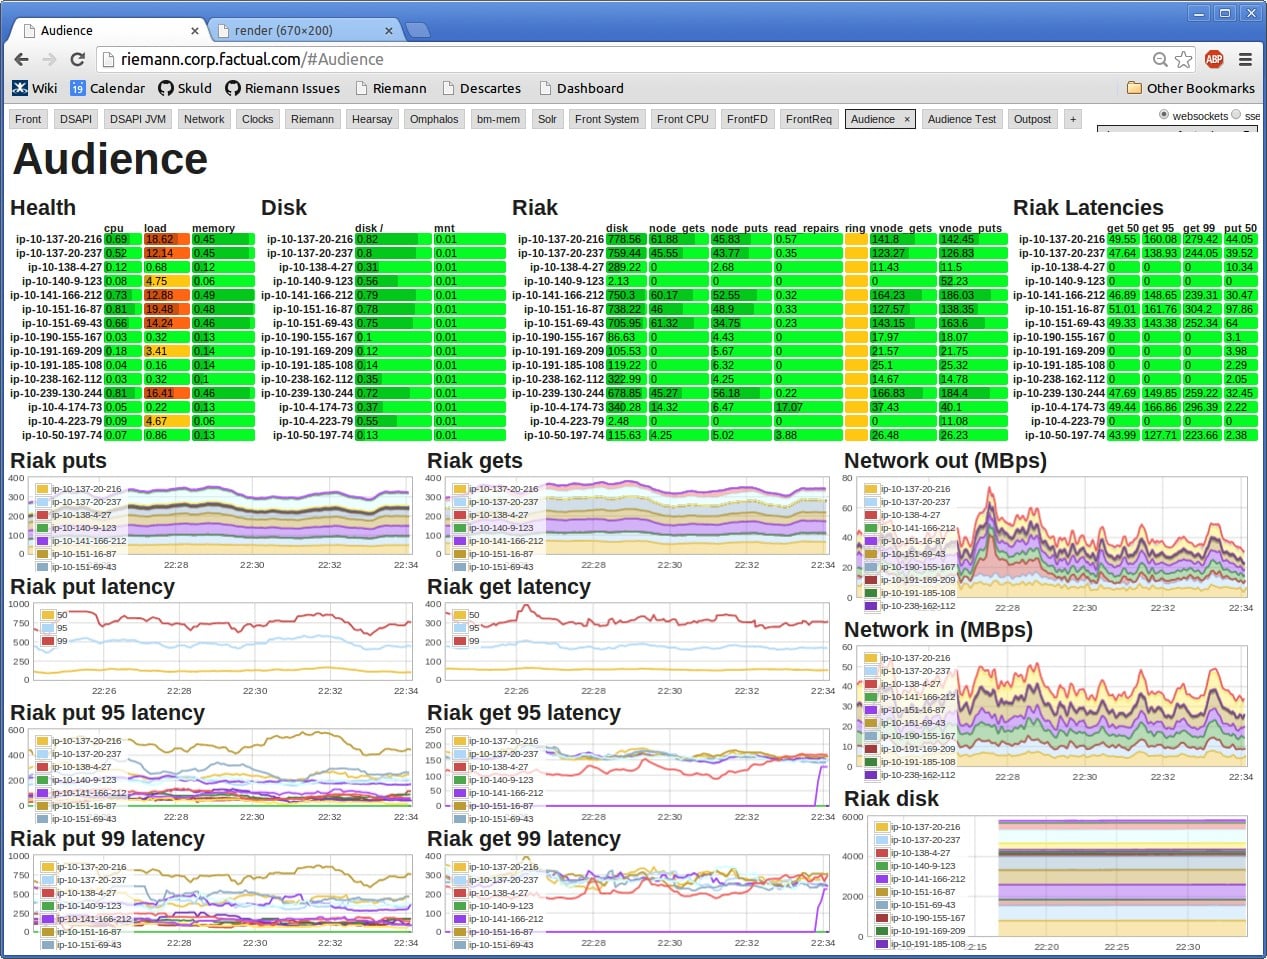
The image above shows an example of a dashboard. Each block on the page shows the output from a specific stream. The user has to set up this page, specifying the data source and display format for each panel.
Where to get Riemann
The source code for Riemann is available in a GitHub repository. The system is only available for Linux. At the command prompt, use the following commands to get the code in a tar file, unpack it, and install the Riemann system.
$ wget https://github.com/riemann/riemann/releases/download/0.3.8/riemann-0.3.8.tar.bz2
$ tar xvfj riemann-0.3.8.tar.bz2
$ cd riemann-0.3.8
The above actions get you the server program. The whole Riemann system hangs off the configuration file. This also acts as the executable for the system. You need to run the server before acquiring and installing the other elements of the suite, which are the client program, the dashboard, and the server utilities. Run the following:
$ bin/riemann etc/riemann.config
$ gem install riemann-client riemann-tools riemann-dash
With these actions, you have installed Riemann. You now need to set the system up, defining streams to run through clients to a server and onto the dashboard.
Running Riemann
Riemann provides a utility that is part of the riemann-tools package that you installed, called riemann-health. This sets up streams and clients and every element needed to monitor the significant resource of the computer on which the Riemann suite is installed. If you no longer have the server running, start it up again. To start the riemann-health service, just run:
$ riemann-health
Now Riemann is processing data in the background and you will be able to look at the data through the dashboard. However, first, take a look at alternative outputs because this will confirm that the riemann-health service is actually picking up useful data.
Riemann writes each event to a log file. The logs for Riemann are kept in /var/log/riemann/ and the default file name is riemann.log – both of those defaults can be changed in the configuration file. To look at the log file and ensure that it is racking up records, run the following:
$ tail -f /var/log/riemann/riemann.log
The records that you see in the log file will help you get a feel for the loot of a typical Riemann log message.
Riemann Dashboard
The Riemann dashboard is a service and a page. You need to start up the service and then go to a browser and open up the Homepage for the dashboard. Run the following command:
$ riemann-dash
This exercise will just give you a feel for the dashboard’s capabilities. You will need to spend a lot more time in this system because you can use the dashboard to set up clients. You can also assemble a monitoring system from this utility.
For now, we have the riemann-health daemon running. You saw that this was generating log messages, now you can see how the dashboard interprets the data from that utility. Later, you will use the experience of this exercise to expand your knowledge and build your own clients and screens.
If you have taken a break from this guide, start up the Riemann system, the dashboard, and the riemann-health daemon again before proceeding. Open a browser and use the address http://localhost:4567/ – you will notice that this is HTTP and not HTTPS.
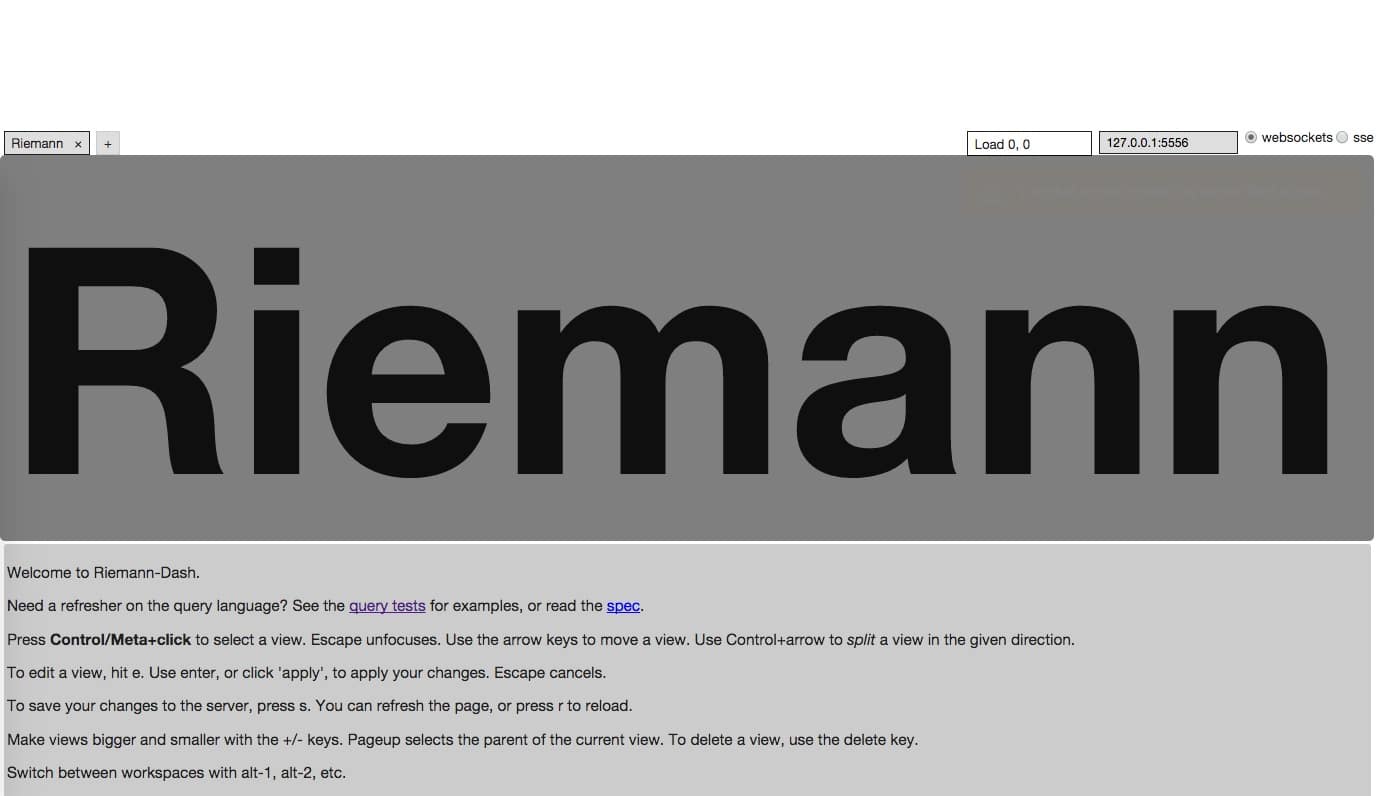
The page is not so impressive. However, this is just the initial view, and you can get access to the data that Riemann-health is pumping out by changing to the Grid View. To do this:
- Press CTRL and click on the big Riemann title – this selects it and the panel will turn dark gray.
- Type e to edit the panel. This brings up a popup panel.
- Set the type dropdown field at the top of the panel to Grid
- Enter true in the Query box
- Click on Apply
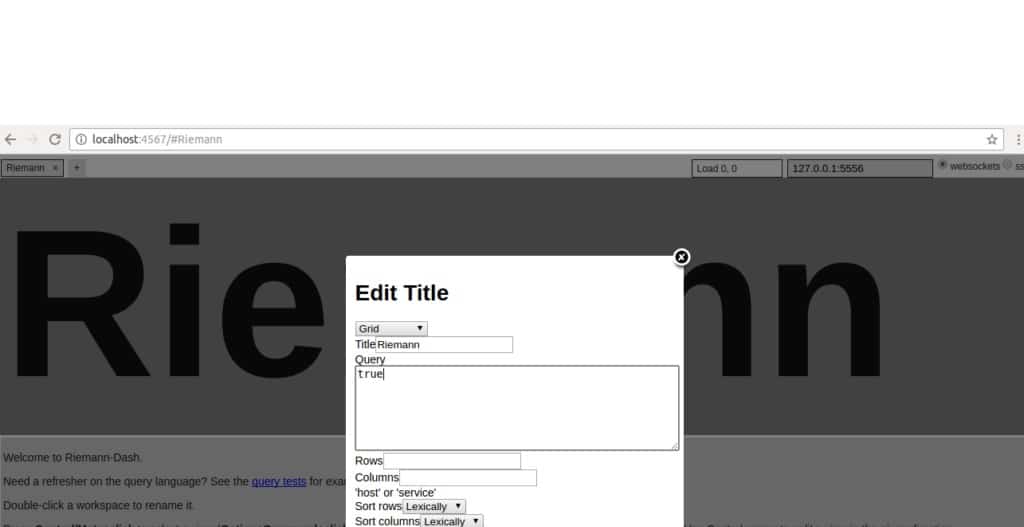
The title panel will now be replaced by a table. The data that is arriving from the riemann-health daemon should be shown in this grid. The true value that you put in the Query panel of the setup screen equates to saying “show all stats”.
You can press the + key repeatedly to get the display to grow bigger.
Some members of the Riemann community develop their own utilities and make them available to others. You can check out Anthony Galea’s console utility that replaces the standard Riemann dashboard.
Create a Riemann Client
You set up a stream by defining a new client. This can be done at the command prompt by using the Interactive Ruby utility (IRB).
Another option is to use the Riemann Java Client.
The exact syntax for each of these methods is different, so it is recommended that you study the GitHub pages of each for details on how to create a client for Riemann.
The Riemann Quick Start Guide shows an example of setting up a new client with the IRB method.
Integrating Riemann with Third-Party Systems
If you don’t want to use the Riemann Dashboard and you already have a monitoring system that you prefer, you can use Riemann to compose your own custom metrics and send them to that third-party commercial tool.
Riemann provides a list of APIs that will forward streams to specific monitoring services. These include:
- Amazon Cloudwatch riemann.cloudwatch
- Datadog riemann.datadog
- Druid riemann.druid
- Elasticsearch riemann.elasticsearch
- Graphite riemann.graphite
- HipChat riemann.hipchat
- Kafka riemann.kafka – also enables Kafka data to be read into Riemann
- Keen IO riemann.keenio
- Librato riemann.librato
- Logstash riemann.logstash
- Nagios Core and Nagios XI riemann.nagios
- Ops Genie riemann.opsgenie
- PagerDuty riemann.pagerduty
- Prometheus riemann.prometheus
- Slack riemann.slack
- Telegram riemann.telegram
- Twilio riemann.twilio
- VictorOps riemann.victorops
- Zabbix riemann.zabbix
You can also create a mailer to forward alerts by email with riemann.email. Data can be sent to Riemann by collectd with the plug-in write_riemann. This can be an option to pass through collectd data. For example, Datadog doesn’t accept data from collectd but a link could be forged by channeling data through Riemann.
The Strengths of Riemann
Riemann provides the combination of a data collector, a data analyzer, and a data display interface, which makes it a lot like the Elastic Stack combination of Logstash, Elasticsearch, and Kibana. Here are some of the strengths of the Riemann package.
- Free and open source There is no paid version of Riemann, so you won’t find that the useful features that you read about have been fenced off into a Premium edition.
- A self-assembly monitoring tool You don’t need to thread together many tools from different providers to create a decent customized system monitoring tool.
- Interfaces with third-party tools Although you can create a full monitoring tool with just Riemann, the option to exchange data with other monitoring systems is available.
- Can monitor any technology This tool can be set up very quickly to monitor servers, however, it can gather any information that can be delivered to a server, so it will monitor networks and applications as well.
- Ruby or Java The extensions available for this system enable an administrator to set up streams and display screens through the use of Ruby utilities or Java programming, as well as a GUI interface for setup.
The Limitations of Riemann
Riemann isn’t the only free data collector or monitoring system available, it has several very powerful rivals, such as the Elastic Stack. Paid monitoring tools, such as Datadog, Site24x7, and SolarWinds Security Event Manager can accept feeds from a list of data collectors to customize information gathering. When considering Riemann for your system monitoring tool, remember these points:
- Technical setup You need programmer skills to get a full monitoring system set up with Riemann.
- Linux only There is no Windows version of Riemann
- No professional support You can ask the user community for help but it isn’t possible to take out a support contract. If your business insurance cover demands that you get guarantees and support with your software, you won’t be able to use Riemann.
- Small user community Some free monitoring systems have very large user communities and very active message boards where you can quickly receive help for your problems. Riemann isn’t very widely used, so you are largely on your own if you hit a snag.
Investigate Riemann
Riemann is an appealing system because it is free and if you have the right mix of skills, you can get the tool to monitor just about anything. It is primarily a server monitoring system, and its ability to feed alert notifications through to systems such as Slack means that you can set it up to let your staff know as soon as a server issue arises.
You should assess Riemann as an option for your self-built monitoring system. Compare it to Graphite, Prometheus, and Elastic Stack to see which option is best for your team.