

When you read about system monitoring tools, one name comes up quite often: Grafana. You will see tools such as Prometheus, Graphite, Icinga, and Sensu explaining that you should use Grafana as a user interface. So, this is a flexible tool that can interact with several different data sources.
Grafana isn’t just a good interface for system monitoring tools. It can also be used to provide a GUI for statistical and market analysis systems. In addition, the package includes methods to sort through large amounts of data facilitated by a query language.
About Grafana
Grafana is very similar to Kibana, and this should come as no surprise because Grafana was developed from the code of Kibana. The Kibana system is a graphical user interface for the Elastic Stack, also known as ELK, after its three main components – the K in ELK stands for Kibana.
Kibana is an open-source project and is free to use. In 2006, travel industry aggregator, Orbitz, developed its own data processing system, called Graphite. In 2014, the front-end for Graphite was redeveloped by taking a copy of the Kibana code and copying it. This new GUI was split out of the Graphite project to create a particular product.
The code for Grafana was originally developed by Torkel Ödegaard, who based his work on Kibana version 3. The Grafana system has evolved and is now in version 8.0.3. Orbitz created a separate organization to manage the tool, which is released as an open-source project. That means anyone else can get the code and build their version, much as Orbitz did with the Kibana code.
The business that now runs Grafana is called Grafana Labs. It still maintains and develops the free, open-source version of the tool, but it now has two paid products that build extra features on top of the free Grafana. In short, it can be said that Grafana has three editions: Community Edition, Grafana Enterprise Stack, and Grafana Cloud. Grafana Cloud is the same as Grafana Enterprise Stack, but it is hosted as a SaaS platform.
Grafana modules
Grafana is both the name of a tool and a family of products. The full pack includes complimentary tools that enhance Grafana and expand it from an interface into a complete monitoring system.
Those units are:
- Grafana is a system that lets you query time series and relational databases and links them to visualizations in a Web-based interface.
- Graphite A service that collects and stores time-series data plus tools to query and analyze stored information.
- Carbon-relay-ng This is an aggregator that receives, packages, and forwards data to feed into Graphite.
- Loki A log server and consolidator that stores and labels log data for searches.
- Metrictank A time-series storage platform for large organizations that use Graphite. This is a more efficient way to store data for Graphite than that tool’s built-in data management system.
- Prometheus This monitoring tool wasn’t created by Grafana Labs, but it contributes to its ongoing development. Prometheus is promoted with Grafana as its front end.
- Tanka This is a configuration manager for Kubernetes clusters.
- Tempo This is a distributed tracing tool that can work with a range of telemetry standards, including Jaeger, Zipkin, and OpenTelemetry. Distributed tracing tracks the statuses of running microservices, and it can also be used to test Web applications under development.
- K6 This is a testing service for code under development, and it is categorized as a continuous profiler. K6 data can be fed into Grafana or other monitoring tools, such as Datadog and New Relic.
Why use Grafana
Grafana is a flexible system that can be used for just about any data analysis and display scenario. The downside of flexible services is that you have to do precisely what you want to do with them and spend a lot of time setting up your customized system. However, not many IT departments will allocate staff hours to such a project, so you would probably end up just buying the equivalent off-the-shelf package that caters to what it is you want to do.
If you can get data into a database from some source, you can use Grafana to sort through that data and display it in graphs. For example, the package can be used to show live time-series data, such as a network monitoring scenario, or it can analyze large pools of data, as you would with market analysis or capacity planning. Use it for anything.
Slotting a Grafana system together
Grafana extracts data and displays it. If you want to set up a Grafana system, you need to work out the following:
- What data you will watch
- Where that data comes from
- How you will shape that data
- How you will represent the data
- Whether you want automated notifications on some metrics
- What event would trigger an alert
- How will you define different data statuses
Take a look at the following screen for live Carbon Relay throughput data.
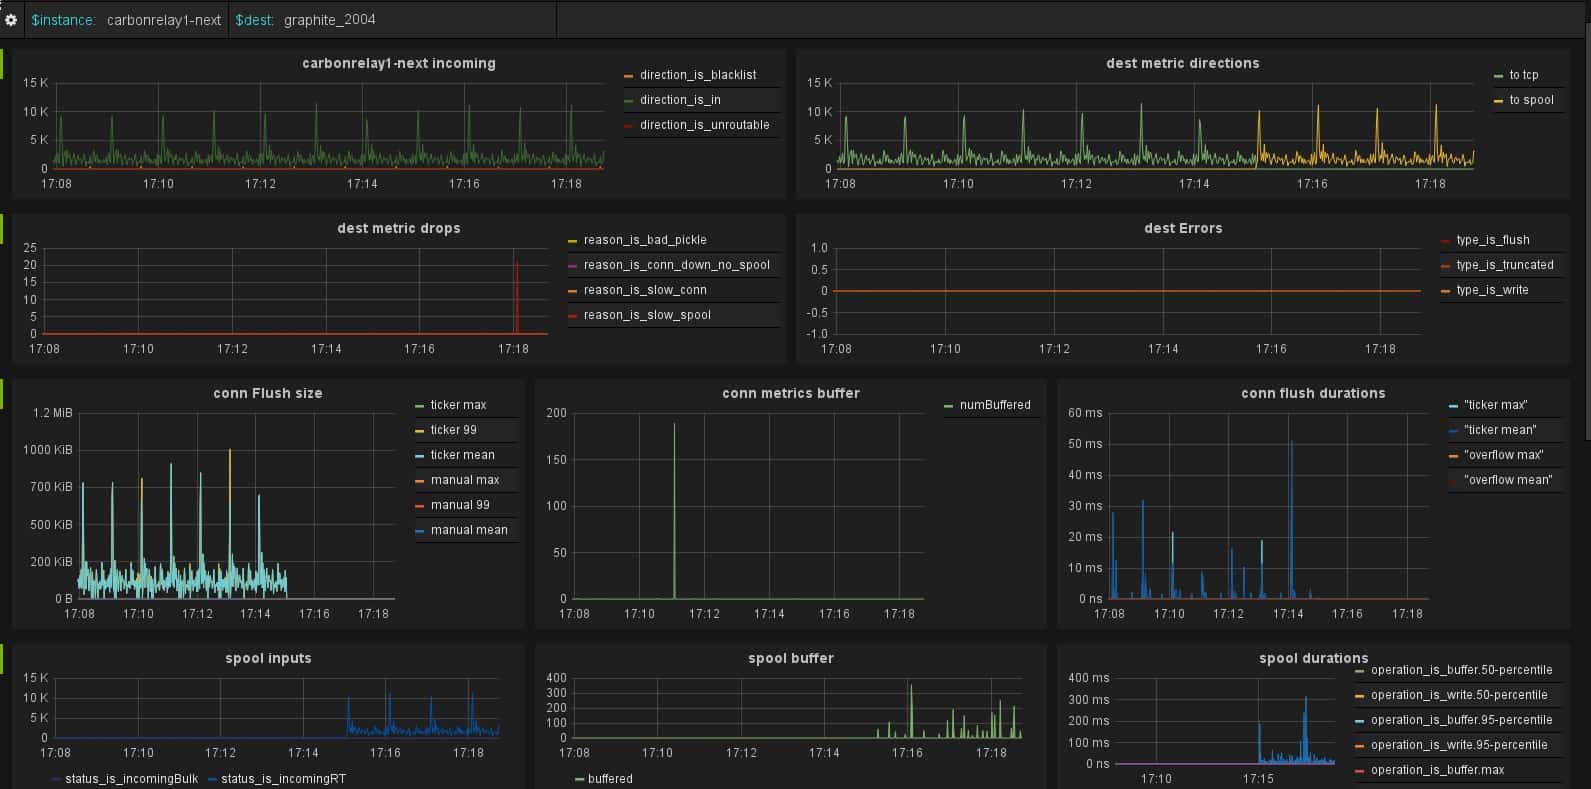
The screen looks great. However, someone decided what graphs to put on the screen and in which order, creating a data input requirement. Next, someone had to set up a data structure to hold the information shown and work out how to get data into those stores in the correct format and where to get it from. Someone also had to work out how to execute a query in Grafana’s scripting language to extract that data and link it to a display format. Then they needed to decide what colors the line graphs should use, which graphs should show multiple series together, and how to label each and title each graph.
A lot of work went into creating that screen shown above, and you would either need to hire someone who already has experience in creating Grafana systems or get training for one or two of your team members. Do you have the budget for that?
Grafana combinations for IT system monitoring
Probably the best use for Grafana is for those who want a system monitoring tool by putting Grafana together with Prometheus. The Prometheus project is impressive, and it takes care of a lot of the decisions you would otherwise have to make about where to get system performance data from and how to channel it through to Grafana.
Prometheus has a menu of data collectors that can easily be installed and activated, channeling live data to the central Prometheus data management system. The Grafana development team partially writes it; Prometheus slots together very quickly with Grafana.
If you have a lot of Web applications in your system, it would be a good idea to include Tempo in your monitoring system. If you run a CI/CD pipeline in a DevOps environment, you would probably need K6 for testing.
Combining Loki with Grafana would give you a log management system with live status reports on log message throughput, letting you see if an unexpected surge or drop in message throughput occurs. As well as just observing log management activity, you could search through log data as it comes in. Feed-in SNMP or NetFlow data, and you will have live network activity reports in there as well, creating a live SIEM system. You could also sort through a time window of stored messages looking for correlations.
Use Wireshark as a back end for Grafana to get network traffic analysis. Put Grafana on the front of Graylog to watch log management and security events. Use Grafana on your shop floor monitoring system or your call center task routing package.
Grafana prices
There are three editions for Grafana. The above review looked at the Community Edition, which is free to use and has no professional support service – ask other users for help in the community forums. However, this is not the only version available. There are:
- Grafana Open Source – This is the Community Edition
- Grafana Enterprise Stack – A paid version of the Open Source package
- Grafana Cloud – A hosted SaaS version of Grafana Enterprise Stack
Grafana Open Source is also known as Grafana OSS. It is entirely free to use and is available for Linux (Ubuntu, Debian, RHEL, CentOS, Fedora, SUSE, and Open SUSE), macOS, Windows, and Docker.
Grafana Enterprise Stack is a paid package of Grafana OSS products that includes professional support. The service is organized in different plans that tailor the Grafana system to specific uses by combining other modules. These are:
- Grafana Enterprise A flexible package that includes all of the units in the Grafana OSS stable plus professional support and proprietary plug-ins to feed data in from third-party tools automatically.
- Grafana Enterprise Logs A pre-configured combination of Loki and Grafana. This paid version adds a multi-tenanted option for MSPs, access controls for teams, and professional support.
- Grafana Enterprise Metrics A packaged and pre-configured combination of Prometheus and Grafana to create an out-or-the-box IT monitoring system.
- Grafana Enterprise Traces This is a distributed tracing system that is based on Tempo and Grafana. However, it also feeds in Prometheus data and logs from Loki.
Grafana Cloud is a SaaS plan that hosts Grafana Enterprise Stack. The packages available in this platform are the same as those offered in the Grafana Enterprise Stack editions:
- Grafana Cloud Dashboards is the hosted version of Grafana Enterprise
- Grafana Cloud Logs is the hosted version of Grafana Enterprise Logs
- Grafana Cloud Metrics is the hosted version of Grafana Enterprise Metrics
- Grafana Cloud Traces is the hosted version of Grafana Enterprise Traces
There is a Free tier Grafana Cloud that includes the Grafana interface with Prometheus limited to 10,000 data series, Loki with a limit of 10 GB of logs, and Tempo with 50 GB of trace data. This includes storage space, and it also substitutes as a free trial for the Grafana Cloud service.
Grafana Labs doesn’t publish a price list for its paid product. However, you can request a demo of Grafana Enterprise Stack.
Grafana strengths and weaknesses
Grafana’s most significant strength can also be its biggest weakness – it is a very flexible tool. Fortunately, taking one of the paid packages of Grafana cuts out all of the decision-making and development time that you would need to put together a monitoring system with all of the available free elements. We have deduced a list of good and bad points about Grafana:
Pros:
- The Grafana module can front any set of data you choose
- Grafana Enterprise Stack and Grafana Cloud package Grafana with helpful companions
- Grafana lets you create a customized dashboard
- Multi-tenanted option for MSPs
- Able to monitor multiple sites and cloud resources in one console
Cons:
- Self-assembly possibilities can be overwhelming
Five alternatives to Grafana
If Grafana Labs had left its tools as a do-it-yourself system, it wouldn’t get many takers in the corporate world. However, the packaged options offered through Grafana Enterprise Stack and Grafana Cloud save so much time that any business would be happy to pay the price for them. In addition, other options compete with Grafana, Grafana Enterprise Stack, and Grafana Cloud.
Here is our list of the six best alternatives to Grafana.
- Site24x7 Infrastructure Monitoring (FREE TRIAL) This monitoring system is able to integrate with a long list of technologies. It can gather statistics from servers, cloud platforms, virtualizations, and containers. The package includes the option to create automation triggers that can launch remediation actions. This mechanism can be used to send data to third-party tools or launch security measures. Get it on a 30-day free trial.
- Kibana This is the original package that Grafana was based on. Like Grafana Labs, Elasticsearch BV offers this tool free as a standalone system to link with data feeds yourself or as part of the Elastic Stack with Logstash to collect data and Elasticsearch from mining it. There is also a paid hosted Cloud SaaS version that puts it all together for you. Get a 14-day free trial of Elastic Cloud.
- Sematext This company provides a hosted Elastic Stack, and it has created specific packages that work to different requirements, like system monitoring and log management. Use this option to cut out all of the work involved in assembling your monitoring system—experience Sematext on a 14-day free trial.
- Splunk This popular free data representation tool is meant for log and traffic data, but it can be used for any data feed. The Splunk team has expanded on the basic free system to create a menu of paid, hosted services with options for on-site installation on Windows, macOS, Linux, and Unix. Get a 60-day free trial of the on-premises version (Splunk Enterprise) or a 14-day free trial of Splunk Cloud.
- MetricFire Like Sematext offers a hosted version of Elastic Stack; MetricFire has plans for hosting Grafana + Prometheus and hosted Grafana + Graphite. You can request a demo of either system.
- Datadog This is a paid SaaS platform that offers a wide range of system monitoring tools and has branched out into IT asset management packages. You can use Datadog to collect data and feed it into Grafana through a plug-in, or just use the excellent interface provided with Datadog. Get a look at this system with a 14-day free trial.

Nice job.
One of the more well put together tech comparison sites with more than cut and paste marketing fluff.
Thank you!
Sincerely,
Mark