
Graphite can be used to display any type of data that is stored in a time-series format. For example, it fed in metrics collected from your network. You can get a graphical display of those indicators, provide in CPU utilization levels second by second, and you can get that information shown as a graph.
Datadog shows live IT system performance information and resource data in graphs and charts. It is offered in a series of modules, each monitoring a different part of an IT system, such as the network or applications.
You can use either Graphite or Datadog to monitor your IT services. However, the one that is right for you greatly depends on the size of your business, the technical skills you have to hand, whether you want an off-the-shelf solution or a system you can build yourself, and what budget you have.
Graphite offers you a toolkit to process any type of data. First, you need to work out a design for the console of your Graphite-based monitoring system and then work out how to feed system data into it and analyze that data into a suitable format to provide into the frontend.
Graphite highlights
Graphite was created by Orbitz Worldwide, Inc., the travel sector aggregator, in 2006. The package is what is known as a complex event processing (CEP) system. This type of system takes a stream of data as an input, and it extracts categories of information, notably looking for changes in values. This is a suitable method for tracking metrics such as temperature reports or processing activity, such as throughput rates or utilization levels.
Key Features:
- Versatile Data Processing: Capable of handling any time series data source, making it adaptable for various use cases.
- Open-Source Flexibility: Allows for free use and modification of the source code, fostering innovation and customization.
- Widespread Adoption: Utilized by notable corporations like Orbitz, the Washington Post, and Ford Motor Company, showcasing its reliability and scalability.
Orbitz released its CEP as an open-source system that anyone can use. This event occurred in 2008. The package was named Graphite, and it has been used for a range of purposes by companies, including Hive Streaming, EA Games, GitHub, and Etsy.
Pros:
- Open-Source Platform: Provides complete transparency and the freedom to modify the platform according to specific needs.
- Data Versatility: Supports a wide range of data types, enhancing its functionality as a time-series database.
- Native Data Visualization: Offers the capability to monitor and view data directly within the system through built-in graphical tools.
- Strong Community Support: Benefits from a large and dedicated community, ensuring a wealth of knowledge and resources.
Cons:
- Support Limitations: The open-source nature may present challenges in finding specialized support for larger enterprises.
- Analysis-Centric: Focuses heavily on data analysis, which may not fully meet the needs of users seeking comprehensive monitoring solutions out of the box.
Graphite isn’t explicitly written to monitor IT systems. However, it will create graphs for any data series that is fed into it. This is why it can be used for tasks such as tracking network and server performance.
Datadog highlights
Datadog, Inc started operation in 2010 with the code for a monitoring system that its founders had acquired from Server Density. Those founders still run the business – Olivier Pomel is its CEO, and Alexis Lê-Quôc is its CTO. Datadog went public in 2019 with a listing on NASDAQ. The company is headquartered in New York City with offices on 5th Avenue. Datadog also has offices in Boston and Baltimore and a research center in Paris, France.
Key Features:
- Comprehensive Monitoring: Provides extensive monitoring solutions for IT infrastructure, applications, web services, and cloud systems.
- Security and Compliance: Features SIEM-like security monitoring and a vulnerability scanner for comprehensive threat management.
- DevOps Integration: Offers a bug tracking service tailored for DevOps teams to streamline development workflows.
- Incident Management: Supplies a detailed incident management package for help desk teams, enhancing response strategies.
Datadog has developed rapidly. It rewrote the original code for the monitoring system in 2018, changing it from a Python codebase to a system written in Go. Datadog has expanded from an IT infrastructure monitoring service to Application Performance Monitoring, Web services synthetic and accurate user monitoring, serverless microservices tracing, cloud resource monitoring, log management, bug reporting, and incident management. More recently, Datadog has built on its log management expertise to produce security monitoring tools.
Pros:
- Diverse Real-User Monitoring: Delivers a wide array of user monitors through customizable templates and widgets for detailed insights.
- Holistic Network Insight: Enables a complete view of network performance and accessibility both internally and externally.
- Real-Time Updates: Reflects changes within the network almost instantly, ensuring data is always current.
- Scalable Monitoring Solutions: Allows organizations to scale their monitoring efforts with flexible pricing options, accommodating growth.
Cons:
- Limited Trial Period: An extended trial would be beneficial for more comprehensive evaluation and testing.
Datadog is becoming a significant competitor in the IT system monitoring sector and now has more than 2,600 employees. The company’s revenue in 2021 was $802 million.
Graphite vs. Datadog head-to-head
While Datadog and Graphite are two different packages, Graphite can be used to display system performance data, making it a rival to Datadog.
Deployment options
Graphite is free to use, and its source code can be downloaded from its GitHub repository. The code will run on Unix and Unix-like operating systems, which includes all Linux distros and macOS. It is also possible to run Graphite on Docker containers, enabling Windows devices’ users to use the system.
As Linux servers provide many cloud platforms, there are cloud options available. Businesses that don’t want the problems of installing the code, getting it to run, and managing it can opt for a hosted version of Graphite.
MetricFire offers a Hosted Graphite package available in seven plans, each offering different transaction throughput volumes. Customers of MetricFire don’t need to worry about getting the Graphite software running. However, they still have the problem of gathering IT system data to feed into the graphics package.
Datadog is only available as a SaaS package. This system includes storage space for data as well as the software that implements the monitoring service.
System interface
Graphite’s interface is called Graphite Web. This provides a user interface and APIs to allow other user interfaces to use Graphite as a backend. The Graphite Web system provides a composer, through which the user creates a display template. This enables you to pick different data sources and display them in the Graphite Web system. It is possible to output those graphs as images, CSV files, XML, or JSON formats. A problem with that system is that once you design a graph and get it running on a Web page, you need to continuously refresh that image and reload a newer version to see the latest installment in your time-series data stream.
The Graphite Web service isn’t straightforward to use. It requires you to program your Web pages. The Hosted Graphite service offered by MetricFire uses the Grafana system for its frontend and doesn’t bother with the user interface of Graphite Web – it uses the APIs instead.
Even with the Grafana option, you still have to build your Web page templates. In addition, Grafana and Graphite only show graphs so that this interface won’t give you static information, such as asset inventory records.
Datadog offers a dashboard that immediately provides a set format, showing graphs and data mixed in reach screen and offering drill-down paths from overview screens to screens displaying information about individual devices or applications. In addition, it is possible to create customized screens that pool data sources from the standard screens of the Datadog console.
Datadog also offers APIs, so if you want to create your interface from scratch, you could choose to use Kibana, Grafana, or any other package to represent your Datadog monitoring data.
System data feeds
Graphite can represent any type of data, and it isn’t designed for IT system monitoring. The package doesn’t include a data gathering agent. Instead, it has a data receiver, which is like a log server. This tool searches through a given stream, but it doesn’t source the data from your IT system. You need to look around for a separate tool to do that. Most Graphite users opt for collectd to gather system performance data.
The Datadog system includes data collectors for the different platforms that it monitors. When you enroll a server or platform into the system, the Datadog set up screens offer a download package that installs the data agent on the target system. The new user doesn’t need to perform any adjustments or configuration of the agent. Instead, it starts interacting with the local system, performing discovery processes, and uploading system reference data to the Datadog server. Once all relevant infrastructure has been documented, live monitoring begins.
Automated monitoring
A key component of the primary IT system monitoring tools, whether for performance or security surveillance, is the alert. Any metric that can be measured can have a level of acceptable values logged on it.
For an example of how alerts work, consider the process of monitoring CPU utilization. Of course, you don’t want that figure to hit 100 percent. However, you also don’t want to wait until utilization gets close to that level before you are notified because by then, it is too late to do anything about it. In this case, you might register a threshold at 80 percent utilization. When CPU usage goes up above 80 percent, the system will generate an alert notification sent out as an automated email or SMS notification.
Datadog starts its operations with default alert thresholds on each of the available metrics. So the first step is to choose which metrics to track, and then the second decision is whether to turn on the threshold. After that, you can leave Datadog to watch over normal operations and notify you when thresholds get crossed.
Graphite doesn’t have those automatic performance thresholds; you have to program them yourself. Unfortunately, this also means that there is no built-in mechanism to generate emails or SMS notifications, and you will also need to create those.
Hosted Graphite from MetricFire includes a mechanism to allow you to place alerts on metrics. However, there is a charge for the number of alerts that you implement.
Graphite vs. Datadog: Price
Graphite is free to use. However, if you opt for the MetricFire Hosted Graphite service, you need to pay.
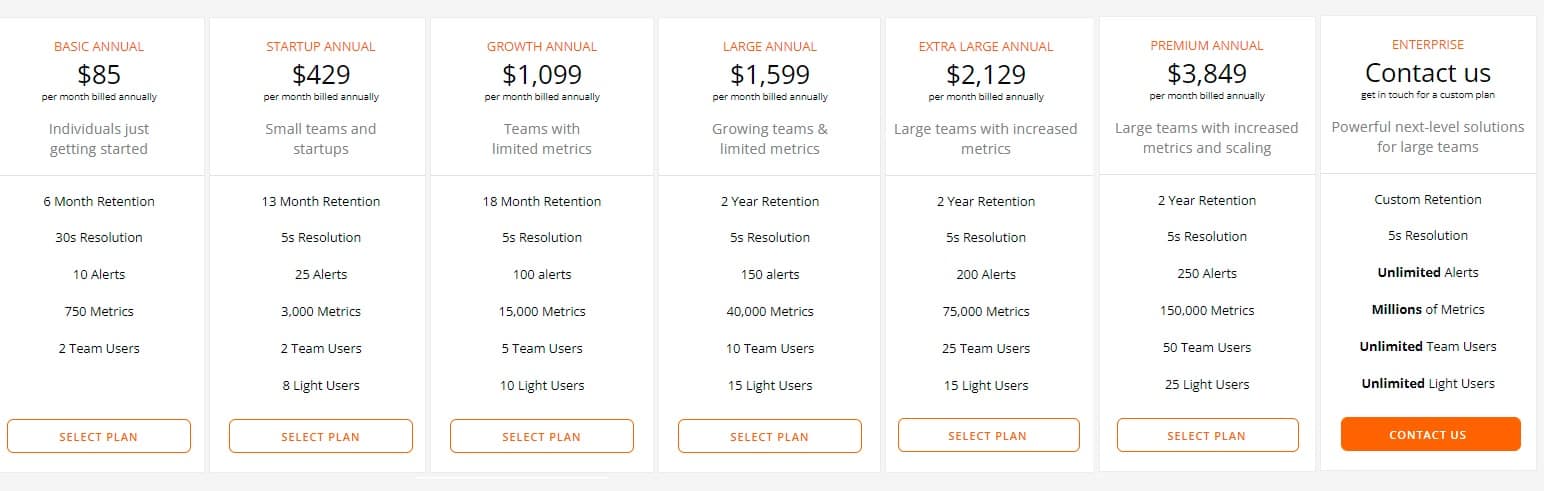
The prices for Hosted Graphite’s seven plans start at $85 per month when billed annually for the Basic plan, which gives you ten alerts. The highest plan with a published price is the Premium edition, which costs £3,849 per month when billed annually and gives you 250 alerts.
You can speak to a sales rep of MetricFire and get a guided demo of the service.
Datadog has a total of 12 modules, and each has a base price. The actual price you pay depends on the volume of data that your system generates. That means the price is influenced by the number of metrics you choose to monitor and the sampling frequency.
Each module has a different pricing structure, with some services offering a single base price and others providing several plans. The cheapest service from Datadog is the Free plan of the Infrastructure package. This is limited to monitoring five servers. This plan offers a lot of monitoring sensors but no alerts.
The lowest-paid plan for the Infrastructure service, called Pro, includes unlimited alerts, and it costs $15 per host per month when billed annually. A higher plan, which provides for AI-based baselining for alerts, is called Enterprise, and that costs $23 per month per host when billed annually. The Enterprise plan also has no limit on the number of alert thresholds that you can activate.
You can get a 14-day free trial of any of the Datadog editions.
Graphite vs. Datadog: the verdict
Although Graphite can be used for IT system monitoring, this isn’t the tool’s original purpose. Instead, it is a data stream graphing package and can be applied to an extensive range of uses. Hosted Graphite from MetricFire is a monitoring system that offers the option of adding alerts to Graphite data processing. However, the Hosted Graphite service is still a flexible package that can convert any type of data into graphs, not just IT system performance information.
Datadog is a dedicated IT system performance monitoring tool. The company also offers a range of other tools that relate to the management of IT systems.
If you are looking for a way to represent time series data feeds, consider Graphite; if you are looking for an IT system monitor, opt for Datadog.
Graphite Vs Datadog FAQs
What makes Datadog different?
Datadog offers both performance monitoring and security monitoring systems from its cloud platform. The tool is able to reach across the internet to monitor assets on any site and also track the performance of cloud services. The tool’s security monitoring services also cover both on-premises and cloud-based systems.
What is Graphite software used for?
Graphite is a data analysis package that provides a range of data visualization formats. Graphite analyzes a stream of data, looking for changes in patterns, which is a useful characteristic for those who want to build their own system monitoring service. Graphite can be used for a range of applications that involve market analysis.
Does Datadog use Python?
Datadog provides a free Python library that enables developers to generate statistics output that can be collected by Datadog daemon DogStatsD.
