In today’s complex IT landscape, organizations need robust solutions to manage logs and monitor system performance effectively. Two standout platforms in this space are Graylog and Datadog, each offering unique approaches to help teams maintain security, optimize operations, and quickly identify issues. Choosing between them depends on whether you prioritize flexibility, cost-effectiveness, or a fully integrated cloud experience.
Graylog is particularly strong in log management and analysis, offering powerful search functionality and a highly adaptable architecture. Its open-source roots make it a budget-friendly option for teams seeking customizable monitoring and compliance tools. Capable of handling both live and historical data, Graylog allows rapid detection of anomalies and potential security threats. Enterprise features such as intuitive dashboards, prebuilt compliance templates, and broad integrations make it especially useful for IT administrators and security teams.
Datadog, in contrast, is a cloud-based monitoring platform built for dynamic, scalable environments. By unifying infrastructure, application, and log monitoring, it delivers real-time insights, anomaly detection, and advanced visualizations. Integrations with Datadog’s other services, like application performance monitoring (APM), allow teams to correlate logs with system metrics, enhancing troubleshooting and overall operational efficiency.
This guide explores the features, pricing, and ideal applications of both Graylog and Datadog. Whether you value open-source adaptability or a comprehensive cloud solution, understanding their differences will help you strengthen security, improve visibility, and streamline IT operations.
Graylog highlights
Graylog was initially called Torch, and it first became available in 2009. Lennart Koopman originally developed the system in Hamburg, Germany. Koopman moved his base to Houston, Texas, in 2013 and set up a company to market services around the Graylog system. However, the core of Graylog was made an open-source system and is still available for free.
As well as producing paid versions of Graylog, Graylog, Inc manages the open-source project. Lennart Koopman is still involved with the business as Chief Technical Officer.
There are now three editions of Graylog. The open-source version is called Graylog Open. The two other versions are called Graylog Cloud and Graylog Enterprise. The open-source version of Graylog is much more widely used than its paid counterparts. For example, there than 50,000 users worldwide of Graylog Open and only 300 corporate users of the paid versions.
The Graylog system is a log management package with two main components. These are the collectors and the server. The collector sits on the monitored system, and channels gather log messages. It then feeds those messages to the server module. The server can be elsewhere on the same network, remote, or a cloud platform. This enables companies running multi-site and hybrid systems to centralize log file storage.
When the server receives those log messages, it puts them into a standard format and then files them. The system maintains a file directory structure that makes specific periods in time easy to locate. Within each directory, log files are rotated by date.
The merging of log files into a single format is necessary because messages from different sources and using different message format standards can be consolidated into one data lake. Furthermore, with the information collected from every part of the system, analytical tools can be set up to show events from every aspect of the network. This is important for creating resource utilization tracking reports and also security monitoring analyzers.
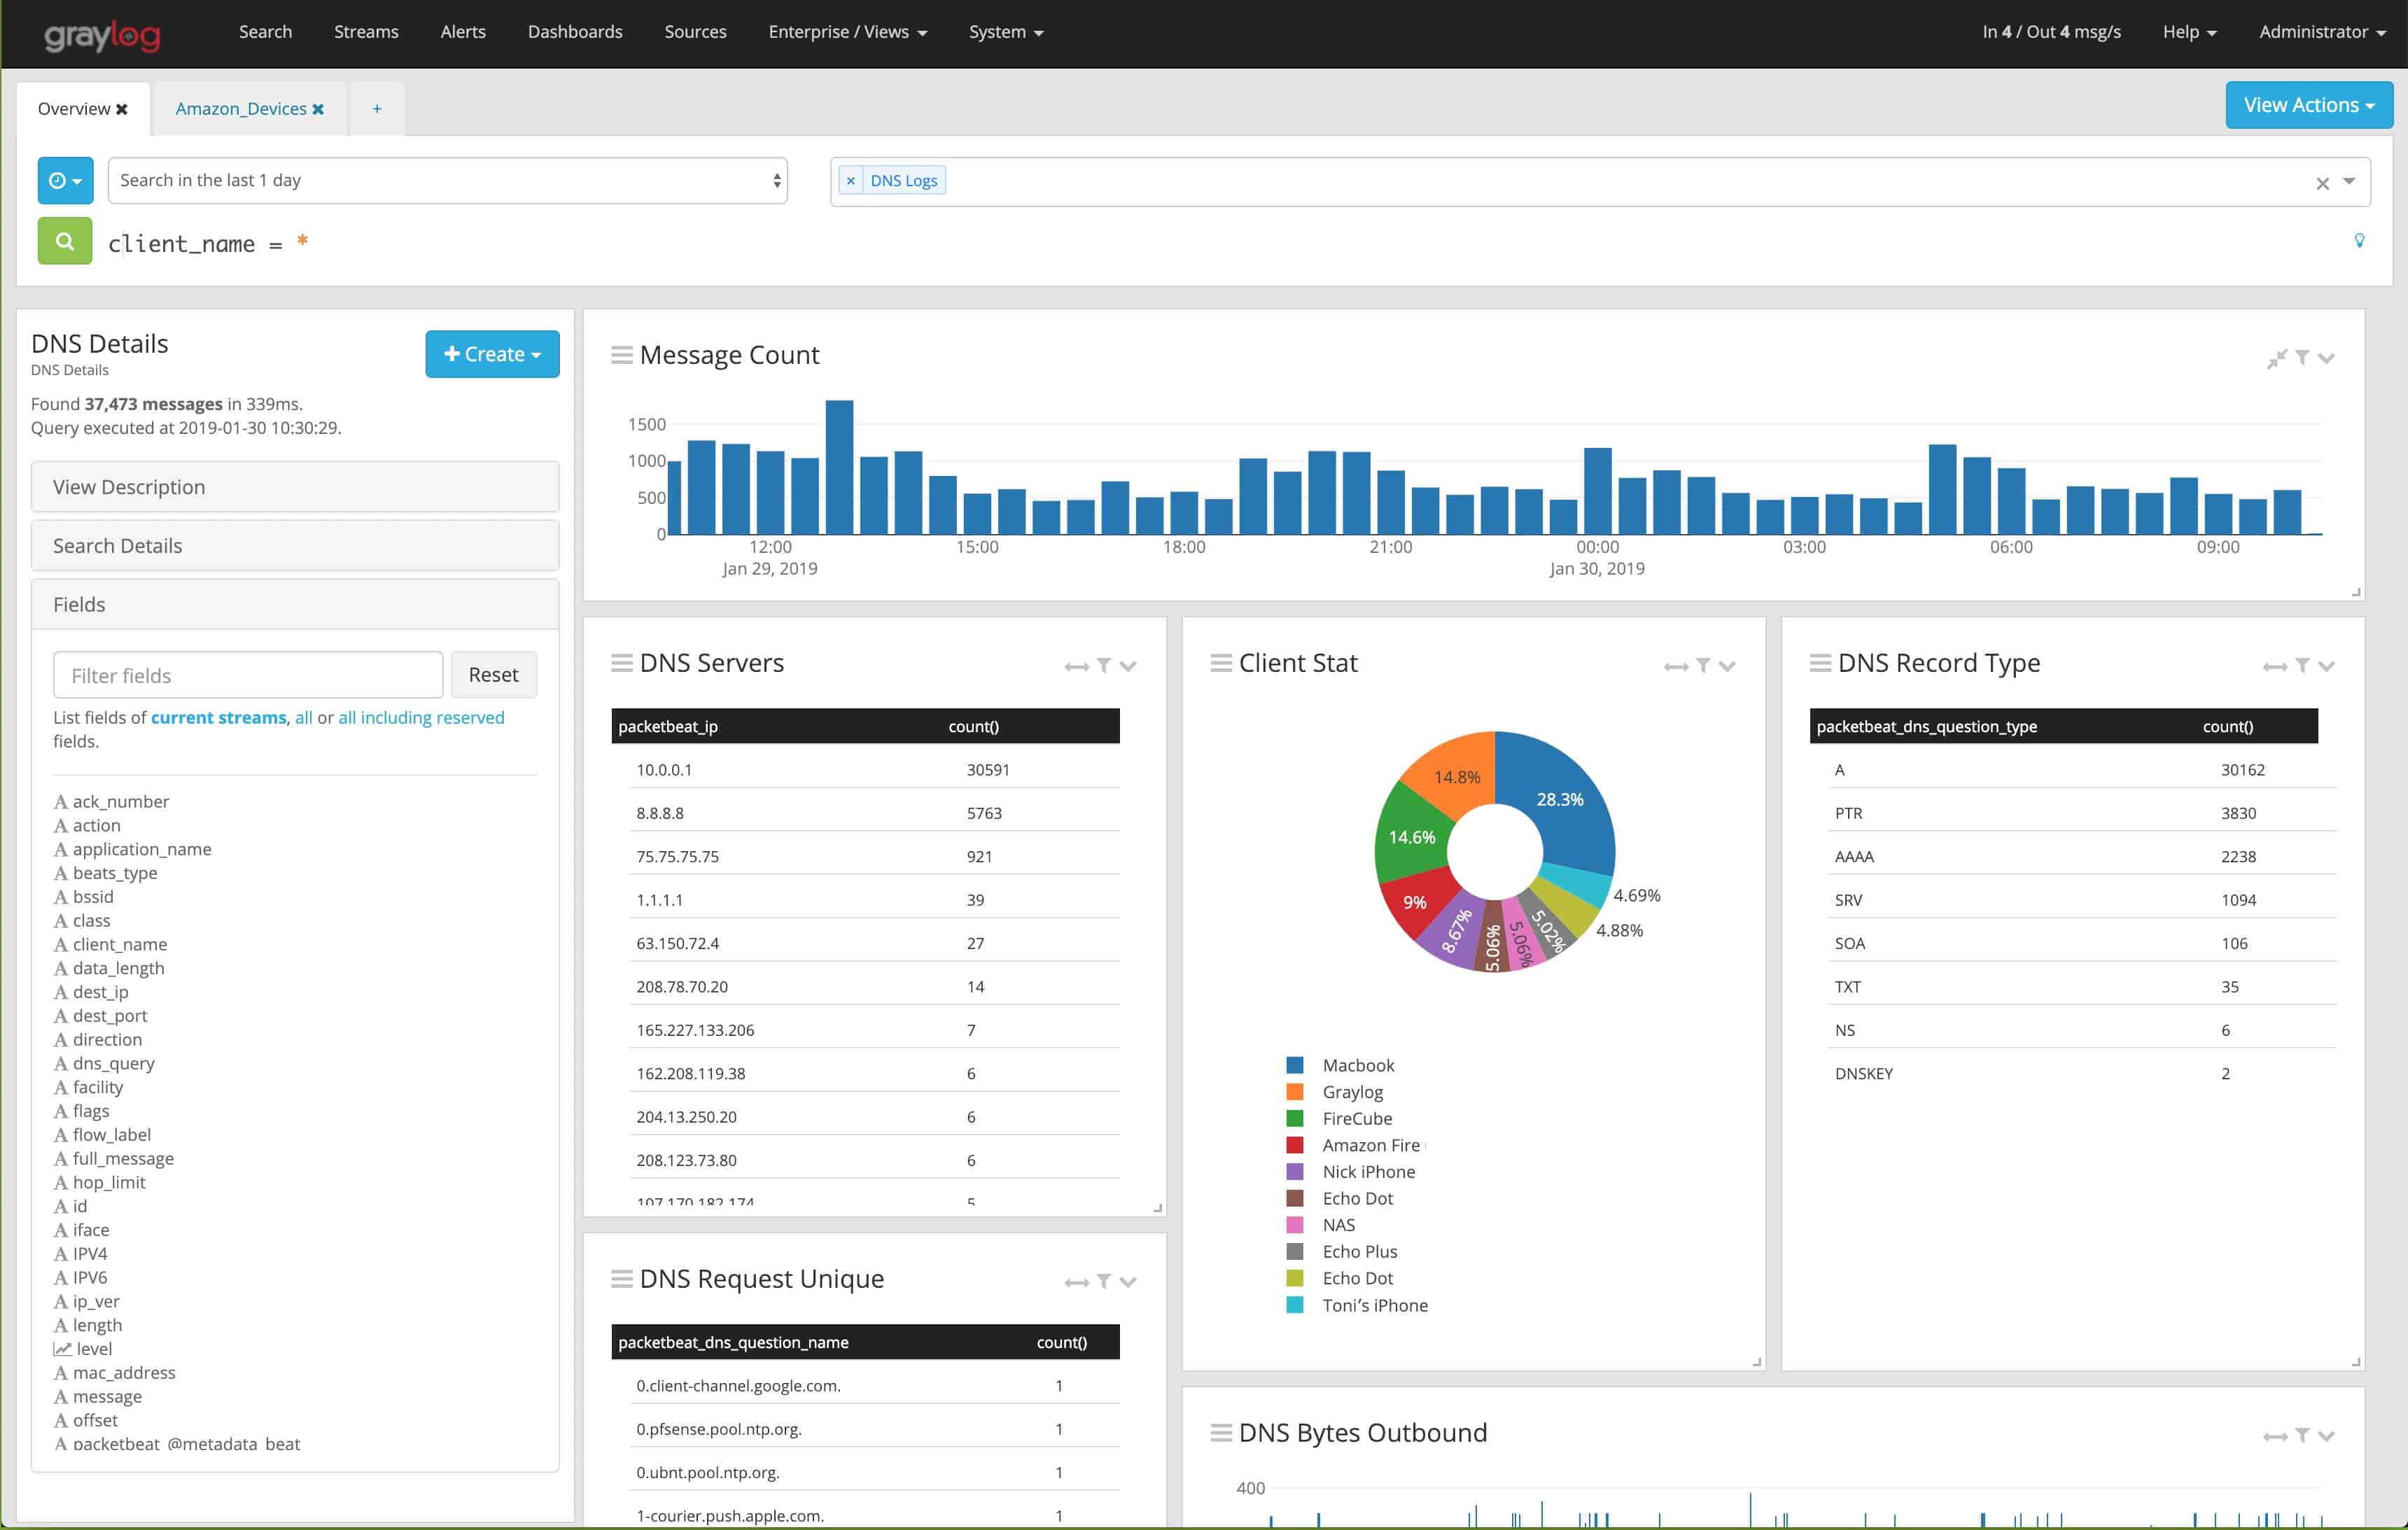
Graylog includes a dashboard, which can be customized. The interface also offers a query builder. You can generate queries and store them, creating output for your dashboard. Then, interface the outcome from a query to a widget and set that query running continuously, and you have your system monitor.
Creating your security monitoring system from log data is an excellent project for system managers that love technical challenges. SIEM systems mine log files for security information, and anyone can create their SIEM. However, suppose you just don’t have the time to perform that work. In that case, you can access the pre-written functions of the paid versions of Graylog or forward the log messages through to some other analytical tool while leaving Graylog also to file those messages.
Key Information
- Graylog is available in free and paid versions
- Graylog offers a SaaS version, and it is also known as an on-premises package
- Graylog collects, consolidates, and files log messages
- Graylog provides a search interface and a customizable dashboard that lets you build your applications
- The users of Graylog include Walt Disney Studios, Lockheed Martin, Flex Trade, and Tinkoff Bank
Datadog highlights
Datadog has been available since 2010. The company and the tool of the same name were created by Olivier Pomel and Alexis Lê-Quôc, who had acquired the code for Datadog in 2009 from Server Density. Today, Olivier Pomel is Datadog’s CEO, and Alexis Lê-Quôc is the Chief Technology Officer, so the company has total continuity from the day it began. Datadog, Inc has been listed on NASDAQ since 2019.
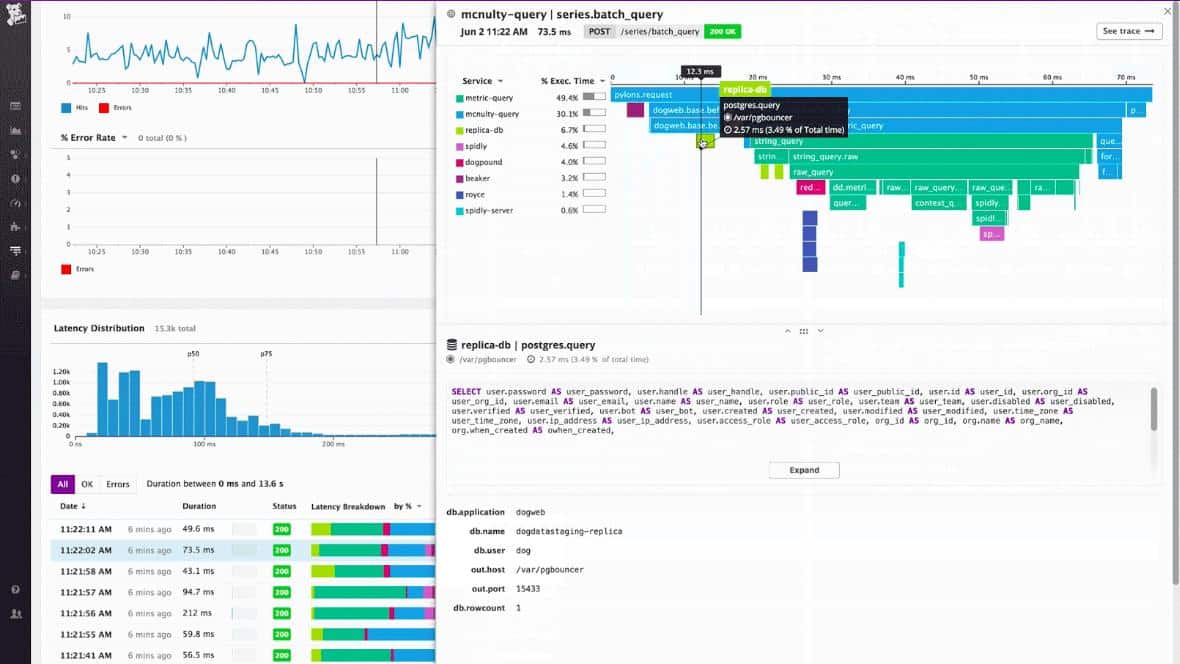
The Datadog system keeps growing, offering more services from its cloud platform. The modules now provided by the SaaS system include monitoring for networks, servers, applications, and Web resources. In addition, the tool consists of AI processes in a service called Watchdog. Some very sophisticated processes are built into its modules, such as applications dependency mapping in its APM and distributed tracing in its Serverless monitoring package.
New services in Datadog include its Incident Management system and security services. The security systems on the Datadog platform are a vulnerability manager for Web assets and a Security Monitoring package, which operates as a SIEM. That SIEM is only possible because of the Datadog Log Management package.
Datadog acquired Logmatic.io in 2017. The new division was based in Paris, France, and specialized in log management. The Paris HQ of this recent acquisition became Datadog’s R&D facility, and Logmatic became Datadog Log Management.
The Log Management module of Datadog is a standalone service that runs from the cloud and installs collectors on each system monitored by the service. The collectors upload log messages to the Datadog server, consolidated by conversion into a standard format. Those messages are displayed and analyzed in the dashboard as they arrive, and they are also filed.
Log files are stored on the Datadog server, and space for them is included in the price of a Datadog subscription. You can also choose to send log files to an Amazon S3 or Azure storage account. Then, they can be recalled for searches and analysis in the dashboard.
The log messages that feed into the Datadog Log Management system can arise from databases, containers, operating systems, Windows software from Windows Events and Linux, and related Syslog messages.
Although you don’t need to subscribe to any other Datadog service to use the Log Management tool, using other modules generates more data to feed into the Log Management service. For example, the Network Device Monitoring module can forward SNMP reports to the log manager, adding live network device status information.
The Security Monitoring system of Datadog can be added to the Log Management module.
Key Information
- Datadog is a cloud-based system that uses local agents to collect log messages
- Datadog consolidates log messages and can also integrate reports from other Datadog modules
- Datadog offers a Security Monitoring add-on to the Log Management service
- Integrations and connections to other cloud platforms let you send log data to other applications for analysis
- The customers of Datadog include Samsung, 21st Century Fox, Whole Foods, and Peloton
Graylog vs Datadog head-to-head
The closest comparison to Datadog Log Management in the Graylog stable comes from Graylog Cloud. Both of these systems are SaaS services and can be used as standalone log managers.
Log management infrastructure
Graylog uses MongoDB for its log message and file storage indexing and Elasticsearch for its message searching facility.
Datadog doesn’t explain the components of its Log Management module. However, it uses Apache Kafka as its primary managing, storing, and indexing event records for its time-series system monitoring functions. It can be guessed that this is also used for its Log Management module. Similarly, the company doesn’t explain which search utility it uses in its dashboard for Log Management. However, Datadog uses Elasticsearch in most of its system monitoring screens to package data for display, so this is probably at the heart of the Log Management search function as well.
Log management dashboard
Graylog explains that it has a build-your-own interface, guiding users to set up searches and then linking those through to a display method, such as a list or a graph, available in a library of format templates.
Datadog presents a preformatted dashboard for its Log Management system. However, this is a suggestion because Datadog also encourages its users to set up their data feeds, searches, and linked display widgets.
There are a lot of similarities between the way Graylog and Datadog enable users to create their log display features.
Log collectors
Both Graylog and Datadog receive log messages from a long list of technologies. Both have very similar inputs as an essential list that can be expanded further by adding on integration to receive logs from specific applications.
This flexibility is excellent for those system administrators that like to tinker, but it can be time-consuming and complicated for those who expect an out-of-the-box solution.
With both systems, you can use the following services to send log messages to the log management server:
- Rsyslog
- Syslog-NG
- NXLog
- FluentD
- Logstash
- Winlogbeat
- Filebeat
Datadog also has its native data collectors for its monitoring systems, and these can send their gathered data to the log management server for inclusion. This type of information includes SNMP and NetFlow reports. Graylog can also take these data sources.
Graylog and Datadog are almost identical in their log collector agent compatibility. Both can collect log messages from Windows, Linux, macOS, and Unix.
Security and compliance
Both Graylog Cloud and Datadog offer security monitoring and compliance auditing based on log messages. With Graylog, these services are also available in the Graylog Enterprise on-site software package. Users of Graylog Open would need to assemble their security searches. Graylog offers its Security package as an add-on but doesn’t publish its price.
With Datadog, Security Monitoring is an extra, paid module. Both Graylog Cloud and Datadog Security Monitoring implement SIEM methodologies, prewritten searches through log messages as they arrive at the server.
In both cases, users can use the log management system as a foundation for use with other SIEM systems from third-party providers.
Compliance auditing and data governance control are provided by an extra package in the Datadog system. This is called Datadog Cloud Security Posture Management. Graylog Cloud and Graylog Enterprise both offer compliance management functions.
Graylog vs. Datadog Log Management: deployment
Both Graylog Cloud and Datadog Log Management are SaaS systems. Both can be accessed from any operating system through any standard browser. In addition, log collection agents are available for both systems: Windows, macOS, Linux, Unix, Docker, Kubernetes, VMWare, Hyper-V, Azure, AWS, and Google Cloud Platform.
Datadog has no other version. However, Graylog offers Graylog Enterprise and Graylog Open for installation on-premises as alternatives to its cloud-based system.
Graylog Open and Graylog Enterprise require a server running Ubuntu, Debian, SLES, or CentOS Linux. Unfortunately, there is no version for Windows. However, if you only have Windows servers, you can run the system on Docker containers. It can also be run on Hyper-V, VMWare, and Virtualbox.
Pros & Cons
Graylog
Pros:
- Was built to un-silo and ingest large amounts of data
- Uses simple widgets to create custom reports, dashboards, and monitors
- Offers Content Packs, which act as add-ons to help interpret data faster
- Additional features can be found on the user-powered community marketplace
Cons:
- The open-source version isn’t the best option for large enterprises
Datadog
Pros:
- Offers numerous real user monitors via templates and widgets
- Can monitor both internally and externally giving network admins a holistic view of network performance and accessibility
- Changes made to the network are reflected in near real-time
- Allows businesses to scale their monitoring efforts reliably through flexible pricing options
Cons:
- Would like to see a longer trial period for testing
Graylog vs. Datadog Log Management: prices
Graylog Open is free to use, and the remaining two editions, Enterprise and Cloud, are both charged for. Unfortunately, Graylog doesn’t publish its price list, so you have to contact the Sales Department to determine how much the system will cost you.
There is a free version of Graylog Enterprise, which limits 5 GB of data processing per day. This is called Graylog Small Business.
Datadog Log Management has two services. These are Ingest, which collects and stores log messages, and Retain and Rehydrate, a log archiving service that can bring those logs back to live for searching in the Log Management dashboard. The prices for these two services are:
- Ingest: Starting at $0.10 per processed GB per month
- Retain or Rehydrate: $1.70 per million log events per month with a 15-day retention period
The price of Retain or Rehydrate increases with more extended retention periods. For example, with a 30-day retention period, the price is $2.50 per million log events. The Retain or Rehydrate system stores to AWS S3, Azure Blob Storage, or Google Cloud Storage, so you also have to consider the price of those services when calculating the cost of using the Datadog system.
The Datadog Security Monitoring module is charged at $0.20 per GB of analyzed data per month.
Datadog Cloud Security Posture Management costs $7.50 per host per month.
Graylog vs. Datadog Log Management: free trials
Graylog offers a demo of Graylog Enterprise, which is conducted in the form of a lecture. The functions of Graylog Cloud have the same format as the Enterprise edition.
Datadog offers a 14-day free trial on all of its modules.
Graylog vs. Datadog: the verdict
The functionality and ease of use of both Graylog and Datadog Log Management are equal. Although the prices for Datadog Log Management are stated on its site and mentioned above, they are flagged as “starting from;” Graylog doesn’t publish its prices. Therefore, your choice between these two may come down to how much they each quote you for your requirements.
