Instana is a challenger system that is bubbling under in the APM market. Although the Instana name is not as well-known as New Relic, Datadog, AppDynamics, and Dynatrace, the company has recently taken on a powerful ally and can be expected to rise to prominence.
Key Features:
- Advanced Observability: Provides a comprehensive suite of observability tools including application performance monitoring, container monitoring, and cloud infrastructure monitoring.
- AI-Driven Insights: Utilizes AI to generate dependency maps, offering deep insights into application interactions and performance dependencies.
- Distributed Tracing: Specializes in distributed tracing and code profiling, essential for understanding microservices and containerized applications.
- Full Stack Monitoring: Covers the entire stack from applications to infrastructure, including serverless and cloud platforms.
Why do we recommend it?
Instana stands out in the observability space for its cutting-edge AI-driven insights, comprehensive monitoring capabilities across the full stack, and strong focus on distributed tracing and container monitoring. Its support for DevOps practices through seamless integrations with CI/CD tools makes it a valuable asset for both IT operations and development teams looking to enhance application performance and reliability.
Who is it recommended for?
Recommended for enterprises and development teams that utilize containerized applications and microservices architecture. Instana’s robust observability platform is particularly suited for organizations seeking to leverage AI for deeper insights into application dependencies and performance, as well as those requiring extensive monitoring coverage from cloud to serverless environments.
The APM market is in flux at the moment, with major players, such as New Relic, announcing that they no longer see themselves as application performance monitoring services. There is a new buzzword in the field: observability. In the industry dash to repackage, there is all to play for. With a marketing misstep, a long-standing reputation in the APM field could fail to translate into this new identity. On the other hand, a deft repackaging can catapult a little-known APM into a prominent observability platform. Instana could very well win this contest.
About Instana
Instana started up in Solingen, Germany, in 2015 as a division of Codecentric that split out to be a separate company. Among the company’s founders was the owner and CEO of Codecentric, who is still CEO of Instana. Other founders are also with the company. However, the business is now based in Chicago in the United States. That move gave Instana access to the venture capital funds that are more widely available in the USA.
With ample funding in place, the company expanded and established its product in the APM market. However, the business was bought out by IBM in November 2020.
The key to Instana’s success has come from its ability to gather performance statistics from containerized applications. This specialization put the company in an excellent position to develop expertise in distributed tracing and code profiling, which are the fundamental techniques behind the observability strategy.
Instana observability
Instana creates dependency maps that link together applications and services. These maps are represented as graphics in the Instana dashboard, which greatly assists in understanding precisely what modules are contributing to a specific application. This is an essential monitoring service today when APIs and SDKs contribute heavily towards the functionality of many systems.
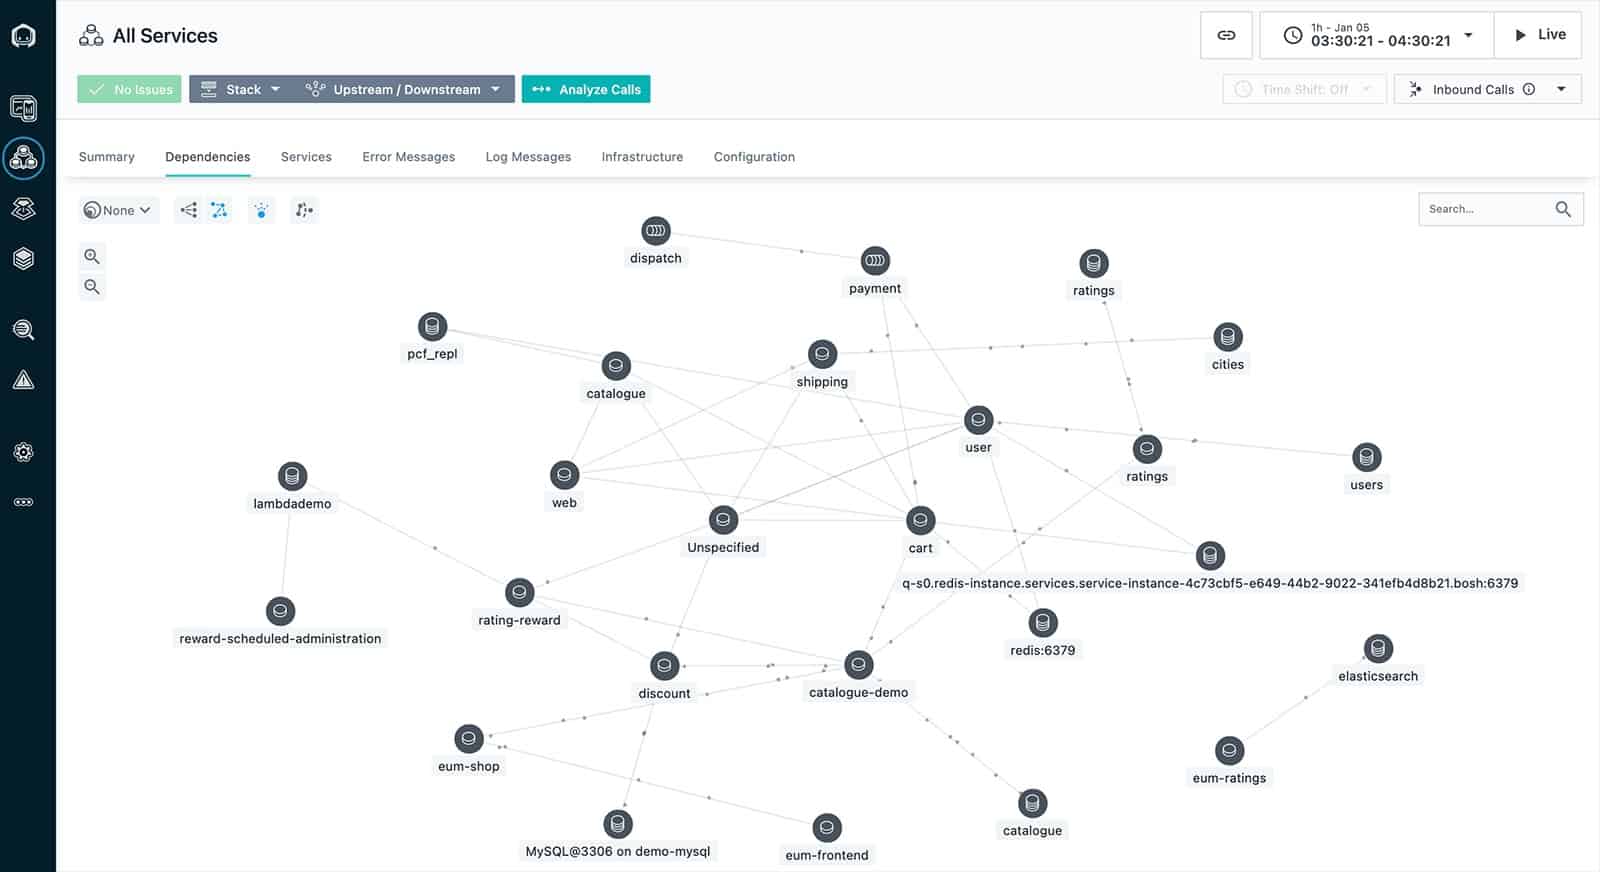
Plugging in a pre-written service to provide a function when writing a new application makes development very easy. However, a lack of knowledge about what that unit does or how it runs can provide a monitoring headache. Fortunately, the industry moves to create standards for tracking issues from within running functions without breaking into its code, making monitoring those microservices and offloaded processes easier to watch.
The messaging system used within microservices is called telemetry, and the monitoring services that pick up those messages are called distributed tracing systems. So, for example, observability systems are monitoring packages that use distributed tracing.
Instana uses AI processes to log what resources and services each module requires for the different actions it performs. Instana can identify a ripple-through resource requirement for each step by applying these requirements to the application dependency map. Knowing what supportive services a piece of software requires to run at its optimum performance enables a monitoring tool to identify when resource shortages will occur and thus cause units in the dependency chain to seize up or run slowly.
Distributed tracing, AI-based predictions, and the dependency map put Instana in the front row of observability providers.
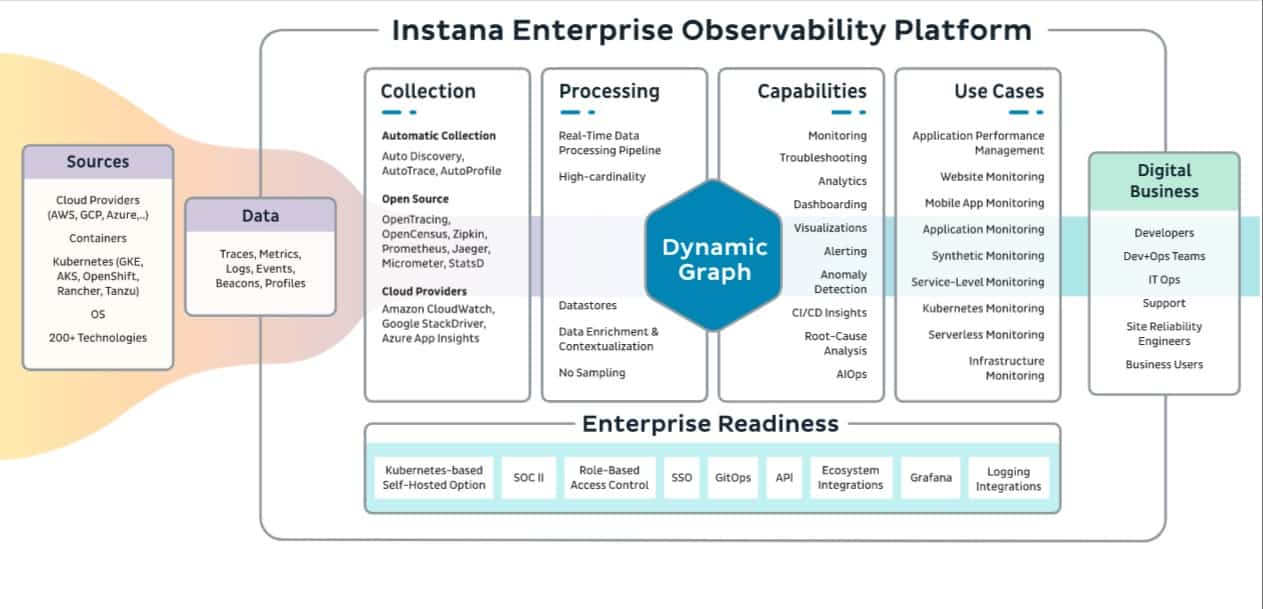
The Instana platform
Instana is the name of the company and its sole product – the Instana Enterprise Observability Platform.
The platform is designed to support IT Operations monitoring and also Web application development. So, it makes creators more confident in their use of libraries and frameworks because they can watch how those backend microservices operate. In addition, the system can trace through mobile applications to the offloaded processes and reap operating statistics from serverless hosting platforms, such as AWS Lambda and AWS Fargate.
All of the metrics that the platform collects can have performance thresholds placed on them. The service will also collect information about resource utilization and availability. If a threshold gets crossed, an alert is raised. Instana can forward alerts to technicians via Slack or insert them into task allocation and scheduling systems, such as Splunk On-Call and PagerDuty.
Instana services
The Instana Enterprise Observability Platform is a single package – Instana doesn’t offer subscriptions to individual modules. Instead, the platform collects data through the use of an agent program. The agent needs to be installed on each host that is being monitored – one agent performs all of the data gathering tasks for all Instana modules.
The units in the Instana package are:
- Application Performance Monitoring
- Container Monitoring
- End-user Monitoring
- Synthetic Monitoring
- Serverless Monitoring
- Cloud and Infrastructure Monitoring
- AIOps
- Log Monitoring
The Instana Enterprise Observability Platform is a monitoring service, and it doesn’t include any system management functions. However, it can connect to management tools through integrations, which are a form of a plug-in.
Application Performance Monitoring
The APM tracks through operating applications to spot the calls to other underlying functions, creating a Service Dependency Map. It then follows all of the connections and tracks executions of all identified modules through distributed tracing, watching over code written in Java, Kotlin, .NET, .NET Core, Go, Node.js, GraphQL, PHP, Python, Scala, Ruby, plus others.
The service uses AI processes to analyze activity through those applications, looking for abnormal requests. Performance tracking looks at all resources in the context of their location in the stack. Distributed tracing can work with several telemetry standards, including OpenTracing, OpenTelemetry, Jaeger, and OpenZipkin.
Web Application Continuous Profiling
The platform includes utilities for use by development teams and testers. This systems package can be used for CI/CD pipelines and can continue in service for IT Operations once an application goes live. The package can participate in the software development lifecycle through integrations with Jenkins, Harness, Git Actions. In addition, it performs continuous profiling for applications written in Java, Node.js, and Go.
Container Monitoring
The Container Monitoring system built into Instana covers container management by Kubernetes, including all of its cloud platform implementations. The package can monitor Docker, Cri-o, Garden, containerD, LXC, Rancher, OpenShift, VMware Tanzu, and Anthos. The system interfaces to Helm and Kubernetes Operator.
The Instana system integrates a range of monitoring techniques to watch the full stack inside, around, and below containers, as well as the functions with which they interact.
Website Monitoring
The Website Monitoring package in the Instana platform offers browser checks, real-user monitoring, and automated synthetic monitoring, and mobile-launched tests on the microservices that perform offloaded processing for apps run on iOS and Android.
The monitoring service gathers performance statistics as users navigate a site, while synthetic monitoring launches availability and response time tests.
Serverless Monitoring
The Serverless Monitoring package in Instana works with the performance reporting tools built into cloud platforms designed for serverless systems, such as AWS Lambda. In addition, this monitor links into the Service Dependency Map and Distributed Tracing services in the platform to feed in performance data about the microservices that contribute to the observed overall application support.
Cloud and Infrastructure Monitoring
Cloud and Infrastructure Monitoring covers a lot of territory. For example, this monitoring tool doesn’t watch over networks, although it can check internet connectivity. The infrastructure that this service refers to is all of the back-end applications that support user-facing software. This category includes Web servers, databases, virtualizations, and the resources subscribed to on cloud platforms, including the service components built into cloud platforms.
The cloud platforms that this tool can monitor include AWS, Azure, IBM Cloud, and Google Cloud Platform. Virtualizations include VMWare and NGINX, but not Hyper-V. Databases that the system will monitor include SQL Server, MariaDB, Cassandra, Oracle, MySQL, PostgreSQL, NoSQL, SAP, Sybase, and the Cloud implementations of all of those.
AIOps
Instana’s use of AI is one of its strengths. It applies Machine Learning to the baselining of regular activity and then involves activity anomaly detection over that. The system also uses AI as part of its service dependency mapping and root cause analysis.
Log Monitoring
The Instana Enterprise Observability Platform monitors log server activity. However, it does not include a built-in log server. Instead, the package integrates with well-known log management solutions, such as Splunk, Logstash, and Coralogix.
Instana deployment options
Instana runs on a cloud platform, and you can take it as a SaaS service. This includes unlimited storage space for all of the logs and metrics gathered by the system. If you prefer, you can get the system installed on your servers, either on-premises or on your cloud account. The platform runs on Docker in all cases, so if your chosen server’s operating supports Docker, it can host Instana.
Instana strengths and weaknesses
Instana offers an impressive package that implements all new methods for examining applications: distributed tracing and code profiling. This system is suitable for use by development teams and IT Operations technicians. When used for monitoring, it will notify you when problems arise. When used for Web application testing, it can examine Web applications under development and websites already live.
We have noted several strengths and weaknesses in the Instana Enterprise Observability Platform.
Pros:
- Versatile Tracing: Excel at distributed tracing, making it highly effective for container and microservice environments.
- DevOps Integration: Offers modules that seamlessly integrate into CI/CD pipelines, enhancing development workflows.
- Comprehensive Monitoring: Provides a wide range of monitoring capabilities, from application performance to serverless functions.
- Extensive Third-Party Integrations: Easily integrates with popular DevOps and IT operations tools like Jenkins, Git Actions, Slack, and PagerDuty.
- Flexible Deployment: Available as a SaaS solution with unlimited storage for logs and metrics, ensuring scalability and ease of use.
Cons:
- Lacks Management Features: Primarily focused on monitoring and observability without built-in system management functions, potentially requiring additional tools for comprehensive IT management.
Instana price
Instana settles its price per host per month basis, although subscriptions are demanded annually in advance. For charging purposes, a host is defined as each physical or virtual OS instance enrolled in the monitoring service.
The price for a subscription to the Instana Enterprise Observability Platform is $75 per host per month, whether you use the SaaS option or decide to install it on your server. You can try the platform on a 14-day free trial.
Alternatives to Instana
Instana is an impressive package, and its entire group of services will please businesses that both develop and manage Web applications, including companies that produce mobile apps. However, most companies probably won’t use all of the Instana Enterprise Observability Platform tools. Therefore, it is possible that the inclusion of all services in one bundle could be overkill.
Ultimately, whether the one-size-fits-all package is a good deal boils down to whether the price beats other providers that let you select only the services you need. If those unused services in the Instana package cost you nothing, they won’t do any harm.
Here is our list of the best alternatives to the Instana Enterprise Observability Platform:
- Site24x7 APM (FREE TRIAL) This SaaS platform is a close competitor to Datadog. The APM includes distributed tracing and a continuous profiler for DevOps organizations. This service will monitor applications running on your servers, the cloud, or microservices for Web applications and mobile apps. Site24x7 APM is available for a 30-day free trial.
- Datadog APM Datadog is a SaaS platform with a full menu of modules that can be used individually or as a bundle. The APM has two plans, and the higher of these includes a continuous profiler for DevOps environments to trace through code. In addition, the APM implements distributed tracing to monitor microservices, and it also uses AI to create an application dependency map and for root cause analysis. You can access a 14-day free trial to test Datadog.
- Splunk Observability Suite Also known as Splunk Observability Cloud, this package of tracing and profiling tools includes Splunk On-Call, the new name for VictorOps, the well-known incidence response system. Other services in this platform include accurate user monitoring, synthetic monitoring, application performance monitoring, and infrastructure monitoring. The distributed tracing service uses the OpenTelemetry standard., Try Splunk Observability Cloud on a 14-day free trial.
- New Relic Telemetry Data Platform This is one of the leading distributed tracing and observability packages available. This platform is a SaaS system that can use OpenTelemetry, OpenTracing, OpenCensus, and Zipkin for distributed tracing. In addition, this package can interface with well-known serverless hosts, such as AWS Lambda to gather statistics from the operating system. Other services in this package include Web application performance monitoring and testing. For a no-cost assessment, access the Free tier of the New Relic system, which will process up to 100 GB of data per month.
- Dynatrace This SaaS package is written with AI features as its main selling point. The tool includes application performance mapping and ML-based anomaly detection. In addition, the package performs distributed tracing for microservices with the OpenTracing standard—access Dynatrace on a 15-day free trial.
