Java Management Extensions (JMX) is a technology used to monitor and manage Java applications, systems, and networks. It provides real-time insight into application performance, resource consumption, and overall system health, making it an important component for maintaining stable Java-based environments.
As Java applications become more complex, monitoring performance and identifying issues without dedicated tools can be difficult. JMX monitoring solutions address this by providing visibility into key system metrics and helping teams manage performance more effectively.
Here is our list of the best tools for JMX monitoring:
- ManageEngine Applications Manager EDITOR’S CHOICE One of the leaders in the applications monitoring and administration market, this tool can be used for JMX monitoring as well as their dependencies; it is a comprehensive production monitoring tool. Start a 30-day free trial.
- Site24x7 (FREE TRIAL) Another one of the major players, this tool tracks threads to isolate slow or resource-consuming processes; it works with current operations as well as historical data to spot trends or outliers. Start a 30-day free trial.
- AppDynamics Application Performance Monitor A SaaS tool from a leading tech company; it is a solution that integrates well into any architecture, located anywhere to spot errant business transactions, classes, and methods.
- Nagios This is a tool for monitoring mission-critical Java objects; it gives users full insight across the entire stack which is presented on powerful dashboards that give informative feedback that can be shared across the board.
- Datadog Apart from JMX, this modern monitoring and security tool allows for the collection of data from any part of a stack; this information can be aggregated to paint an even more insightful picture of the whole framework, not just Java.
- SolarWinds AppOptics A quality product that doesn’t break the bank; it is a highly customizable and very flexible tool that can be used in any infrastructure, regardless of size.
- G Innovations A tool with auto-discovery of assets that also includes cloud containers; it can be used for custom monitoring of software and hardware that is on any kind of deployment.
These tools typically include capabilities such as alerting and anomaly detection, which notify administrators when unusual behaviour or performance issues occur. This enables teams to respond quickly before problems affect users or lead to downtime. Many solutions also offer historical reporting and trend analysis, helping organisations understand long-term performance patterns and make informed optimisation decisions.
This guide highlights leading tools for monitoring Java applications, focusing on solutions that provide real-time metrics, customisable dashboards, and detailed visibility into JVM memory usage, garbage collection, thread activity, and response times. These insights help identify bottlenecks, improve troubleshooting, and maintain application stability.
By using the right JMX monitoring tools, organisations can optimise resource usage, improve performance, and ensure a reliable user experience across Java-based systems.
What is JMX?
Java Management Extensions (JMX) is a set of Java technology tools that are now part of its standard component. This set of tools is used to monitor and manage system objects, applications, and service-oriented networks.
These resources are represented by objects known as Managed Beans or MBeans. In other words, MBeans are managed Java objects.
On the other hand, JMX is to Java applications what SNMP is to network devices – because it too is used as a standard to connect to objects and listen for metrics.
The data that is collected is then aggregated and analyzed by monitoring and management tools to ensure their health and optimal performances.
This brings us to…
What is JMX Monitoring?
The term “JMX monitoring” refers to the administration and management of Java applications – and their dependencies – by querying data from MBeans.
An application or a tool for JMX monitoring is used to allow generic management platforms to keep track of the Java applications. They can use Java Virtual Machine (JVM) ports to keep track of isolated applications, devices, and systems running on a “foreign” or non-native platform.
Apart from monitoring, the tools can also send out alerts in case of issues, tweak the applications to remedy issues, and even change their states to control resource consumption.
JMX monitoring tools track metrics like availability, heap usage, garbage collection, response threads, and active threads to build a complete overview of performance – which is then presented in intuitive and comprehendible formats.
Why would you want to use a JMX monitoring tool?
In case you’re wondering, here are some reasons for using a JMX monitoring tool:
- Easy metrics collection Extracting metrics from JMX is a complicated technical process and administrators and developers who want deeper insight into their Java applications can simply use a monitoring tool to get the information and analysis they need.
- Quicker issue identification The tools can be configured to send out alerts that are triggered by set rules, conditions, or milestones; users will be informed of any issues round the clock.
- Actionable information Once the JMX monitoring tool has extracted the information, it can be reliably used to act upon to improve the performance of Java applications.
- Optimization of resource availability and performances The overall result is the monitoring and management of resources to increase service and application availability.
At the end of the day, all these advantages lead to one result: the quick resolution of issues, forecasting and trending to take actions before problems arise, and getting the best out of digital investments.
The Best Tools for JMX Monitoring
It is now time to have a detailed look at the seven best tools for JMX monitoring:
1. ManageEngine Applications Manager (FREE TRIAL)

ManageEngine is a major player in the software, hardware, and network tools for monitoring, administration, and security. Among its many products, we find Applications Manager – its flagship application performance monitoring software for insight into the performance and user experience (UI) of mission-critical applications, hardware, and connectivity components.
Applications Manager can monitor a wide range of software, including JMX.
Looking at some of ManageEngine Applications Manager JMX monitor’s features, we get:
- This tool allows for the monitoring of Java/J2EE Applications that expose business information via JMX.
- It can identify transactions, threads, and connection pools that are responsible for the over-consumption of resources; it can also perform a thread dump – which is a snapshot of the state of all the threads of a Java process – and analyze it using a thread dump analyzer.
- The Applications Manager JMX monitoring tool has a comprehensive production monitoring feature and an integrated view that is displayed on an interactive dashboard.
- It has a JMX metrics monitoring solution for querying and reporting on Managed Beans (MBeans) as well as other custom metrics like the state of memory management, class loading, active threads, and platform configurations – all the required resources to keep a strict eye on mission-critical applications.
- It can run MBean operations and custom scripts to help users troubleshoot and resolve issues arising when thresholds have been breached.
- The tool can be configured to send out alerts and notifications – users can create alerts that are triggered by faulty MBeans and then respond accordingly.
- It can be configured to automatically run maintenance tasks and upgrades with alerts set to be triggered in case of issues with applications.
- While the out-of-the-box reports are enough to keep any administrator on top of things, Applications Manager can be used to identify trends and correlate metrics to find out where the bottleneck is in a slow transaction.
Try ManageEngine Applications Manager FREE for 30 days.
EDITOR'S CHOICE
ManageEngine Applications Manager is our top pick for a JMX monitoring tool because it provides insights into Java applications and JVM performance. As a JMX monitoring solution, Applications Manager allows IT administrators to monitor key metrics such as memory usage, garbage collection, thread activity, and CPU utilization within Java applications. Its real-time monitoring and alerts enable proactive identification of performance bottlenecks, allowing teams to resolve issues before they impact end-users. The tool’s interface is user-friendly and allows for easy navigation through various JMX attributes and MBeans (Managed Beans), making it accessible for administrators with varied expertise levels. Applications Manager also offers customizable dashboards and in-depth reports, which provide a holistic view of application performance and can assist with capacity planning and long-term optimization. Automated alerts for anomalies in metrics further help maintain stability in production environments. Compared to other JMX monitoring tools, Applications Manager is well-suited for organizations looking to monitor not just Java applications but an entire IT infrastructure, as it integrates with over 100 different applications and systems. ManageEngine Applications Manager is an effective choice for Java-based and multi-technology environments.
Download: Get a 30-day free trial
Official Site: https://www.manageengine.com/products/applications_manager/download.html
OS: Windows Server, Linux, AWS, and Azure
2. Site24x7 (FREE TRIAL)

Here too, we have another major player in the digital assets monitoring and game. Site24x7 is a web-based platform – it is a website and server monitoring service provider.
It has an Application Performance Monitoring (APM) tool that is one of the most popular monitoring tools on the market today.
This tool is one of the best tools for JMX monitoring. Let’s see some more features:
- The tool’s Distributed Tracing feature allows for the tracking of transactions between applications and helps identifies errors and exceptions across the entire stack; meanwhile, the Custom Instrumentation – the process of instrumenting custom methods or frameworks – allows for the monitoring of custom classes, methods, and frameworks at the code level.
- It has alerting capabilities for when applications surpass or fail to reach set milestones; meanwhile, the tool’s reports help with the analysis of application performance with granular details for better understanding statuses and issues.
- Comparison reports help users analyze the changes – for better or worse – that have occurred over set periods.
- APM tracks thread profiles to identify lagging processes that suck resources.
- It also tracks product updates and feature enhancements for version control and audit trail purposes.
- One great feature that makes this tool stand out is its application dependency maps that allow users to see how applications connect, communicate, and depend on one another.
- Users can configure the tool to monitor key transactions and mission-critical processes – individually or in groups; they can add app parameters to gauge the frequency of operations or identify bottlenecks.
- All monitors can be activated, monitored, suspended, and deleted in bulk – after they have been grouped using tags or by being brought under a single monitoring group.
Try Site24x7 Application Performance Monitoring (APM) FREE for 30 days.
3. AppDynamics Application Performance Monitor (APM)

AppDynamics is part of Cisco and, as can be expected from a leading tech company, this product too is one of the best tools for JMX monitoring. This is thanks to its application performance monitor or APM that runs online – it is a SaaS tool that is deployable from the cloud. It also makes it the best choice for users looking for a solution that integrates well into any architecture, regardless of location.
But, there’s more:
- Right out of the box, it can be used to query JMX metrics – making it easy for users to monitor shared resources that have major impacts on application performances.
- This is an insightful and informative tool that lets users view MBean-based metrics with its Node Dashboard and Metric Browser – two examples of insightful sources of information; another example is the Live Graph feature that allows for the monitoring of trends of particular MBean attributes over some time.
- In cases where new parameters need to be added – to test scenarios, for example – the tool allows for the injecting of custom events, or new metrics, and then reporting on them.
- Deeper insights can be achieved by correlating distributed transactions – this is especially useful when it comes to analyzing and working with protocols that AppDynamics doesn’t support.
- The information gathered from JVM dependencies can be visualized in interactive maps; the tool also automatically discovers all assets that service and interact with a Java Application and JVM – which it then maps too.
- Then there is a comprehensive metrics viewer for correlating, trending, and analyzing metrics from JVM and containers; a custom MBeans can also be used to monitor for memory leaks and object trash issues.
- The tool also identifies business transactions, classes, and methods that are over-consuming JVM resources, like thread and database connection pools.
- On the other hand, users can choose to monitor thread pool utilization and column family (a database object that contains columns of related data) activity to troubleshoot performance issues.
Try AppDynamics Application Performance Monitor (APM) FREE for 15 days.
4. Nagios

Nagios is a provider of a complete monitoring tool for JMX. It makes one of the most powerful and trusted infrastructure monitoring tools on the market.
Let’s have a look at some features:
- Nagios is a tool for monitoring mission-critical infrastructure components including applications, services, operating systems, network protocols, systems metrics, and network infrastructure.
- Apart from JMX, it can be used to monitor hundreds of in-house applications, services, and systems – this gives users an overall, bird’s eye view of the whole digital infrastructure.
- Users can take advantage of views that provide them with quick access to network incident information and resolve them before they turn into major incidents; the tool provides a central view of the entire network and business processes via powerful dashboards that provide at-a-glance insight into monitoring information and third-party data.
- These dashboards are customizable and give access to high-level overviews of hosts, services, and network devices while a powerful GUI makes it easy for customization of layouts, designs, and preferences on a per-user basis.
- It is a great collaboration tool that allows multi-user access via web interfaces that allow users to view statuses and updates; administrators can create user-specific views to ensure other users only see the information they’re authorized to.
- Administrators also have access to advanced user management that simplifies access and account management – for example, accounts can be created with a few clicks following which users are immediately notified via email about their login credentials.
- The most recent configurations are archived and can be reverted to whenever they are needed – this saves time and ensures a fallback configuration in case something goes wrong.
- This is a tool that encourages integration – it has multiple APIs for easier integration with the technology in place; it is an ever-evolving tool with thousands of community-developed add-ons to extend its features.
Try Nagios for FREE.
5. Datadog

Here we have another leading maker of monitoring tools. Datadog has an agent – aptly called Datadog Agent – that calls JMXFetch, a lightweight Java plugin, which connects to an MBean Server and collects all the required data and application metrics.
This Java integration also allows for the collection of traces and logs from Java applications.
There’s more:
- This is a modern monitoring and security tool that allows for the collection of data from any part of a stack be it an application, operating system, hardware or connectivity device.
- Datadog is a SaaS for infrastructure monitoring that provides metrics, visualizations, and alerts to help with the maintenance and optimization of on-premise, cloud, or hybrid environments.
- This is a tool that is easy to work with – everything from installation to gaining insight into applications and infrastructures is easy; in addition, it covers a wide array of technologies, helps with collaboration, and ensures the rapid resolution of issues.
- This is a low-code configuration tool that can be implemented across the board, without the need for professional services, training, or query language; once deployed, users can start slicing and dicing their infrastructure using tag-based search and analytics.
- It can track thousands of metrics right out of the box, and is always learning – its machine learning-powered tools can automatically spot issues by just monitoring “noise.”
- Troubleshooting can be done on data past or present – the tool shows continuous historical records (even when the digital assets that produced them are offline); administrators can sift through correlated data from metrics, traces, and logs.
- Apart from the common metrics, users can decide which metrics they deem to be valuable and incorporate custom metrics; they can also track the impact of every process in the stack and then preserve the mathematical accuracy and granularity of queries.
Try Datadog FREE for 14 days.
6. SolarWinds AppOptics
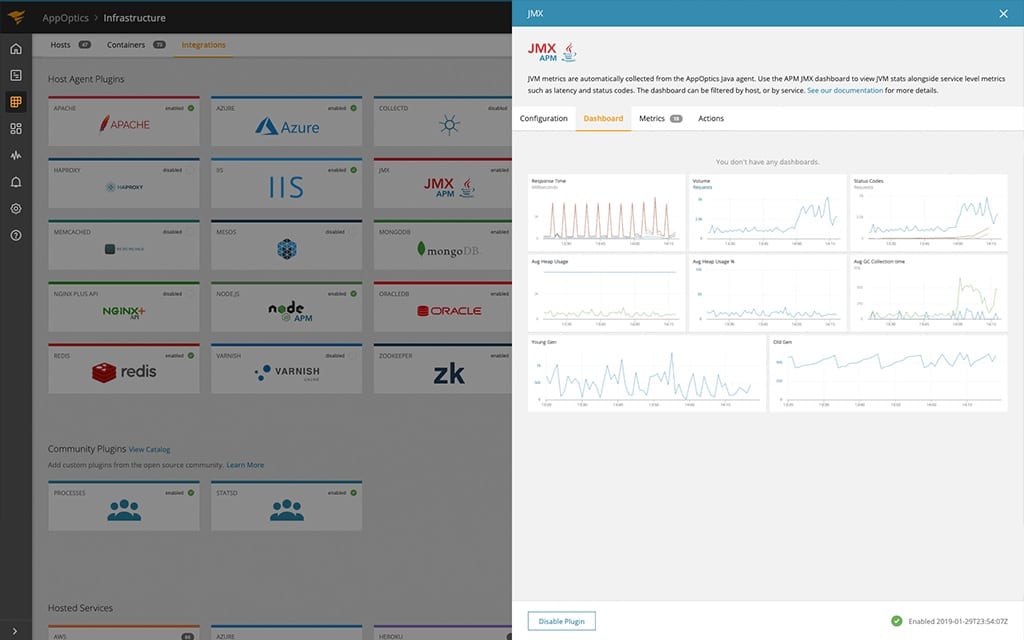
SolarWinds is one of the biggest players in the infrastructure and asset monitoring market – if not the biggest one. It has quality products – a lot of them, to be more precise – one of which is AppOptics. This is a tool that monitors the whole stack.
Key Features:
- It leverages Java monitoring using JMX metrics and gives an in-depth insight into the full stack and gathers important data about configurations, performances, and usage of Java applications.
- It also gives insights into infrastructure resources, database queries, frameworks, remote calls, and other operations regardless of the topology – be it involving monolithic or microservices-based distributed applications.
- Apart from applications, this tool can collect JMX metrics from a wide array of software solutions like Apache Cassandra – the popular NoSQL database management system (DBMS).
- AppOptics is also very intelligent – it can track the entire path of every request across all related services, processes, and hosts; this collected information can then be drilled into for further, detailed information – it even gives suggested remedial actions to be taken for a quicker resolution of the issues.
- Although AppOptics comes with default dashboards that are intuitive, easy to navigate, and responsive – they help alert on, access, and monitor performance metrics like heap size and garbage collection; when needed, the monitoring can be customized to meet unique information queries or insight needs.
- If all fails, and the user is still not happy, they can create new custom dashboards or reconfigure the existing ones to their heart’s content, and until they meet the requirements of the deployments they are supposed to monitor; it is a highly flexible application performance monitoring (APM) tool that allows for custom alerts and thresholds to help ensure users get proactive notifications on specific key metrics.
- Users can use the AppOptics Java libraries, and JMX metrics, to query MBeans and get a better look into the overall health of their resources; since the tool consolidates application and infrastructure performance metrics, users can cross-reference the data and user input information to trace relationships and dependencies with ease.
Most importantly, it has JMX Monitoring – an intuitive, affordable JMX monitoring solution that helps users quickly identify issues.
Try SolarWinds AppOptics with a fully functional 30-day free trial.
7. eG Innovations

The eG Enterprise JMX monitoring tool makes it easy to keep an eye on JVMs and Java web application servers.
This tool tackles and improves the performance of applications by exposing bottlenecks across the stack – from code-level to the infrastructure.
There are more features:
- This tool has a tiny digital footprint as it uses both agentless and agent-based monitoring of a network’s Java applications using JMX – this means users can monitor their running applications without having to write a single line of code.
- It can monitor JVM performance, and leverage JMX to monitor cloud containers, as well as allow for the customized monitoring of Java applications; it is an ideal tool for monitoring applications, digital workspaces, and IT infrastructures.
- It has baselines and thresholds – that can easily be reset with a few clicks from users – that can serve as triggers for issues with MBeans or any other assets.
- It automatically discovers MBeans of target applications – with the option of importing them – and tracks them for metrics like raw values, rate of change; it also allows for receiving alerts in case any outliers are spotted.
- eG Enterprise works in any environment – in the cloud, in on-premises deployments or hybrid-cloud setups; it can be deployed using a SaaS platform or on-premises – this makes it a truly flexible tool.
- As the name suggests, this tool is suitable for monitoring a larger infrastructure with a mix of objects installed on it.
Try eG Enterprise FREE for 30 days.
Keep your Java applications healthy and productive
Java plays a big part in the modern application development and execution process. It is estimated that the technology holds over a third of the programming language market. Some of the most popular software solutions are built using the technology or use it as an engine.
The chances of the technology running in any business, big or small, are high. This also applies to your business – and you must keep these applications healthy and productive. We hope the seven best tools for JMX monitoring will help.
Let us know what you think – leave us a comment below.
