Kubernetes is an open-source platform that has transformed how organisations deploy, manage, and scale containerised applications. As its adoption grows, securing Kubernetes environments has become a critical priority for businesses running modern cloud-native infrastructure.
Here’s our list of the best Kubernetes monitoring tools:
- Site24x7 Kubernetes Monitoring EDITOR’S CHOICE This cloud-based monitoring service tracks the performance of a range of software systems and platforms, including Kubernetes. The service will also watch over Docker activities. Access the 30-day free trial.
- ManageEngine Applications Manager (FREE TRIAL) A reliable monitoring solution that offers centralized visibility and detailed insights into distributed Kubernetes environments. Download a 30-day free trial.
- Datadog Application Performance Monitor A full-stack Kubernetes monitoring tool that is best at presenting metrics in GUIs (graphical user interfaces) that are informative, easy to comprehend, and highly interactive.
- Dynatrace Kubernetes monitoring solution that hits the ground running; no code tinkering or reconfiguration is needed; start monitoring the full stack in a matter of minutes.
- AppDynamics Application Performance Management Covers Kubernetes stacks as well as the network; it is especially good at error reporting and troubleshooting.
- SolarWinds Server & Application Monitor A Kubernetes monitoring tool from the leader in application and infrastructure monitoring that offers a complete full-stack monitoring solution.
- Prometheus Open-source and free Kubernetes monitoring tool that has a large community to help with configuration and administration issues; it is best suited for complex deployments.
Kubernetes provides a highly flexible and automated system, but its distributed architecture and complexity introduce unique security challenges. Without a strong security strategy, organisations risk exposing themselves to vulnerabilities that can result in data breaches, service interruptions, and unauthorised access to sensitive resources.
Kubernetes security issues
Securing Kubernetes involves protecting both the control plane and the workloads running on worker nodes. The control plane manages the overall cluster and includes components such as the API server, scheduler, and controller manager. Protecting it is essential, as compromised access could give attackers full control over the environment.
Worker nodes, which run the containerised applications, also require strong security controls to prevent exploitation of vulnerabilities within individual containers. Both layers must be secured to maintain overall cluster integrity.
Kubernetes security includes a combination of practices such as implementing network policies, enforcing access controls, and encrypting sensitive data. It also requires continuous monitoring to detect misconfigurations and potential threats that could weaken the environment.
As Kubernetes becomes more widely used in production systems, organisations must adopt security best practices and use specialised tools to protect their deployments. This guide explores the key areas of Kubernetes security and how to safeguard containerised applications effectively.
Why use Kubernetes?
Kubernetes (a.k.a., K8s) is an open-source system for automating the deployment, scaling, and management of containerized applications that was originally created by Google and is now maintained by Cloud Native Computing Foundation.
It is used to group containers that constitute an application into logical units for easy management and discovery. Kubernetes builds upon 15 years of experience of running production workloads at Google, combined with best-of-breed ideas and practices from its user and support community.
It is a highly versatile solution that can run anywhere – because Kubernetes is open-sourced it offers the freedom to take advantage of on-premises, hybrid, or public cloud infrastructures which, in turn, allows for workloads to be moved effortlessly to wherever they may be needed.
How do you secure Kubernetes?
Immediate steps that can be taken to secure Kubernetes include:
- Making sure all aspects of the system – from pod to platform – are up and running healthy with all required resources at their disposal.
- Run infrastructure that has the latest image or version of operating systems and applications to ensure no exploitable vulnerabilities and loopholes exist.
- Monitoring all systems to check for irregularities and any signs of malicious activity – be it from inside or outside the system – by keeping an eye on APIs and system calls.
- Analyzing the traffic packets that pass to and from the Kubernetes stack and environment to spot any indications of hacking, DDoS, or attempts at other malicious activity.
- Instant and real-time reporting to give a clear snapshot of the current status of the entire system.
- Audit trail and logging to keep track of changes and actions that can later help in troubleshooting and trend analysis.
All these security measures can be ensured with the help of a Kubernetes monitoring tool, a few of which we will now be viewing.
The best Kubernetes monitoring tools
Our methodology for selecting a Kubernetes security monitoring tool
We reviewed the market for Kubernetes monitoring systems and analyzed tools based on the following criteria:
- Container activity tracking
- Mapping to the underlying infrastructure for resource monitoring
- Root cause analysis
- Functions for monitoring Docker as well
- Application monitoring
- A free trial or a demo that offers a no-cost assessment opportunity
- Value for money, represented by a tool that can monitor other infrastructure as well as Kubernetes at a reasonable price
With these selection criteria in mind, we have identified comprehensive tools that can track many infrastructure systems as well as Kubernetes.
1. Site24x7 Kubernetes Monitoring (FREE TRIAL)

Site24x7 Kubernetes Monitoring is part of a cloud-based infrastructure monitoring system that is able to track the performance of a range of resources, including software and service management packages, such as Kubernetes and Docker.
Key Features:
- Cloud-based
- Monitors infrastructure and applications
- Integration for Kubernetes
- Network monitoring
Why do we recommend it?
Site24x7 Kubernetes Monitoring is part of a full stack monitoring package that is hosted on the Site24x7 cloud platform. The subscription plans of Site24x7 enable simultaneous monitoring of applications, the containers that deliver them, the Kubernetes rules that manage them, and the server resources that support them.
This monitoring service includes automated systems that can detect evolving problems, using AI techniques. The service raises an alert when such a potential issue is spotted. This draws the attention of technicians who can take action to head off the problem before it starts to impair system performance noticeably. It is also possible to permit the system to implement automated remediation actions in certain circumstances.
Site24x7 Infrastructure has a range of perspectives on the activities of Kubernetes and the containers that it manages. It will watch each cluster while also tracking the actions of each node and pod. The service drills down to the underlying resources that these containers are using to ensure that there is sufficient capacity available.
This monitoring service isn’t limited to watching over the activities of Kubernetes on your own servers. It will also track the performance of Kubernetes on Azure, AWS, and Google Cloud Platform accounts.

The Site24x7 Infrastructure monitor is aware of all of the processes that contribute to Kubernetes activity and monitors each of them individually. This extends to components, such as kube-controller-manager, kube-scheduler, and kube-apiserver. The system also watches how these processes terminate and clean up to ensure that there are no hanging processes or abandoned but occupied memory.
Who is it recommended for?
Kubernetes offers plans for small businesses. These are very affordable but don’t offer much capacity, so larger business pay for more monitoring volume. This pricing strategy makes the system very scaleable and suitable for all sizes and types of businesses. The cloud-hosted system is hosted can consolidate the monitoring of services on multiple sites and cloud platforms.
Pros:
- One of the most holistic monitoring tools available, supporting networks, infrastructure, and real user monitoring in a single platform
- Uses real-time data to discover devices and build charts, network maps, and inventory reports
- Is one of the most user-friendly network monitoring tools available
- User monitoring can help bridge the gap between technical issues, user behavior, and business metrics
- Supports a freeware version for testing
Cons:
- Is a very detailed platform that will require time to fully learn all of its features and options
Site24x7 Infrastructure is a subscription service with a charge rate per month or per year. The package is offered as a base service with a long menu of added extras. You can try Site24x7 Infrastructure’s Kubernetes monitoring service without cost on a 30-day free trial.
2. ManageEngine Applications Manager (FREE TRIAL)

ManageEngine Applications Manager is another valuable tool that many IT businesses utilize to track and monitor their containerized applications in real-time. Whether you want to manage complex layers of distributed Kubernetes environments or track the availability of Kubernetes clusters, it can be a perfect fit.
Key Features:
- AI-powered insights
- Deep diagnostics
- Real-time alert systems
Why do we recommend it?
ManageEngine Applications Manager is an all-in-one tool that comes with a wide range of features and solutions, including Kubernetes monitoring. It includes container monitoring service, cloud monitoring, and more.
With access to container monitoring features, businesses can monitor the performance of Docker, Kubernetes, RedHat OpenShift container applications, and more in real-time. The tool provides a holistic overview of key performance indicators, making it easier and faster to detect performance issues. Further, the tool supports seamless integration with some of the popular and trusted orchestration tools like Kubernetes, Docker Swarm, and cloud providers like AWS, Azure, and GCP.

Another factor that makes this Kubernetes monitoring tool a top choice is its ability to provide detailed insights into metrics and events, real-time alert options, proactive node health checks, and data-rich dashboards.
Who is it recommended for?
Any business that demands an all-in-one solution, including other monitoring features apart from container monitoring, might find it a good option. The tool covers different monitoring solutions in a single console.
Pros:
- Offers in-depth insights into Kubernetes clusters and environments.
- Enables team members to keep track of container health and the performance of pods.
- Provides alerts and notifications in real-time using different mediums and channels.
- Performs proactive node health checks to reduce disruptions.
Cons:
- Exploring all features within the tool may take some time for new users.
Users can monitor up to 500 to 1000 applications using paid editions. If you want to assess the product and its features, you can even download a 30-day free trial.
3. Datadog
Here we have an observability platform from Datadog that can also be used to monitor the whole Kubernetes stack: metrics, distributed traces, log analytics, synthetics, and network performance monitoring.
Key Features:
- Cloud-based
- Distributed tracing
- Also monitors Docker
Why do we recommend it?
Datadog is a large platform of system monitoring tools and it has recently expanded into security monitoring. Its services include a Container Monitoring service and a Cloud Security Management plan. The cloud security system provides preventative scanning and live security monitoring. The Container Monitoring service also examines the services and server resources employed by the containers.
The monitoring is done using the Datadog Agent, an open-source piece of code that runs on the host and sends the metrics back to the main application. Datadog seamlessly aggregates metrics and events across the full DevOps stack.It has the ability to monitor, troubleshoot, and optimize application performance via the Application Performance Monitor (APM). It has an option to search, filter, and analyze logs for troubleshooting.
The Datadog dashboard shows high-resolution metrics and events for manipulation and graphing in real-time. Alerts can be configured on any metric, be it for a single host or for an entire cluster, to send out notifications via email, PagerDuty, Slack, and many more channels.
This Kubernetes monitoring tool includes a full API access for better observability into apps and infrastructure. The tool also has a set of sample applications that DBAs can launch to test their configuration and see if it is responding as expected. The querying system is a useful feature that has a query language that is robust as well as highly flexible to meet any search for information.
Apart from Kubernetes, Datadog also works with Docker Swarms, Amazon ECS, and other orchestration platforms.
Datadog is easy to install as it is a product of a Software as a Service (SaaS) provider that supports a full stack.
Who is it recommended for?
That cloud security package is divided into two modules, a Cloud Security Posture Management system and a Cloud Workload Security plan. These both monitor cloud platforms, and infrastructure, which includes containers and Kubernetes management services. Cloud Security Management is available for US and EU-hosted accounts.
Pros:
- Offers templates and pre-built monitors for Kubernetes monitoring and security enforcement
- Easy-to-use customizable dashboards
- Supports auto-discovery that builds network topology maps on the fly
- Changes made to the network are reflected in near real-time
- Allows businesses to scale their monitoring efforts reliably through flexible pricing options
Cons:
- Would like to see a longer trial period for testing
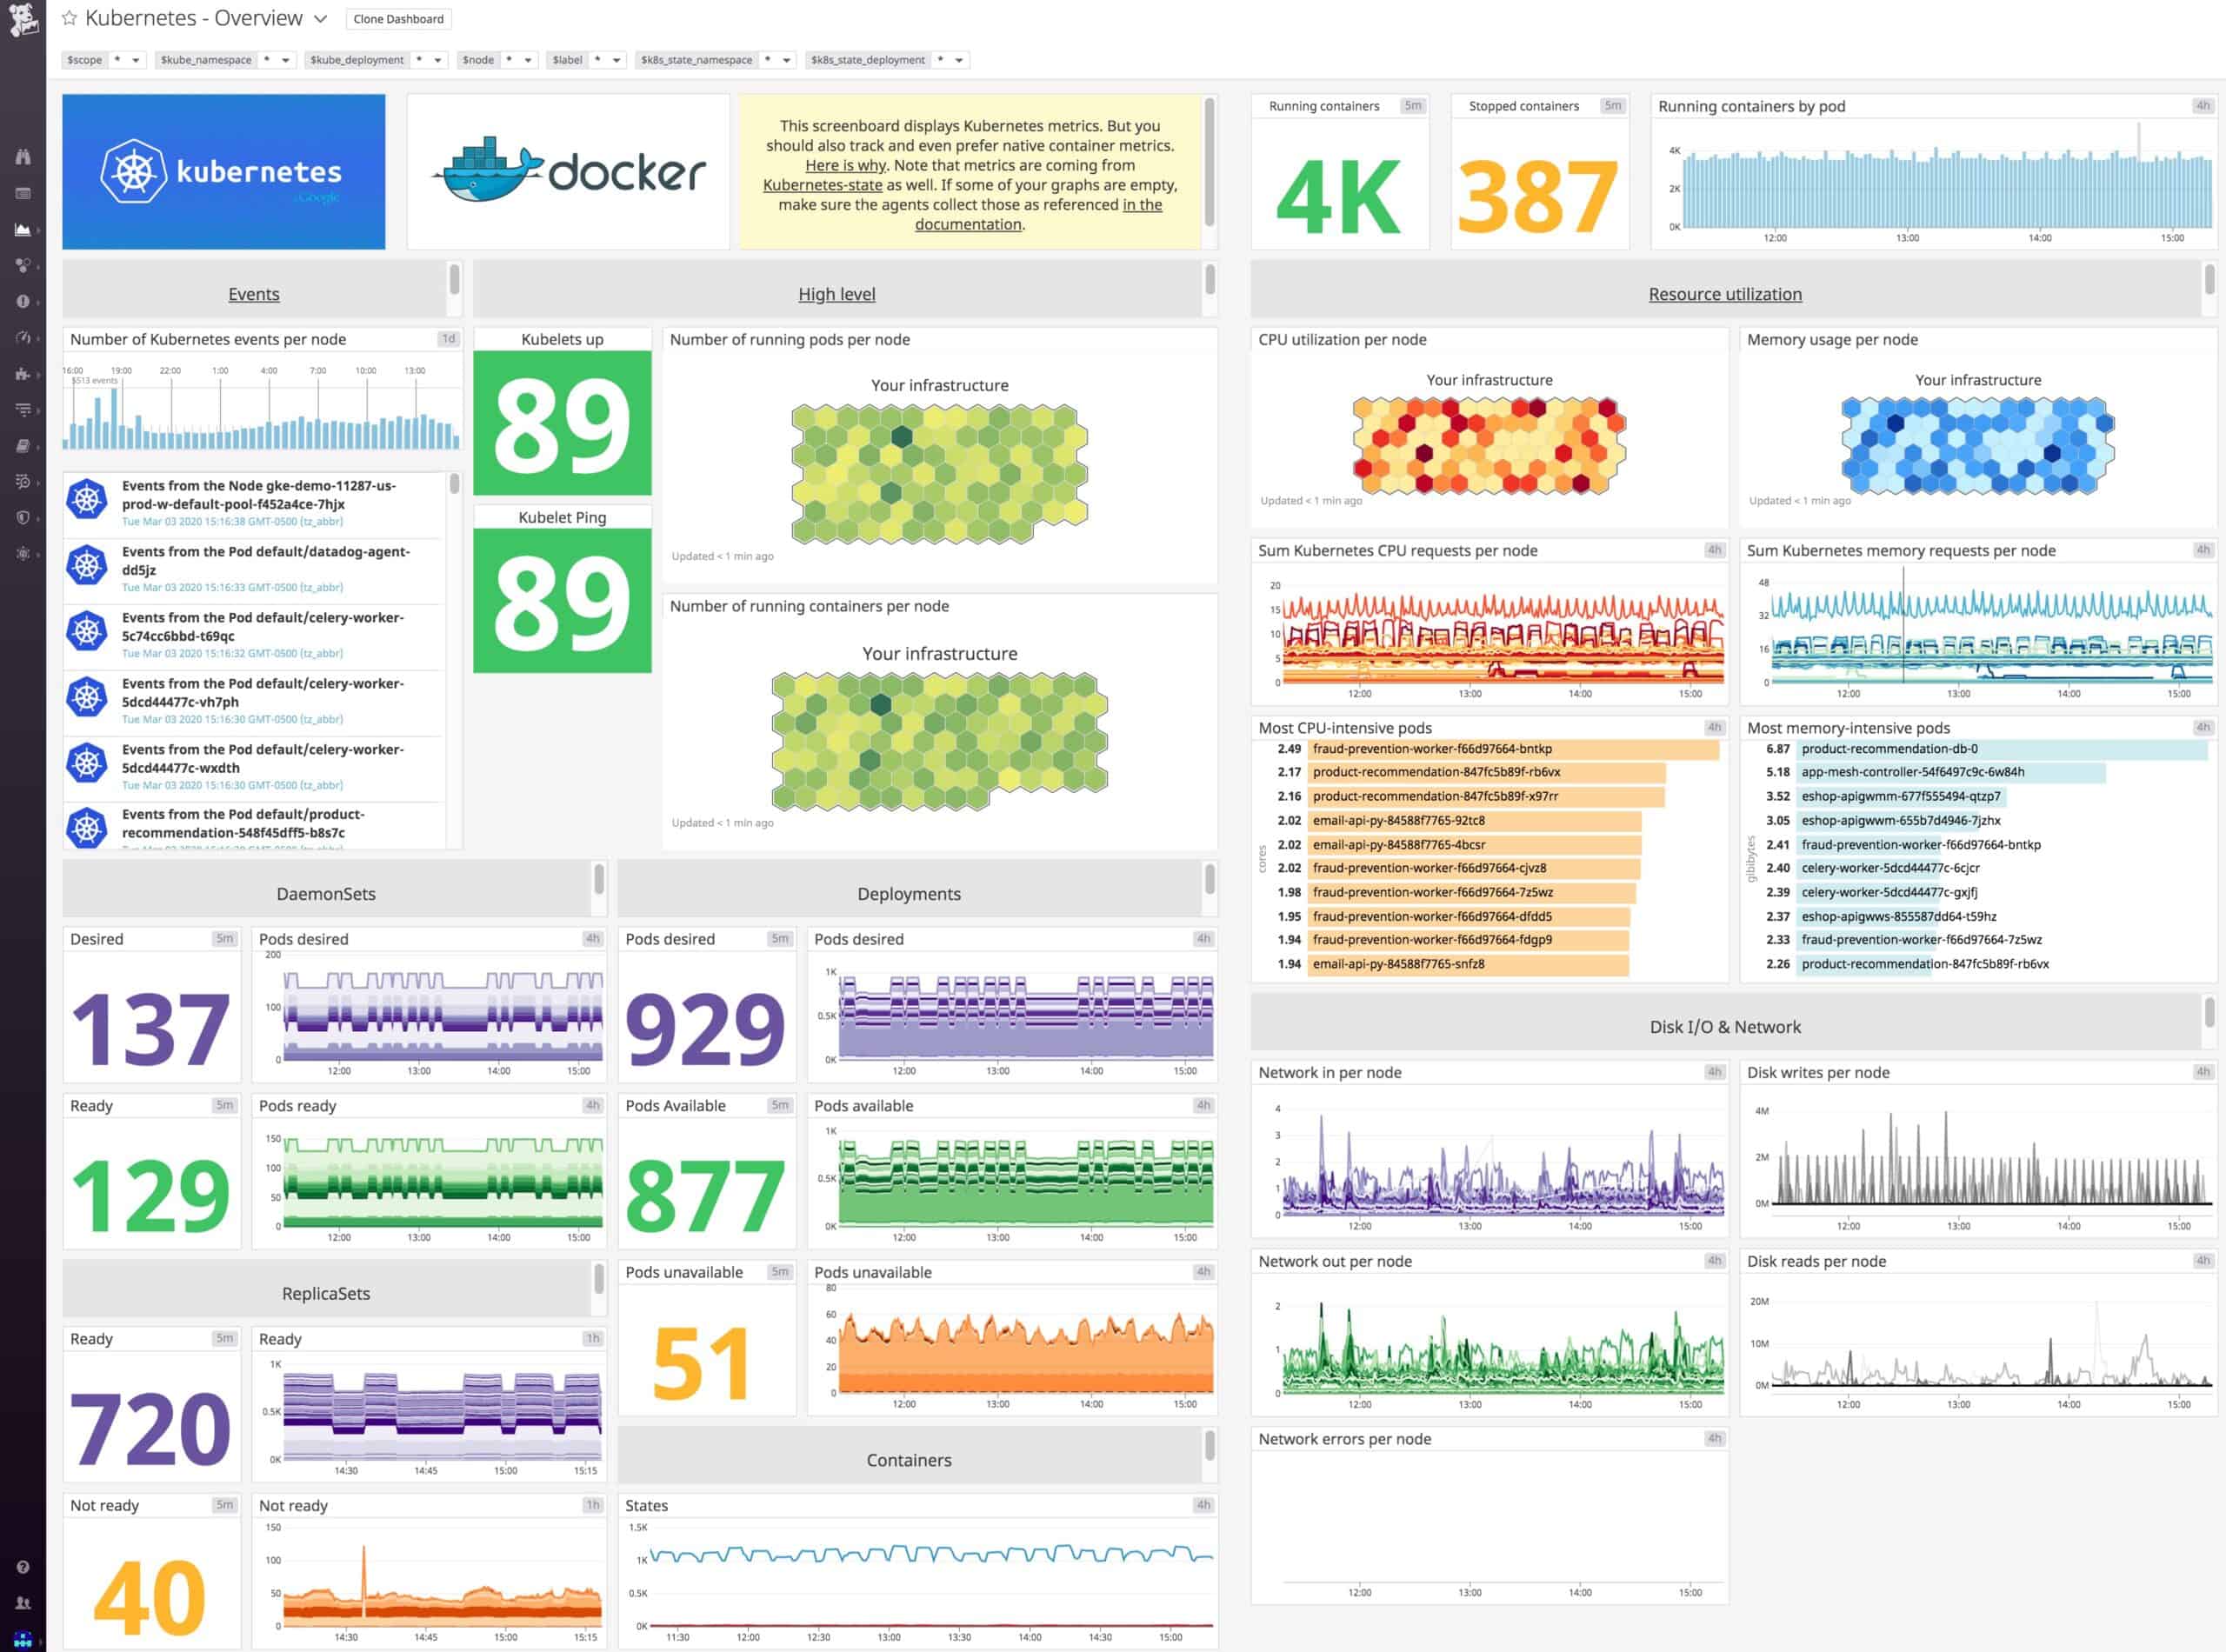
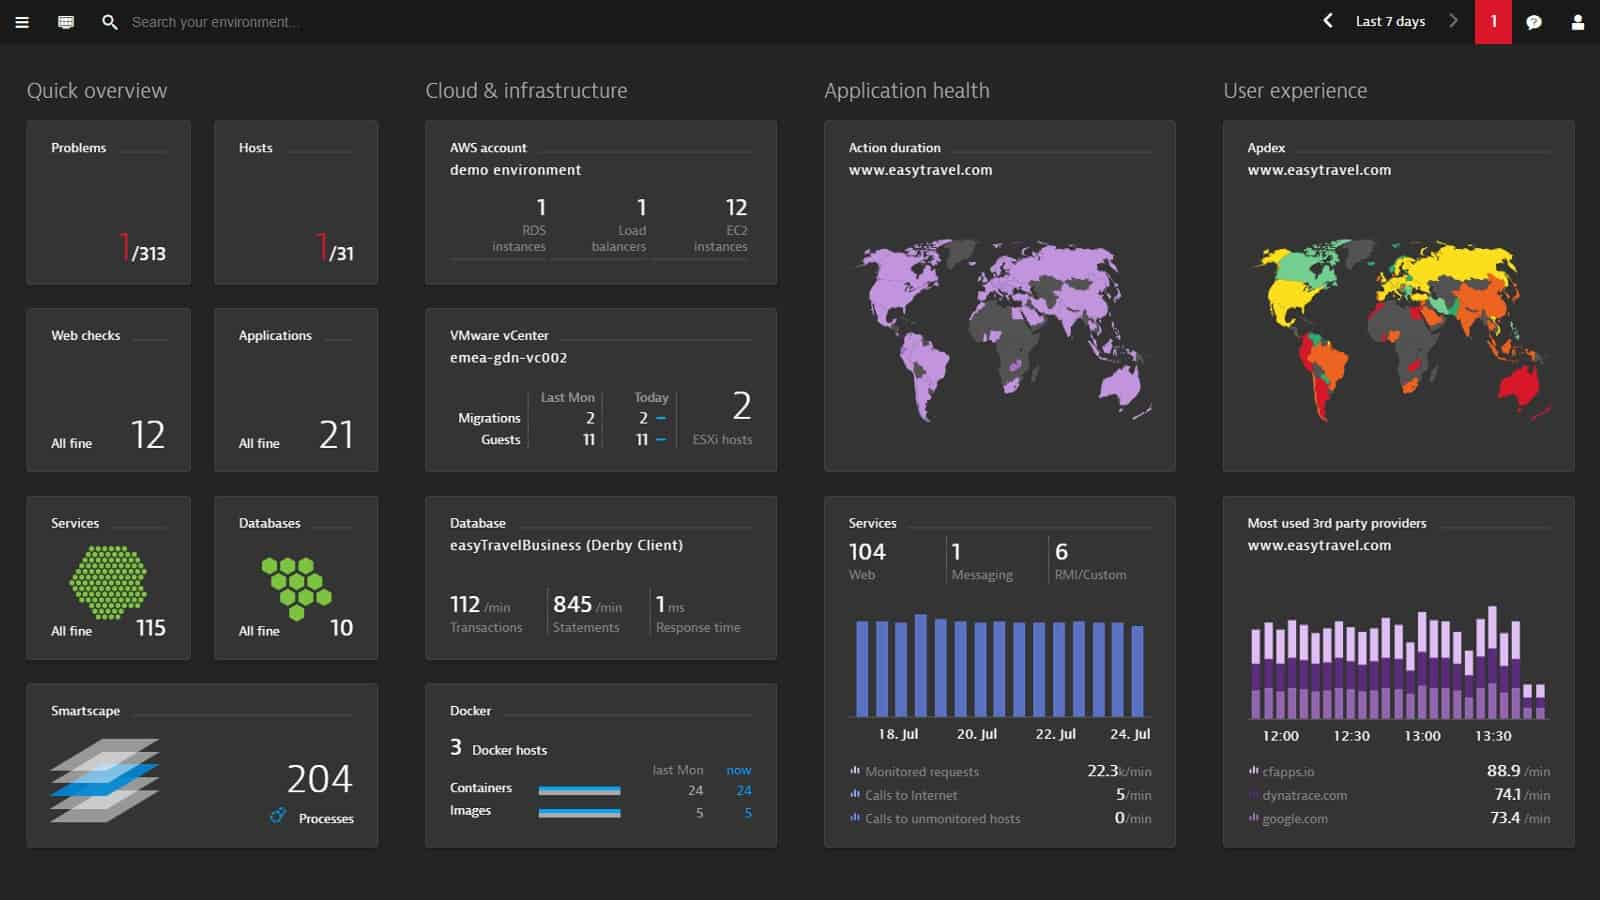
Datadog also comes with preset Kubernetes dashboards and provides numerous graphical presentations. Better yet, there are many widgets to create various custom dashboards. Try it free for 14 days.
4. Dynatrace
Dynatrace offers an out-of-the-box Kubernetes monitoring solution that provides full-stack observability without the need to change any code, container images, or deployment configurations.
Key Features:
- Cloud-based
- Resource dependency identification
- Kubernetes performance monitoring
Why do we recommend it?
Dynatrace is an excellent application monitoring system for Web applications and cloud-based systems but it also delivers an Infrastructure Monitoring package. This service includes container and Kubernetes monitoring. In addition, the platform has an Application Security plan that also protects containers and Kubernetes.
Dynatrace, one of the biggest players in the cloud monitoring tech industry, has a Software Intelligence Platform that was specifically created to complement Kubernetes. It comes with extensive features that help ease the development and deployment cycles and the performance issues that may come with them.
Dynatrace can be used to monitor complex and dynamic cloud infrastructures; the tool offers seamless container and microservices monitoring with auto-discovery of all container technologies. The monitoring dashboard covers server dependencies, interactions, and issues – admins can see how many cluster resources have been allocated through the workloads that are running on each one of the clusters.
The “Cloud Applications” view covers Kubernetes workloads like Deployment, DeploymentConfig, ReplicaSet, DaemonSet, StatefulSet, StaticPod, and ReplicationController.

The CPU throttling metric shows how long an application was throttled – this helps determine where more CPU time would be required for processing because this usually happens when the containers don’t have enough CPU limits in the workload definition.
Who is it recommended for?
The Application Security package is a complex system that includes AIOps systems. This is designed for use by operations teams. So, it is aimed at businesses that run container-based applications. The service provides vulnerability scanning for containers and Kubernetes settings as well as live security monitoring.
Pros:
- Highly visual and customizable dashboards, excellent for enterprise NOCs
- Operates in the cloud, allowing it to be platform-independent
- Can monitor application uptime as well as the supporting infrastructure and user experience
Cons:
- Designed specifically for large networks, smaller organizations may find the product overwhelming
The intelligent microservice integration identifies and maps all services and supporting processes – even when they are outside containers.Simple installation using OneAgent Operator on Kubernetes also means that, in case of scaling up or down, no configuration or changes need be made to existing deployed images. Start a free 14-day trial.
5. AppDynamics
AppDynamics – a part of Cisco – offers deep visibility into applications on platforms like Kubernetes. It discovers all components of resident applications and even traces every transaction that occurs between the components – be they local or external.

AppDynamics Cluster Agent, a Kubernetes native application built to watch cluster events and tracks resource consumption, network health, and configuration has a light digital footprint and a low overhead. Cluster Agent – which works with their Application Performance Management (APM) tool – gives an overview of the cluster inventory – including pods, namespaces, deployments, daemon sets – and their current states for a better outlook on the performance of the business as a whole.
Key Features:
- Cloud-based
- Automatic asset discovery
- Dependency mapping
Why do we recommend it?
AppDynamics is a similar system to Dynatrace because it offers AI-laced monitoring for Web applications and has a plan for infrastructure monitoring that will cover containers and Kubernetes. The tool will watch over cluster capacity and the availability of resources to support them. This tool extracts data from cloud platforms to track container performance.
It also monitors the Kubernetes services from the network perspective to show traffic and its performance between different components to help prevent networking issues like packet loss. Insights also exist for the infrastructure – the health of the Kubernetes clusters and the underlying hosts or platforms, for example.
The dashboard shows the Agents’ collected metrics in categories for easier understanding; this helps with identifying issues and their causes which could be applications, Kubernetes infrastructures or underlying hosts.
Error reporting shows incidents like the number of error events in clusters, number of evicted pods, and number of threats – to help in timely resolution and avoid cluster meltdowns. It also gives insights into clusters’ processing capacities – CPU, memory, and the number of pods, for example. Admins can look at categories of errors like pods’ restart and crash loops (indicating application problems) or image and storage issues (due to misconfiguration, insufficient permissions, or quota violations), for example.
CPU and memory utilization is tracked relative to requests and limits declared during deployment and have recommended baselines that can be used to monitor over-consumptions or be used as alert triggers.
It can even show violations of best practices – like privileged pods, namespaces without quotas, and pods without health probes.
A rather unique feature involves tracking missing dependencies – missing config maps that may have been removed after a deployment or missing services that are supposed to route traffic to an application pod, for example; as well as any unused services and those with IPs in a NotReady status.
Who is it recommended for?
AppDynamics works best with both the application and infrastructure monitoring services of the Premium Edition. However, the Infrastructure Monitoring plan is much cheaper with a subscription rate that is just 10 percent of the price of the Premium Edition. So, small businesses on tight budgets could make so with just the Infrastructure option.
Pros:
- Tailored for large-scale enterprise use
- Excellent dependency mapping and visualizations to help troubleshoot complex application systems
- Includes a free version
Cons:
- Can have a steep learning curve
- Better suited for larger dev teams
The Agent searches for assets in a cluster by pod names, namespaces, and metadata – once found, admins can drill down into them to see the health, resource consumption, and metadata to make sure all is as it should be. Try it free for 14 days.
6. SolarWinds Server & Application Monitor

SolarWinds, the maker of many popular infrastructure and software monitoring tools on the market today, offers a solution for Kubernetes monitoring as part of its Server & Application Monitor (SAM). It’s called The Orion Platform.
Some Key Features:
- Management of devices, discoveries, polling methods, and much more from a central console.
- Automatic discovery can be further enhanced with manual adding of devices and then monitored using ICMP, WMI, SNMP, or agents.
- Monitoring, addition, deletion, and editing of assets and their properties from one central place.
- On the other hand, the SNMP processing load can be minimized using Discovery Ignore List to skip unwanted assets; the tool can suspend data collection or alerts for nodes that are under maintenance.
- Securing a Kubernetes platform can be enhanced with the help of Active Directory (AD) and SNMP credentials.
- Nodes can be imported from a list of IP addresses, assigned from ICMP to SNMP monitoring, and vice versa.
- Alerts can be configured to keep track of issues and even customized to address unique triggers or milestones.
- Alerts can also be triggered by the performance metrics; after all, they are created to automate the monitoring of business-critical services and applications. SolarWinds does that best with its cornucopia of application, server, and network monitoring and management tools that can be brought on board.
Why do we recommend it?
SolarWinds Server & Application Monitor tracks software systems and the services that support them. It continues its monitoring layers all the way down to server resources. The monitoring of containers and Infrastructure-as-Code systems. It is possible to impose access controls on container systems via Active Directory. This software runs on Windows Server.
The Orion Platform lies at the core of the SolarWinds’ IT software and hardware management and monitoring portfolio. It provides a stable and scalable architecture that includes data collection, processing, storage, and real time reports that show the current status of Kubernetes containers.
It also offers common administrative features like management of user accounts, groups, views, dashboards, reporting, alerting, and much more. These features can be used across all Orion Platform products and are accessed from the Orion Web Console.

Insights give an idea about the container infrastructure – things like hosts, clusters, dependencies, and deployments are presented in a clear, comprehensive graphic way. Tracking of metrics from containers, hosts, and the infrastructure helps with issue-handling and trend forecasting.
Who is it recommended for?
Although this is a software package for Windows Server, this system is not limited to monitoring services hosted on that platform. It can also monitor applications and infrastructure hosted on Azure and AWS. Its resource usage monitors will spot anomalous activity, which could represent a security attack.
Pros:
- Designed with large and enterprise networks in mind
- Supports auto-discovery that builds network topology maps and inventory lists in real-time based on devices that enter the network
- Has some of the best alerting features that balance effectiveness with ease of use
- Supports both SNMP monitoring as well as packet analysis, giving you more control over monitoring than similar tools
- Uses drag and drop widgets to customize the look and feel of the dashboard
- Robust reporting system with pre-configured compliance templates
Cons:
- Designed for IT professionals, not the best option for non-technical users
You can download a 30-day fully functional free trial.
7. Prometheus

Prometheus is an open-source instrumentation framework that can absorb and process massive amounts of data per second, making it well suited for large workloads on complex Kubernetes deployments.
Key Features:
- Free to use
- Kubernetes service discovery
- Performance alerts
Why do we recommend it?
Prometheus is a flexible package that can be tailored to any type of data modeling. The tool is free to use but you need to have a lot of technical expertise to get it to perform a specific type of monitoring, such as that for Kubernetes security. You won’t get vulnerability scanning from this tool but you can get activity monitoring.
Prometheus can be used to monitor servers, VMs, or databases – and draw on the data extracted from them – to help analyze the performance of applications and the infrastructure as a whole.
The tool is Kubernetes-native, simple to use, and has a huge community just in case support is required. The data extracted from the monitoring of a Kubernetes deployment is stored in a flexible multi-dimensional model, label-based, time-series database that can be queried with PromQL. This allows for problem diagnosis as it occurs and without having to independently recreate the issue outside of the system later.
The built-in Alertmanager sends out notifications via pre-configured methods and based on rules set by admins. Pull-based metrics or a pull-based monitoring system means that other services don’t have to know where the monitoring system is located. Admins can simply expose the metric as an HTTP endpoint and Prometheus will extract the data.
The Kubernetes service discoveries that can be exposed to Prometheus include nodes, endpoints, pods, and ingresses.The tool supports both white box and black box monitoring which provides extensive instrumentation client libraries that make it easy to expose metrics to applications written in languages like Python, Ruby, C++, and C#, to name a few. Any collected data can also be exported to graphical interfaces like Grafana – an open-source observability platform that is extremely user-friendly – or used to send alerts via the Alertmanager.
The Prometheus dashboard itself can be used to query metrics like memory or CPU usage, requests, and limits as well as limit commitments. Prometheus can also analyze long-term trends in a software package as it runs in production and can also debug performance issues.
With all this being said, it wouldn’t be fair to skip one drawback: because of the way Prometheus works – a pull-based system that listens on a single endpoint – it means it only operates as a single server per application. In other words, while it is relatively straightforward to set up a single Prometheus instance, it can only work on one host per user.
Therefore, if an application becomes more complex it can become bulky as Prometheus does not run on multiple instances for a service or application.
Who is it recommended for?
Prometheus requires you to set up a feed of data into it. The tool will then process that data in a way that you specify and will display results in the formats that you define within a third-party data display service, such as Grafana. You need deep technical expertise and a lot of time to make a Kubernetes security monitoring package from this tool.
Pros:
- A free open-source tool
- Has a large community-driven repository of add-ons and hotfixes
- Can accommodate complicated Kubernetes environments
Cons:
- Lacks official paid support
- Not the best option for enterprises who want a “done-for-you” solution
But still, it makes up for it all with millisecond processing capabilities – even when several instances are involved – and then, of course, there is the ever-growing community to lend a helping hand. Download the latest version.
Why use Kubernetes at all?
Apart from the obvious advantage of having a platform that facilitates the symbiotic coexistence of numerous systems running in a shared environment with resources allocated accordingly, there are more reasons why Kubernetes should be part of the IT infrastructure of a business:
- Availability – Kubernetes makes it easy to roll out updates, monitor systems, and make all the systems and applications running on them available around the clock.
- Accessibility – Kubernetes allows users to use its systems and applications in the allocated and compartmentalized manner that has been set by administrators; this ensures there are no bottlenecks or system crashes due to access overload.
- Currency – any system that runs on Kubernetes will have access to the latest technology and infrastructure; and so will the users.
- Scalability – a business can grow its systems as big (or as small) as it wants to without having to invest in hardware changes (as would be the case in scaling a local system), excess man-hours, or complicated configurations.
- Disaster recovery – having systems set up and running in an isolated and protected environment means backing them up and restoring it all again takes mere minutes.
Are there any Kubernetes monitoring tools you think are good and would like us to know about? Well, leave a comment below and tell us all about them.