
Businesses depend on reliable monitoring tools to maintain the performance, availability, and security of their IT systems. In this space, LogicMonitor and Datadog are two leading platforms, both offering comprehensive visibility across networks, servers, applications, and cloud environments, but with different design approaches and strengths.
Datadog is a cloud-native monitoring and analytics platform built for modern, distributed systems. It is particularly strong in real-time observability across cloud services, microservices, and containerised applications. With features such as log management, application performance monitoring (APM), infrastructure monitoring, powerful integrations, and machine learning-driven anomaly detection, it is widely used by DevOps teams needing deep insight into complex environments.
LogicMonitor takes a more unified approach, offering an all-in-one monitoring solution that spans both cloud and on-premises infrastructure. It is designed for ease of deployment and scalability, making it well suited to organisations managing hybrid environments or undergoing digital transformation. Its core capabilities include automated discovery, custom dashboards, alerting, and detailed reporting.
Although both platforms provide robust monitoring capabilities, their focus areas differ significantly, which means the most suitable option depends heavily on an organisation’s infrastructure and operational priorities.
This guide compares LogicMonitor and Datadog by examining their features, strengths, and limitations, helping organisations determine which monitoring solution best aligns with their current needs and future growth plans.
LogicMonitor highlights
Based in Santa Barbara, California, LogicMonitor was founded by Steve Francis in 2008 and has been led by CEO Kevin McGibben since 2011. The business is still a private company and has been owned by Vista Equity Partners since April 2018. Another major investor is Providence Strategic Growth.
Since 2018, the company has accelerated its service expansion through a series of acquisitions and continued its in-house development effort.
The LogicMonitor system was designed from the beginning to support data centers. A vital service for data centers is connectivity, and a typical data center client would be operating several locations – if only for secure backups. So, from the beginning, the client base of LogicMonitor made using a cloud platform for delivering a natural choice. The SaaS deployment model enables LogicMonitor to combine the supervision of multiple sites and the connections between them.
Data centers also need to respond to user requests quickly; they deal with high-throughput data transfers and need to allow remote access, so they have security issues to deal with. LogicMonitor evolved to monitor all of these requirements.
Focusing on data centers gives LogicMonitor a more critical requirement for monitoring servers, platform services, and networks. The monitoring of desktops in an office is not so important to that customer base. However, the fact that data centers are used to host websites and Web services means that LogicMonitor needed to develop capabilities monitoring those areas.
LogicMonitor is designed for service providers. However, all of the functionality developed for the package can also be used for internal IT Operations. This is particularly the case for multi-site businesses with a centralized IT management service.
Key information:
- LogicMonitor is designed to monitor data centers
- LogicMonitor is a SaaS platform with data collectors that need to be installed on monitored systems
- LogicMonitor can unify the monitoring of multiple sites and cloud platforms
- LogicMonitor is based in Santa Barbara, California, and has offices in seven other locations around the world
- Customers of LogicMonitor include Sophos, Ted Baker, Siemens, and United Airlines
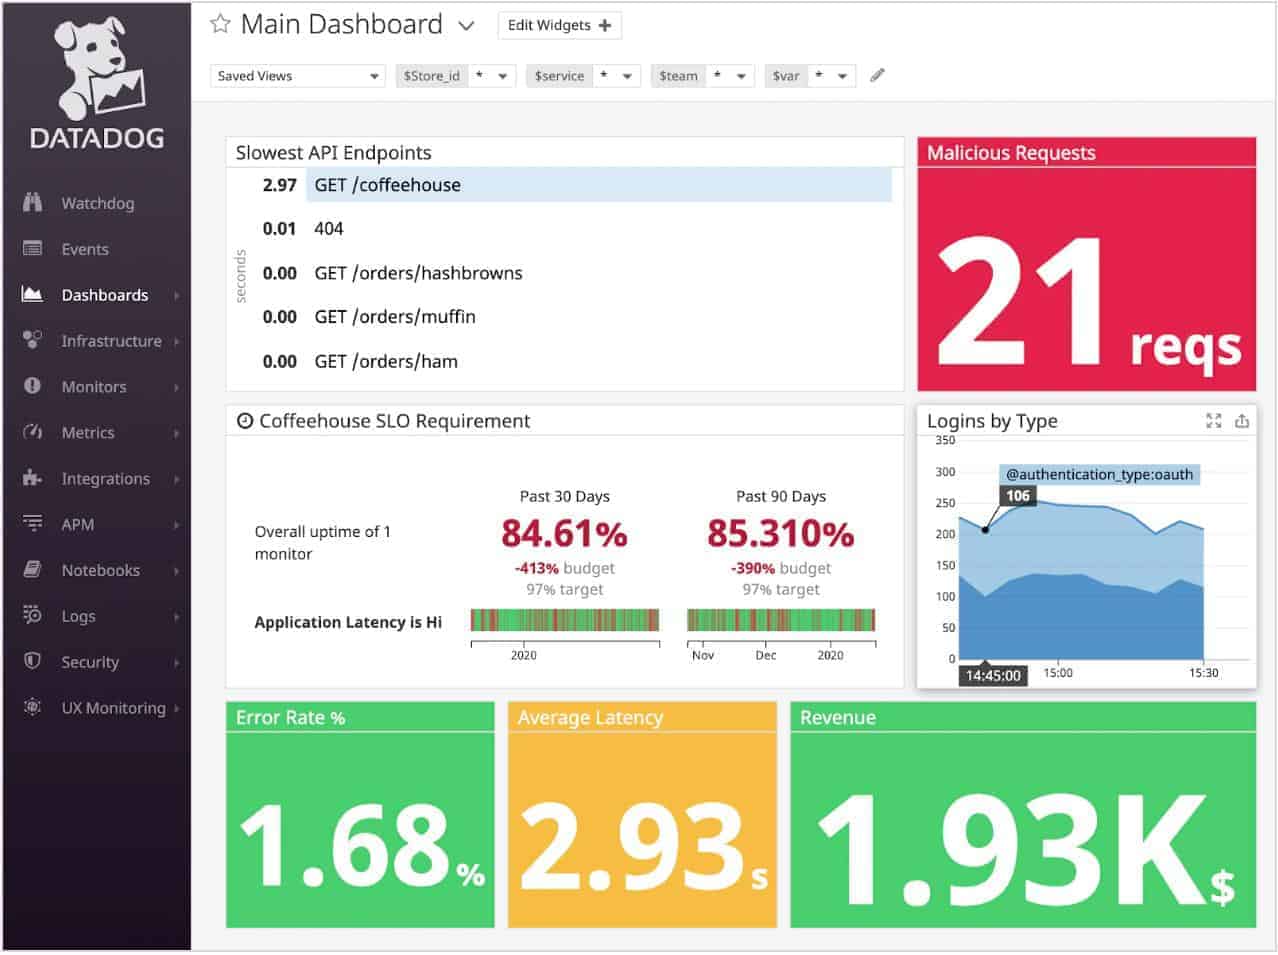
Datadog highlights
Datadog was started in 2010 by Olivier Pomel and Alexis Lê-Quôc. The founders still run the company with Pomel as CEO and Lê-Quôc as the Chief Technology Officer. The company was listed on NASDAQ in 2019.
The original code for Datadog was acquired from Server Density. This was eventually wholly rewritten in Go and moved to a hosted system as a SaaS package. The core of Datadog monitors networks, servers, and applications. It is also able to apply these practices to cloud resources and watches connections between sites.
Through constant redevelopment and acquisition of companies with capabilities in other system management tasks, Datadog has expanded its platform to include log management and security monitoring.
The Datadog team has been able to keep up with new technology, adding website monitoring and the innovation of distributed tracing for microservices. Identifying all supporting functions in the chain of microservices introduced the need for application dependency mapping. Datadog also applies AI in its monitoring systems, predicting how growth in demand by one service could crowd out resources shared with other systems.
Datadog will monitor on-site resources plus Docker AWS, Azure, and Google Cloud Platform.
More recently, Datadog has added on Cloud Security Posture Management, which is a vulnerability manager. It also has a new Incident Management module.
Key information:
- Datadog is a SaaS platform that offers installs local agents to implement monitoring
- Datadog monitors on-site and cloud services and can consolidate the tracking of multiple locations
- Datadog provides a vulnerability manager and a SIEM system
- Datadog includes AI-based processes in its system monitoring services
- The customers of Datadog include Whole Foods, Samsung, Peloton, and 21st Century Fox
LogicMonitor vs Datadog head-to-head
LogicMonitor and Datadog have many functions in common. The big difference between the two systems lies in their pricing. LogicMonitor offers one central package that covers the parts of many different packages offered by Datadog. So, when comparing the two systems, it is necessary to compare LogicMonitor with all of the subscriptions available in Datadog. In addition, LogicMonitor keeps its Synthetic Monitoring service as a separate package.
Standard features of LogicMonitor and Datadog
LogicMonitor has two plan levels with more functions available in its higher plan. Synthetic Monitoring is a different plan. Datadog has 12 other packages, and some of these have subsets of service. However, looking through all of the benefits both companies offer, you will find the following systems available from both providers.
- Site infrastructure monitoring covering networks, servers, and applications
- Monitoring of virtualizations
- Container monitoring
- Network topology monitoring
- Network traffic analysis
- Monitoring for AWS, Azure, and Google Cloud Platform
- Database monitoring
- Web application monitoring
- The ability to combine the monitoring of several sites
- AI-processes for resource shortage predictions
- Log management and analysis
- Distributed tracing
- Synthetic monitoring for Web pages
- Integrations that add on functionality to monitor specific products or technologies
Differences between LogicMonitor and Datadog
Datadog has more modules available than those offered by LogicMonitor. However, LogicMonitor does have some functions that Datadog doesn’t provide:
LogicMonitor
- Capacity planning and forecasting
- DevOps management and testing
- Configuration Manager
Datadog
- Application dependency mapping
- Web application vulnerability scanning
- Accurate user monitoring for websites
- A SIEM system for security monitoring
- Bug tracking
- Incident management
Plans
The organization of these two systems into modules makes them similar. However, their packaging is very different.
LogicMonitor
The services of LogicMonitor are divided into two sections:
- Core
- Synthetic Monitoring
The Core system contains just about all of the modules of LogicMonitor; it is available in two editions:
- Pro
- Enterprise
Pro is appropriate for systems that include up to 200 nodes, and Enterprise is for those businesses with more than 200 nodes. The modules contained in each are:
Pro
- Network monitoring
- Server monitoring
- Application monitoring
- Storage monitoring
- Database monitoring
- Cloud monitoring (AWS, Azure, GCP)
- Container monitoring (Kubernetes)
- SaaS App monitoring
- Website monitoring
- Network topology mapping
- Netflow analysis
- Data Retention of one year
Enterprise
- Network monitoring
- Server monitoring
- Application monitoring
- Storage monitoring
- Database monitoring
- Cloud monitoring (AWS, Azure, GCP)
- Container monitoring (Kubernetes)
- SaaS App monitoring
- Website monitoring
- Network topology mapping
- Netflow analysis
- Data Retention
- NBAR management
- AIOps Early Warning System
- Anomaly detection
- Dynamic Services monitoring
- Child accounts for managed service provider clients
- Sandbox for development teams
- Configuration Management
- LM Logs — log file collection and analysis
- Data Retention of two years
Datadog
Datadog has 12 modules, some of which have sub-modules, which increases the total number of plans available.
- Infrastructure – Monitors network, servers, and services, such as VMs and containers. This module covers cloud platforms as well as on-site resources. Add-ons for this module are the monitoring of AWS Fargate data and IoT device monitoring.
- Application Performance Monitoring – This service includes application dependency mapping and implements AI predictions-based for resource availability monitoring.
- Continuous Profiler – This service is only available in conjunction with the Application Performance Monitoring service, creating a higher plan for the APM. It displays code as it runs and analyzes performance.
- Database Monitoring – Monitors PostgreSQL, MySQL, Amazon RDS, Amazon Aurora, and Google Cloud SQL.
- Accurate User Monitoring – Monitors live website performance and include an Error Tracker module.
- Synthetic Monitoring – This monitor is available in two forms: API tests for automated system checks and Browser-based tests to exercise interactive elements in Web pages.
- Serverless Monitoring – This module implements distributed tracing to track the functions of APIs and microservices. The system uses AI methods to predict potential resource shortages.
- Network Performance Monitoring – A traffic analysis service for physical networks.
- Network Device Monitoring – This service gathers network device status reports through SNMP procedures.
- Log Management Ingest – Collects, consolidates files, and gives access to log messages.
- Retain or Rehydrate – A log archive management system.
- Security Monitoring – A SIEM system that detects security breaches by analyzing log files.
- Cloud Security Posture Management – A vulnerability scanner for cloud services that operate continuously.
- Cloud Workload Security – Internet security protection offering real-time protection against hackers and adding file protection monitoring.
- Incident Management – An issue management system that can be a Help Desk platform or a collaboration and task management tool for development teams.
Pros & Cons
LogicMonitor
Pros:
- Monitors application performance via the cloud
- Can monitor assets in hybrid cloud environments
- The dashboard can be customized and saved, great for different NOC teams or individual users
- Better suited for enterprises and MSPs
Cons:
- The trial is only 14 days, would like to see a longer testing period
Datadog
Pros:
- Excellent graphic options for monitoring multiple metrics
- Highly customizable dashboards, great for NOC teams
- Cloud-based monitoring, can be accessible from anywhere
- 400+ integrations can support nearly any database deployment
- Highly scalable – can work in any size environment
Cons:
- Would like to see a longer trial period
Prices
LogicMonitor doesn’t publish its prices. Instead, you have to contact the Sales Department to request a quote.
The prices for Datadog modules are:
- Infrastructure: Free – $0, Pro – $15, Enterprise – $23 per host per month
- Infrastructure add-ons: AWS Fargate data monitoring – $1 per task, IoT device monitoring – $5 per device
- Application Performance Monitoring: $31 per host per month
- Application Performance Monitoring + Continuous Profiler: $40 per month
- Database Monitoring: $70 per database per month
- Real User Monitoring: $15 per 10,000 sessions per month
- Synthetic Monitoring: API Tests – $5, Browser Tests – $12 for every 1,000 test runs per month
- Serverless Monitoring: $5 per million invocations per month
- Network Performance Monitoring: Network Performance Monitoring $5 per device per month
- Network Device Monitoring: $7 per device per month
- Security Monitoring: $0.20 per GB of throughput per month
- Cloud Security Posture Management: $7.50 per host per month
- Cloud Workload Security: $15 per host per month
- Log Management Ingest: $0.10 per GB of throughput
- Log Management Retain or Rehydrate: $1.70 per million log events per month
- Incident Management: $20 per user per month
Free trial
LogicMonitor offers a 14-day free trial of its Core editions. Datadog provides a 14-day free trial on all of its modules.
The verdict
For general system monitoring, there is little to choose between LogicMonitor and Datadog. However, if you run all of the types of systems that these monitoring platforms offer, you would find it easier to take out an account with LogicMonitor because they provide one bundle, whereas, for the same services with Datadog, you would have to run through the menu and take out subscriptions for each module.
Both of the systems can be expanded by integrations that add on specific features for monitoring third-party tools. In addition, both systems cover multiple sites and can integrate the monitoring of on-site and cloud-based resources.
One notable difference is that the LogicMonitor offers a multi-tenanted configuration for managed service providers, which enables MSPs to keep the data for each client separately and even allows client technicians access to their area LogicMonitor account. However, the tailoring of the system for MSP usage is an area that Datadog needs to work on.
Datadog offers security monitoring, which LogicMonitor doesn’t have. New modules, such as the Incident Management service, show that Datadog is expanding rapidly. However, those who need system management tools for a straightforward network will get configuration management from LogicMonitor, which Datadog doesn’t have.
