
Overview of ManageEngine APM
ManageEngine Applications Manager (APM) is an enterprise-ready integrated application and server performance monitoring solution that helps organizations ensure optimal performance of their business-critical applications across physical, virtual, and cloud environments. It provides deep visibility into applications and infrastructure components’ performance, including the ability to detect, diagnose, and resolve network performance issues. It has been recognized as a 2020 Gartner Peer Insights Customers’ Choice for Application Performance Monitoring and IT Infrastructure Monitoring simultaneously.
ManageEngine APM is an agentless tool that runs on Windows or Linux operating systems, and it uses auto-discovery mechanisms to discover and draw up application topology.
Key Features:
- Web Application Oversight: Enables the monitoring, optimization, and troubleshooting of web application performance through detailed byte-code instrumentation.
- Synthetic Transaction Surveillance: Monitors user experience across various global locations to ensure consistent application performance.
- Comprehensive Cloud Visibility: Offers in-depth monitoring capabilities for private, public, and hybrid cloud resources.
REST API Tracking: Ensures the availability and prompt response of REST API endpoints. - Server Health Monitoring: Allows for the monitoring and resolution of server performance issues in physical, virtual, and cloud environments.
- ERP System Management: Enhances performance and availability for key ERP applications such as SAP, Oracle EBS, and Microsoft Dynamics.
- In-depth Analytics: Facilitates trend analysis, capacity planning, and growth forecasting with advanced analytical tools.
Pros:
- Flexible Deployment Options: Supports both on-premises and cloud installations, providing flexibility for various business needs.
- Interdependency Insights: Identifies the connections between applications, illustrating how performance issues can affect operational continuity.
- Extensive Log Monitoring: Offers detailed tracking of vital metrics including memory usage, disk I/O, and cache status for comprehensive database insights.
- Automated Discovery: Capable of automatically identifying databases, server hardware, and connected devices for streamlined asset management.
Cons:
- Learning Curve: Mastering all the functionalities and options of the platform may require an extended period of exploration.
ManageEngine APM is available in three editions: Free, Professional, and Enterprise edition. The Free edition provides most of the functionality of the Professional edition with a few restrictions and supports up to 5 monitors. The Professional edition includes monitoring, alerting, and reporting features and targets SMBs looking to monitor up to 500 applications based on load. Finally, the Enterprise edition includes all the Professional edition + distributed monitoring and failover capabilities and targets large enterprises looking to monitor 500 or more applications. A 30-day free trial is available for download. During installation, you can choose either the Professional or Enterprise edition.
Once the trial period expires, it will automatically convert to the free version without a valid license.
Overview of Datadog
Datadog is an agent-based on-premises and cloud infrastructure monitoring service for cloud applications, servers, databases, tools, and services. It was named a Leader in the 2021 Gartner Magic Quadrant for Application Performance Monitoring. It provides developers and IT operations teams real-time visibility into all technology infrastructure through a single visual interface. Datadog uses its auto-discovery service to explore and identify devices in your network. The outcome of the auto-discovery service is then used to create a device inventory, which forms an index for the complete monitoring service.
Once all devices and links have been identified, you can overview all network activity from the Datadog dashboard. The service also draws up a network topology map that can be used to get quick insights into each node. Any changes to the network can be automatically spotted. This helps to adjust the network inventory and topology map without any human intervention. Traffic flow analysis features in the Datadog tool enable you to examine each device and link to discover total capacity and utilization. The analysis features let you see which applications or endpoints generate the most traffic on your network.
Key Features:
- Network Monitoring: Provides visualization and analysis of traffic flow in modern cloud environments.
- Application Performance Management: Enables the monitoring and optimization of application performance.
- Log Management: Facilitates the quick search, filtering, and analysis of logs for troubleshooting purposes.
- Synthetic Monitoring: Allows for proactive testing of the end-to-end user experience through an easy-to-use web recorder.
- Custom Alerts: Empowers organizations to set up tailored alerts for metrics or performance issues, with notifications through various channels.
- Seamless Integrations: Integrates with a wide array of products and development stacks for comprehensive metric and event aggregation.
- Interactive Dashboards: Features high-resolution, dynamic dashboards for monitoring real-time metrics and events.
- Collaborative Tools: Enhances cross-team visibility with features for annotating, recording, and discussing production data in context.
- API Access: Offers API capabilities for detailed observation of applications and infrastructure by capturing events and metrics.
Pros:
- Versatile Deployment Options: Allows for both on-premise and cloud-based setup, catering to diverse company needs.
- Application Interdependency Mapping: Identifies and maps out the relationships between applications, highlighting how performance issues may affect operations.
- Comprehensive Log Monitoring: Tracks critical metrics such as memory usage, disk I/O, and cache status for a well-rounded view of database health.
- Automatic Discovery: Efficiently identifies databases, server hardware, and devices for up-to-the-minute asset management.
Cons:
- Complex Feature Exploration: Navigating and leveraging all available features and options may require a significant time investment.
A free 14-day trial with full access to all the features is available for download. After that, the software is generally sold through monthly subscription plans based on hosts, events, or logs.
ManageEngine APM Vs. Datadog: How They Compare
Systems Requirements and Installation
System requirements depend on the number of monitors. A minimum of 2 CPU core, 4GB RAM, and 100 GB of storage space is required for the professional edition. A minimum of 4 CPU core, 8GB RAM, and 200GB of storage space is needed for the Enterprise edition. Because ManageEngine APM is agentless, the installation process is pretty much quick and easy. Little in-depth tech skills are required to deploy it, and most network admins will have no problem installing and configuring the software. However, ManageEngine APM is an on-premise application, which means installation is local. Organizations looking for cloud service convenience would have to consider Datadog–a cloud-focused product.
Since Datadog is a SaaS-based application, there are no on-premise system requirements and no installation hassles. However, you’ll be required to install local agents specific to the device or service you wish to monitor for the most part. An agent-based mode means no auto-discovery feature, so you have to deploy an agent for all your devices individually. Datadog supports integration with VMware vSphere, but the setup process is a bit complicated. That said, Datagod provides enough documentation and setup instructions to guide you through the installation and configuration process.
Dashboards and Visualizations
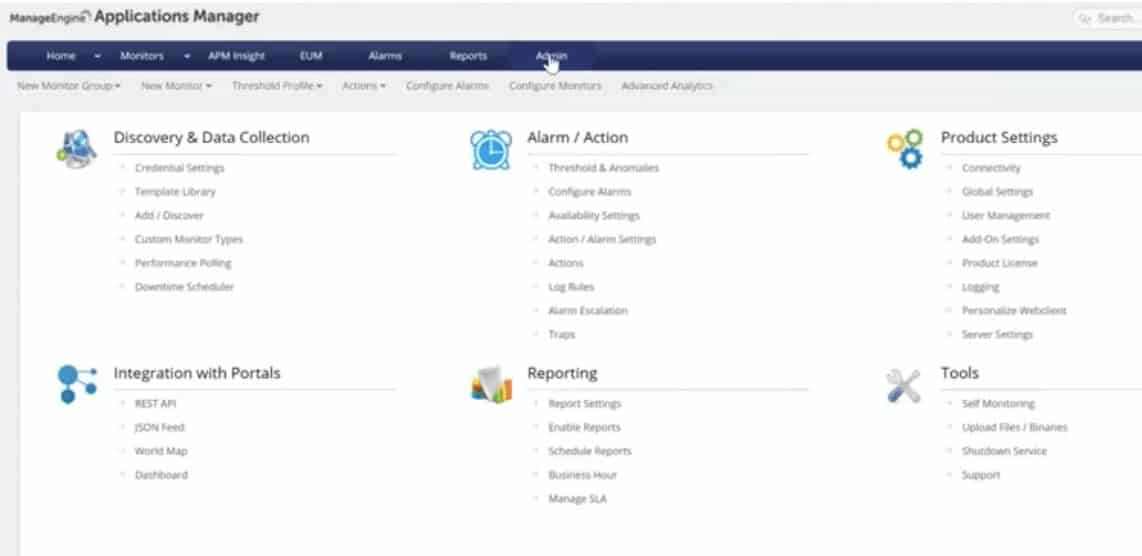
ManageEngine APM lets you visualize your entire IT infrastructure in one customizable, feature-rich dashboard with plenty of graphical data visualizations. It comes with four Dashboards: Default Dashboard, Business View, Availability, and QoS Worldwide. It has a modern, though somewhat busy-looking, browser-based interface. So finding your way around might be a bit tricky at the start since there are plenty of options to consider. Nonetheless, ManageEngine APM would still be considered aesthetically pleasing from a visual perspective. The ability to custom design maps with drag-and-drop tools is also very intuitive.
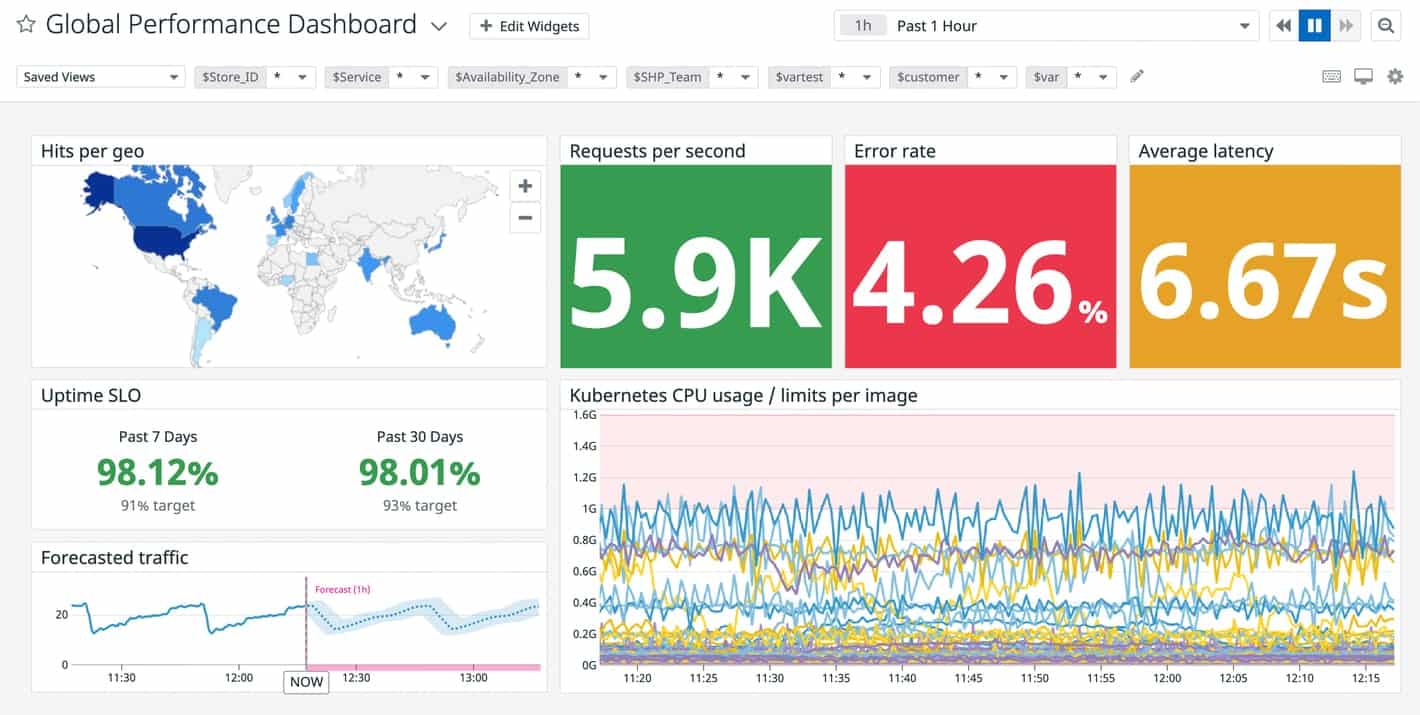
Datadog is also aesthetically pleasing from a visual perspective with its clean and modern dashboard design. In addition, Datadog allows you to customize your dashboards with a vast library of visualization tools and drag-and-drop widgets. But it requires a lot of setup work to get things working as well. Once set up, there are two primary ways of visualizing your data:
- Screenboards Grid-based dashboards with free-form layouts that include images, tables, host maps, graphs, and logs. They are commonly used as status boards or storytelling views that update in real-time or represent fixed points in the past.
- Timeboards This represents a single point in time—fixed or real-time—across the entire dashboard. They are commonly used for troubleshooting, correlation, and general data exploration. In addition, you also get a time series that can plot any metric being captured from your hosts, such as CPU usage, uptime, or memory usage.
Alerts and Notifications
There are several alert types, known as alarms, in ManageEngine APM, and each has a unique purpose. Alarms are generated based on the availability, health, are, or attribute of the monitor. Alarms inform network admins about faults in the application and trigger actions such as email notification, SMS notification, or execution of custom scripts based on your configuration. ManageEngine APM leverages AIOps technology (machine learning + big data) to generate intelligent alarms, which means that you can avoid alert storms and get to the root cause of issues quickly.
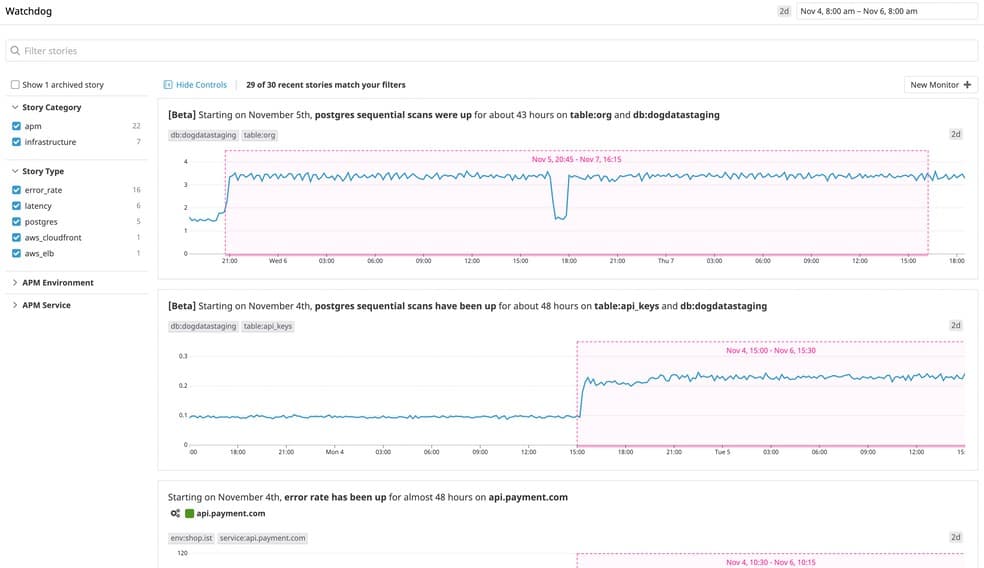
Similarly, Datadog’s approach to alerts and notifications is based on machine learning (ML), which it calls Watchdog. Watchdog uses ML techniques to identify problems in your infrastructure, applications efficiently and services, and flag anomalies. Alerts in Datadog are called Monitors. Users can receive alerts using Pagerduty, Slack, and email. These can be based on nearly any metric that Datadog can capture. As a result, every alert is specific, actionable, and contextual—even in large and temporary environments. This unique approach to alerts and notifications makes Datadog stand out and helps to minimize downtime and prevents alert fatigue.
Reporting and APIs
ManageEngine APM reporting module allows you to generate and export out-of-the-box reports. The reports generated depict the availability, health, response time, and application alarms over a specified period. The reports are generated dynamically, which means that you only see reports for monitors that you have created in the APM. Reports can be scheduled to run at specific times or run ad-hoc with the custom date and time parameters. ManageEngine APM also provides REST APIs to help integrate it with other monitoring solutions and internal portals. Network managers will find the ManageEngine APM reporting feature empowering.
Instead of generating the usual out-of-the-box reports that most network admins expect, the Datadog approach to reporting aims to make metrics easily searchable, and it does excellently. Although some network managers prefer the excellent old nicely generated fixed PDF report, not everybody needs it. Therefore, Datadog also comes equipped with an easy-to-use API that can significantly extend the range of what Datadog can track. The Datadog API is an HTTP REST API that can access the Datadog platform programmatically and returns JSON from all requests.
Licensing and Price Plans
Pricing plans are based on the number of monitors and the number of users who will access various reports and dashboards in the APM. Monitors are required for each specific application, server, or service being monitored. In addition, you have the option to buy perpetual or annual license subscriptions. The yearly subscription also includes maintenance and support fees. The ManageEngine APM licensing and pricing model makes it ideal for organizations that want value for a fair price.
Datadog pricing model is based on per server, per month, and it’s free for up to 5 hosts (with 1-day data retention). But some customers complain that it becomes costly at scale. As a result, Datadog is available in several different pricing tiers:
- The Network Performance tier Suitable for monitoring networks and systems for most small to midsize businesses.
- The Infrastructure tier Ideal for organizations that want to use the software as a centralized monitoring service for systems and services.
- The APM tier Designed for larger organizations looking to fix service and device-layer problems.
- Serverless tier Aimed at those looking to monitor network and application issues.
- Log Management tier Meant for companies with large amounts of log data to parse for context and retention.
- There are also other security, synthetic, and accurate user monitoring, each appropriate pricing for the core task.
All Datadog prices are billed annually, making it one of the most price-customizable management apps.
| Features | ManageEngine APM | Datadog |
|---|---|---|
| Target market | Ideal solution for SMBs and large-scale enterprises. | Developers, freelancers, IT operations teams, security engineers, and business users from SMB to large organizations in the cloud age. |
| Supported platform | Windows and Linux OS | Mac OS X, Windows, Linux, Online |
| Deployment model | On-premise | SaaS-based |
| APIs calls | REST API | HTTP REST API |
| Support methods | Email/Help Desk FAQs/Forum Knowledge Base Phone Support | Phone Online Knowledge base Video tutorials |
| Licensing and pricing model | Free Trial Freemium One-time license Subscription | Free trial available No credit card required Free account Subscription-based |
Table 1.0 | Comparison of ManageEngine APM and Datadog key features
Conclusion
ManageEngine APM is a feature-rich solution that can meet the needs of any organization, from SMB to large enterprises. Its price and the flexibility to deploy are the most valuable. The application can scale from essential to complex setups, and it can be integrated with many other tools, which is a powerful feature. However, some users have complained that the product upgrade process can sometimes be cumbersome and cause issues that break the system. But the swift response from the product support team usually fixes the problems. Other than that, it’s difficult to find faults with this package. Overall, the ManageEngine APM is a great tool to help any business manage its applications and business services better.
Datadog’s SaaS-based model makes it ideal for organizations that don’t want to burden themselves with any resource-intensive on-premise monitoring solution. Service-oriented companies, SMBs, or smaller networks that don’t have dedicated IT personnel to keep tabs on the infrastructure at a granular level will find this feature-rich tool suitable. More extensive networks with multiple remote locations may find Datadog’s agent-based model inconvenient since agents will need to be individually installed. But if you can successfully get past the agent installation and configuration process, Datadog is an excellent network monitoring and infrastructure management tool.
