
For a free, open-source, community-supported system, MariaDB has some very strong development talent backing it. MariaDB is a fork of MySQL and it was created in 2009 as a response to Oracle Corporation taking over Sun Microsystems and therefore, acquiring the free-to-use MySQL. The original creator of MySQL was worried that Oracle would make MySQL commercial-only and so copied the entire system and gave it the name MariaDB.
Oracle Corporation wasn’t as greedy as its opponents feared it would be. Therefore, MySQL is still very widely used, especially for website databases. This continued free availability of MySQL has possibly reduced the growth of MariaDB. MySQL outranks MariaDB in a number of implementations to a great degree.
Here is our list of the best MariaDB monitoring tools:
- ManageEngine Applications Manager EDITOR’S CHOICE This package monitors a long list of DBMSs, including MariaDB and MySQL, and covers servers and cloud platforms as well. Runs on Windows Server, Linux, AWS, and Azure. Start a 30-day free trial.
- Site24x7 Server Monitoring (FREE TRIAL) This cloud-based package of monitoring services allows you to observe the full stack and put its MariaDB performance tracking into a system-wide context. Start a 30-day free trial.
- AppOptics This is a cloud-based infrastructure and applications monitor that includes monitoring procedures to track the performance of relational databases, including MariaDB.
- Sematext MariaDB Monitoring This service is part of an Infrastructure Monitoring package that will also monitor networks, servers, and applications. Offered as a SaaS package or a virtual appliance.
- Datadog A cloud platform that offers a range of monitoring tools and the Infrastructure module covers services and the servers they run on. This service will identify all of your services and, with an integration, keep a close eye on MariaDB
- Opsview A system monitor with a plugin for specialized MariaDB monitoring capabilities. It is available for installation on Linux or as a cloud-based service.
- LogicMonitor A flexible cloud-based monitoring tool that includes AI processes and has MariaDB monitoring capabilities.
The similarity between MySQL and MariaDB makes it very easy to port applications from one system to the other. Another name to look out for is SkySQL, which is a hosted version of MariaDB. Amazon RDS offers MariaDB support. So, when you are looking for a MariaDB monitoring tool, the probability is that the system will also monitor these related systems.
Database monitoring considerations
The current structure of the IT industry is very diverse. The creation of cloud services means businesses take on subscriptions to bundles of applications and services, choosing a specific headline system, not paying attention to the backend systems that support it. As a result, it is very likely that a typical business has many different services hosting in geographically dispersed locations to monitor and they could very well all have different DBMSs supporting them.
It isn’t unexpected that you have a mix of DBMSs even if you made a corporate decision to use MariaDB for your in-house development. Although this guide is focused on monitoring tools for MariaDB, getting a system that is able to monitor other DBMSs as well is a big help.
The best MariaDB monitoring tools
When looking for MariaDB monitoring tools, we focused on systems that had a wide range of capabilities, not those that only monitor MariaDB. This will save you a lot of money because you won’t need to buy other monitoring systems whenever you discover that some online service you subscribe to actually has a different DBMS behind it.
Luck favors the prepared, so having the capability to monitor many different DBMSs means that your business is ready for anything. You don’t want to wade through very long menus of service that you don’t need and you don’t want to have to install a very large software package that has all of the code to monitor databases that you might not use in the future.
The ideal database monitoring system is one that allows you to add on the capability of monitoring a specific DBMS, so you end up with just those screens you need to monitor the systems that you know you have. Of course, the database monitors that made it onto our list all have MariaDB monitoring capabilities.
Our methodology for selecting a MariaDB monitoring tool
We reviewed the market for MariaDB monitoring systems and analyzed tools based on the following criteria:
- Instance query activity
- SQL performance tuning
- Recommendations to optimize database objects
- Live tracking of supporting server resource availability
- Historical analysis tools
- A free trial or a demo system that enables the monitor to be tested before buying
- Value for money from a monitoring tool that efficiently tracks and tunes MariaDB performance for a fair price
With these selection criteria in mind, we identified database monitoring tools that can save money by monitoring a range of DBMSs, including MariaDB.
1. ManageEngine Applications Manager (FREE TRIAL)

ManageEngine Applications Manager provides monitoring services for custom code and off-the-shelf applications with an extensive list of database systems that it can track. Maria DB is on that list, as are MySQL, SQL Server, PostgreSQL, and Oracle. The tool is able to extract activity metrics from within running databases to enable the measurement of responses as well as capacity issues.
Key Features:
- Application Observability: Focuses on good user experience by monitoring important business transactions, infrastructure, network availability, and other health elements.
- DevOps Monitoring: It is helpful in the smooth development cycle of any app by continuously analyzing developer activities to make sure the app performs well in real time and adds value to the business.
- PHP Performance Monitoring: It involves tracking important factors of PHP apps like response time, throughput, and critical data to optimize the PHP server so that it performs better.
- Dotnet Core Monitoring: It will give you full visibility for all levels of applications, such as which process is running in the background, resource consumption, and other critical metrics to catch the faults and errors quickly.
Why do we recommend it?
ManageEngine Applications Manager provides monitoring for all of the systems that lie between user-facing software and the resources of servers that underpin everything. This service is able to monitor databases, including MySQL and MariaDB and it can watch them whether they are hosted on your servers, on cloud platforms, or in a mix of locations.
The Applications Manager includes a discovery service that scours your servers and cloud accounts and lists all of the software that it encounters. It then follows process threads to identify all of the supporting modules and microservices that the application triggers. The system then looks at interconnections between applications such as a frontend interaction with a database. This creates an application dependency map that enables Application Manager to lay down plans for root cause analysis in case problems arise.
The system focuses on response time and calls for services. This serves as a chain of reliance that can pinpoint the exact cause of a user-facing app running badly. For example, if the synthetic monitoring tool in the package records a slow response in a Web page, it can see straightaway if a call to a MariaDB instance is the cause. Then the issue is going to be whether the connection, the DBMS, or the specific query was slow. Identifying this issue solves the problem automatically.
Carrying into solutions for slow-running queries in MariaDB, the monitor shows the objects – tables and indexes – involved in delivering a result. It also shows you whether locks were to blame for slow responses or whether file I/O was involved.
Looking beneath the MariaDB instance, Applications Manager links the running events inside the database with access to server resources. If the CPU is overloaded or memory is sparse, the monitor has found the cause of the response time problem.
Alongside the automated scrutiny of database activity, the Applications Manager offers distribute tracing and code profiling that simultaneously identifies each line of code as it is being executed. Maybe the system problem wasn’t caused by the database at all, but you will immediately know what other issue was in play at the time that an issue arose.
The Applications Manager includes a series of thresholds for performance and you can also formulate your own. When one of these thresholds gets crossed, Applications Manager generates an alert and you can get those notifications sent to your phone, email account, or Service Desk ticketing system.
Who is it recommended for?
The Applications Manager is free to use in order to monitor up to five assets. The full, paid version is accessible even to small businesses and it gives you lots of features, chief among which, are asset discovery and application dependency mapping. This provides root cause analysis if anything goes wrong.
Pros:
- Makes Admin Tasks Easier: It gives database admins a clear picture of the detailed SQL database’s performance and its operational availability for having maximum uptime.
- Helps Understand Database Environments Better: Users can gain a proper understanding of the database by accessing details like KPIs, request statics, hit rate, database statics, and more.
- Solves Slow Queries: Slow database queries are frustrating. Users can track the execution of specific queries and critical factors like unnecessary memory usage and processor time.
- Uses Machine Learning: With the help of machine learning language, users can analyze historical performance data from the past to work on upgrading future needs.
Cons:
- Users Faced Minor Glitches: Many users previously reported about the lack of improvements in creating map and dashboard setup
ManageEngine Applications Manager is available as a free edition but that version is limited to tracking five applications. Two paid editions offer monitoring for a single network or a multi-site conglomerate. The software package installs on Windows Server or Linux or and it is also available as a service on AWS and Azure. You can get a 30-day free trial of either of the paid editions. If you decide not to buy, the package switches to the free edition at the end of the trial period.
EDITOR'S CHOICE
ManageEngine Applications Manager is our number one recommendation for a MariaDB monitoring tool, as it provides a broad feature set focused on maintaining strong performance, scalability, and reliability. It delivers real-time visibility into MariaDB activity, with performance analytics and resource tracking that help teams stay on top of system behaviour. Customisable dashboards present key metrics such as query response times, throughput, and server status, making it easier to spot and resolve issues before they affect users. The ability to monitor multiple MariaDB instances from one central location is especially valuable for organisations with large or distributed environments. It also includes automated alerts, notifying administrators of performance drops, crashes, or potential security concerns, helping reduce downtime and improve response times. Historical reporting supports trend analysis and capacity planning, enabling more informed, data-driven decisions. The interface is straightforward to use, making it accessible for both technical and non-technical users, while advanced capabilities like SQL query monitoring and transaction tracing help maintain consistent database health and performance.
Download: Get a 30-day free trial
Official Site: https://www.manageengine.com/products/applications_manager/download.html
OS: Windows Server, Linux, AWS, and Azure
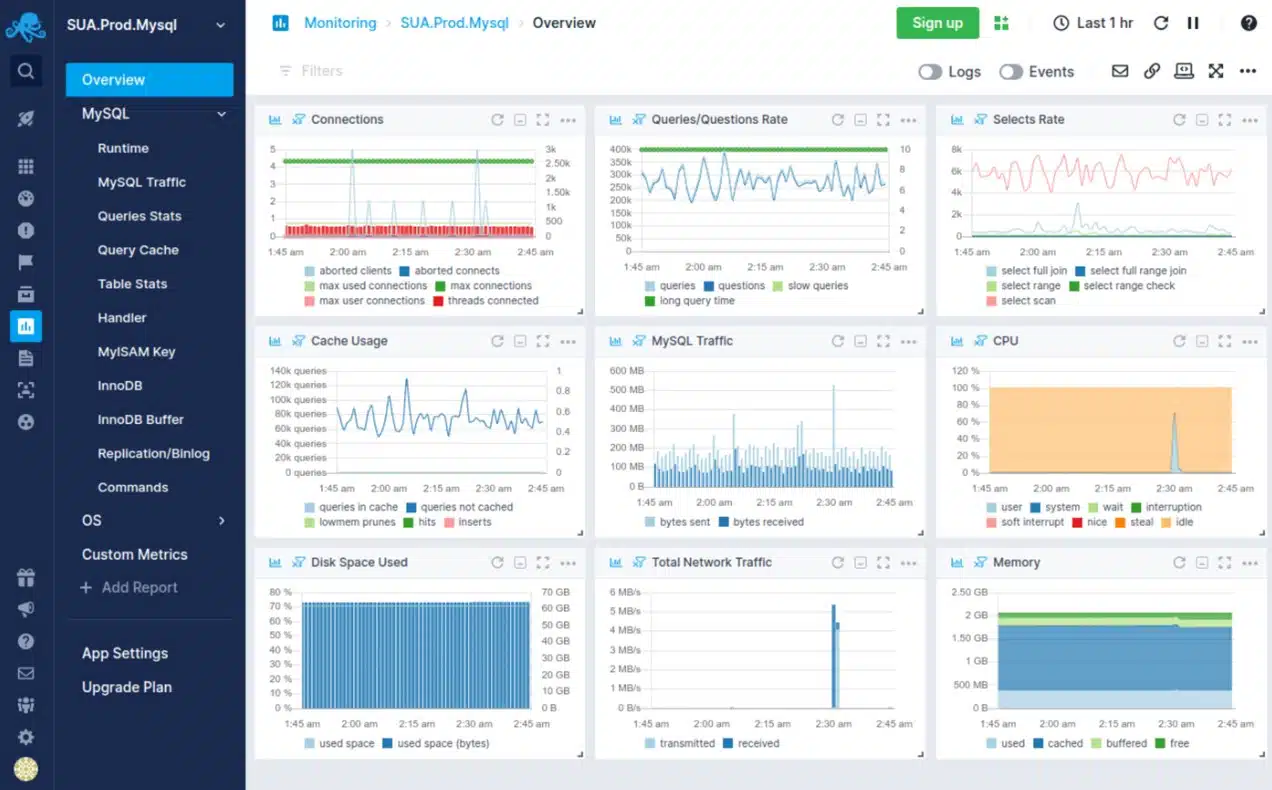
2. Site24x7 Server Monitoring (FREE TRIAL)

Site24x7 is a cloud-based monitoring service. This is another monitoring system that doubles up its MySQL sensors to monitor MariaDB as well. The MySQL/MariaDB service needs to be added to the base package of the monitoring system. This extends the dashboard of the service, adding extra screens for database monitoring.
Key Features:
- 100+ Plugin Integrations: Monitor various aspects of your servers by using ready-to-install plugins like MySQL, Apache, and Nagios. Users can also create custom plugins to monitor specific data points.
- 80 Key Metrics: Track important server metrics, including disk usage forecasts, to optimize storage and network traffic analysis to prevent outages and bandwidth utilization.
- Behavior and Process Monitoring: Easily monitors the behavior of server services and processes to know the trends and critical issues affecting the business.
- MSP Monitoring: Users can customize the platform with their logo and URL to easily manage multiple customer accounts.
- Network Monitoring: The user can analyze various infrastructure components, such as Docker hosts and Kubernetes clusters, from a centralized console.
Why do we recommend it?
Site24x7 Server Monitoring is part of a cloud platform of system monitoring tools the base package can be extended by activating integrations, which are listed in a library on the platform. There is an integration for MySQL, which also monitors MariaDB. This operates in concert with all other monitoring services on the platform.
The MariaDB monitor looks inside each database instance and assesses its structure. It makes notes on the types and numbers of objects and records this information on a details screen in the dashboard. It will then continuously monitor actions such as memory and cache activity, disk interactions, and network interface activity. It counts all queries as they occur and identifies the user account and source for each request.
The monitor also checks on DBMS administrative activities, such as replication. It will give a rundown of top query targets and sources for each instance and also aggregate all of the statistics that it gathers for an overview of the performance of all instances.
Site24x7 sets performance thresholds that trigger alerts when crossed. Those alerts can be sent out to technicians by email or SMS. This notification allows data center staff to assume that the MariaDB database instances are all running smoothly because they will be drawn back to the console by a notification if problems are building.
Who is it recommended for?
The Site24x7 utilities are all bundled into plans that give you full-stack observability. The capacity of the core package is sized to be suitable for small businesses and then larger companies pay for more capacity. There is also an edition for managed service providers.
Pros:
- Comprehensive Monitoring: This service can monitor a wide range of services, covering nearly all aspects of your infrastructure or applications.
- Global Monitoring Reach: It supports global monitoring to provide complete coverage and accurate insights regardless of geographical location.
- User-Friendly Interface: Users of all levels can access and use this tool because of its intuitive and easy-to-understand graphical user interface (GUI).
- Lightweight Agent: Consists of a lightweight agent; consuming minimal resources on monitored systems.
Cons:
- Complex Configuration: With numerous settings available, configuring certain features like notification groups or teams were complex for users.
Site24x7 is a subscription package that provides an allowance for a range of services, which include network, server, and application monitors. You are only allowed one add-in per server. However, if you need more, you can raise that limit for a fee. The standard subscription account is able to monitor up to 10 servers. You can try Site24x7 Infrastructure on a 30-day free trial.
3. AppOptics

AppOptics by SolarWinds is a cloud-based application performance monitor. This monitoring service can watch the performance of on-premises and SaaS systems and it can unify the monitoring of all systems no matter where they are hosted. This service has database monitoring capabilities, which include performance tracking for MariaDB.
Key Features:
- Root Cause Identification: It traces the entire infrastructure to pinpoint the root cause so your team can immediately respond to incidents occurring and make sure all apps and softwares are working fine.
- Performance Monitoring: It gives your simplified summary of the root cause and monitors the performance deeply of applications, transactions, and services with just a one-click connection.
- Full-Stack Visibility: Due to its combined dashboard, users can easily have a comprehensive view across all hosts, servers, containers, and serverless environments.
- 15+ Plugins and Integrations: It makes monitoring much easier with the use of custom metrics and plugins and other integrations.
Why do we recommend it?
AppOptics is a cloud SaaS package with two plans and you can get MariaDB monitoring in the cheaper Infrastructure plan. All of the features of that plan are bundled into the higher APM edition as well. The top plan uses AI to create a service map and predict resource demand.
The base package of AppOptics covers standard services and applications and is also able to check on server resources. You need to add on the capability to monitor MariaDB. However, the procedure to activate the MariaDB plugin is very straightforward and the extra modules are free. The module for MariaDB monitoring is actually a MySQL add-on. However, it works just as well with MariaDB instances.
The MariaDB service monitors about 60 factors. These are measured from within the database and cover a range of factors including actual query activity and administration actions. The monitor also checks on the resources of the host for your database and looks out for resource shortages.
Who is it recommended for?
The Infrastructure Plan is surprisingly affordable for even for small businesses. Both editions are priced per host, so the system is scaleable, catering to all sizes of businesses. The cloud location means that the service has no problems combining hosts and planforms in different locations into the same plan.
Pros:
- Gives Complete Health Visibility: Users can keep a continuous eye with comprehensive monitoring across AWS, Azure, and hybrid environments to ensure good health of the server.
- Performance Metrics: Users can freely create custom performance metrics to have automated monitoring for their important business apps and various other services.
- Fast Problem Identification: The tool will give you early warning alerts before the issue occurs so you can quickly identify issues and work on the timely response.
- Scalable: AppOptics is a highly scalable tool; users can use a cloud-scale APM tool, which is perfect for use in a dynamic environment.
Cons:
- Troubleshooting Techniques are Lacking: Users find that this tool does not have enough troubleshooting techniques related to AI and also lacks API compatibility.
AppOptics is a subscription service and it is offered in two editions. The lower of these is called Infrastructure Monitoring and this includes the MariaDB capabilities. So, it is all you need to monitor your databases. The higher plan is called Infrastructure and Application Monitoring. SolarWinds offers AppOptics on a 30-day free trial.
4. Sematext MariaDB Monitoring
Sematext Infrastructure Monitoring is a package of monitoring services that will watch over networks, servers, and applications. This system is very strong at monitoring databases and MariaDB is one of the DBMSs that it will track. The service is also able to monitor SQL Server, PostgreSQL, and other DBMSs.
Key Features:
- Cloud Log Management & Analysis: Troubleshooting becomes easier by helping you monitor and analyze logs in real-time from a single dashboard.
- Metrics and Logs: Learn how much is being used by servers or cloud instances over time to better understand uses both now and in the past.
- IT Asset Inventory Management: Maintain an inventory of the server’s hardware and software at all times. You may quickly view installed packages and perform host or container-wide searches.
- Supports Single Page Applications (SPAs): Keep an eye on how well SPAs run and use resources, supporting popular frameworks like Angular and React.
Why do we recommend it?
Sematext MariaDB Monitoring is part of an Infrastructure Monitoring package that will monitor server resources and system services, such as Web servers, email systems, and databases. This tool can track the performance of MariaDB databases and it doesn’t matter whether they are hosted on your servers or on cloud platforms.
The MariaDB Monitoring service records important metrics from your MariaDB instances and it can watch over databases on multiple sites and cloud platforms, consolidating the reporting for all of them and offering drill-down paths through to data on the performance of each individual instance.
The package provides full-stack observability, so if your applications that access the MariaDB instances experience problems, the monitoring service can identify which of the two systems is the cause of the issue. The monitor goes beneath the database to watch over the supporting server and it also measures network activity and performance.
If a performance problem arises anywhere on your system, the Sematext service will raise an alert. This notification will be sent to you by email, Slack message, or Webhooks and it will identify which component of the stack is the real cause of the problem. So, you will know immediately whether your MariaDB instances are in trouble or just badly served by supporting infrastructure.
Who is it recommended for?
This package has a free tier that monitors five hosts. Even if you pay for higher plans, you still get those first five hosts monitored for free. Sematext is built around Elastic Stack and that system’s maker also produces its own Observability package. Sematext is a SaaS plan or you can run it as a virtual appliance over Docker.
Pros:
- Find Slow-Loading Pages: Allows users to examine different resources, including photos, fonts, stylesheets, and JavaScript files, to discover pages that load slowly.
- Supports Micro Frontend-Based Applications: Users can easily monitor HTTP requests and page loads for applications that use Micro Frontend architecture.
- Real-Time Automatic Alerts: Instant notifications will be sent to you whenever there is a page performance issue that impacts the user experience. It also enables the creation of page load time alerts.
- Insight into Web Vitals: Track key performance indicators for your website, such as Largest Contentful Paint (LCP), First Input Delay (FID), Cumulative Layout Shift (CLS), First Contentful Paint (FCP), and more.
Cons:
- Long Data Retention Costs: Storing and preserving data for a long time can be expensive as the tool charges for storing large volumes of data over time.
You can choose to use the Sematext system as a SaaS package or run the package on your own server as a virtual appliance over Docker. The starter plan is called Basic and it is free to use. This edition is limited to monitoring five hosts and has a data retention period of 30 minutes. Longer retention periods or the ability to monitor more servers costs money and the price increases as you lengthen your required data retention period. You can get a 14-day free trial of an unlimited plan.
5. Datadog Infrastructure
Since the Datadog platform is based in the cloud it is able to monitor systems anywhere. So, whether you are looking to monitor your local site, remote sites, or cloud resources, this tool should be of interest. It can even combine the monitoring of resources located in different locations – including the cloud – to create a system-wide overview.
Key Features:
- MariaDB Troubleshooting: You can see your database and application connections in real time with service maps.
- Seamless Navigation: Users can also easily create customized dashboards and move between application traces, logs, metrics, and security signals on the same platform.
- Get Recommended Alerts: In order to avoid problems later on, you can also set up alerts that will detect any unexpected activity and account for routine changes.
- Enhanced Collaboration: Protect sensitive data with automatically applied data masking for Personally Identifiable Information (PII) and share necessary details to collaborate among the team.
Why do we recommend it?
Datadog Infrastructure is a strong rival to the Site24x7 system. This SaaS system monitors server resources, services, and background applications, including databases, such as MariaDB. You can link this unit with the Network Device Monitoring, Network Traffic Monitoring, and APM modules to get full-stack observability.
The Datadog Infrastructure module can be expanded by a library of 400 free plugins, called “integrations.” There is an integration available that adds on MariaDB monitoring capabilities. As well as the integration for monitoring your on-premises MariaDB instances, the integrations library offers a special plugin to monitor Azure DB for MariaDB and another for AWS RDS.
The core of the Datadog Infrastructure package monitors those applications and services that support user-facing software and it also keeps track of the availability of server resources. The abilities of this monitoring system extend to virtual systems and cloud resources. This service includes databases, such as MariaDB. The monitor can also track the performance of many other database management systems and provide you with a single console to supervise all of them.
The MariaDB monitor collects statistics on more than 80 database statuses. These include query performance data taken from within operating instances. The monitor assesses issues such as cache performance and disk interactions when it examines how the database interfaces to server resources. It can also track the availability of capacity to account for typical requirements of the running database.
The Datadog Infrastructure system is able to use machine learning to apply thresholds that predict typical performance levels and identify when a potential resource shortage could impair performance.
By tracking all of the applications that access the database, Datadog creates a dependency map – this feature is called Correlations and it is based on AI processes. The Correlations service is a preparatory system that sets up paths of investigations when applications start to perform badly. This speeds up root cause analysis and buys you time to take evasive action.
The alerts that Datadog Infrastructure generates can all be sent out to technicians as notifications by email or messaging system. So, everyone can leave the monitoring of MariaDB and other services to the automated processes of the Datadog system.
Datadog Infrastructure is also great for MariaDB monitoring because it covers the performance of queries within the database as well as factors related to resources needed by the database management system. This tool is able to monitor MariaDB instances running on cloud platforms as well as those instances that you have running on your own servers. It can even consolidate the reporting on a mix of on-site and SaaS databases.
Who is it recommended for?
Datadog doesn’t bundle all of its modules together into subscription plans like Site24x7. Instead, each unit is offered individually and you can choose to take one or many of them. Multiple units complement each other and provide extra facilities in combination. The Datadog route is a little more expensive than Site24x7.
Pros:
- Easy and Simple Deployment: It does not require any query language or technical expertise; users can easily deploy and start monitoring.
- Holistic View: Gives a unified platform view across the teams to collaborate and see what is happening in the database.
- Boosts Your Database Performance: The tool identifies the list of queries which are running slow, hence helping you to boost database performance.
- Consists of Over 700 Integrations: The tool comes with all reputed integration services like the Google Cloud platform, MongoDB, AWS, Azure, and much more.
Cons:
- Charges Per Host: Users feel that its pricing model is expensive because it charges per host, becoming expensive for monitoring high-throughput systems.
Datadog Infrastructure is packaged in three editions: Free, Pro, and Enterprise. The Free service will only monitor up to five hosts. The Pro has all the monitoring services that you need to support MariaDB databases. The higher-level features of Datadog Infrastructure, such as Correlations and machine learning for performance thresholds are reserved for the Enterprise plan. You can get a 14-day free trial of either of the paid plans.
6. Opsview
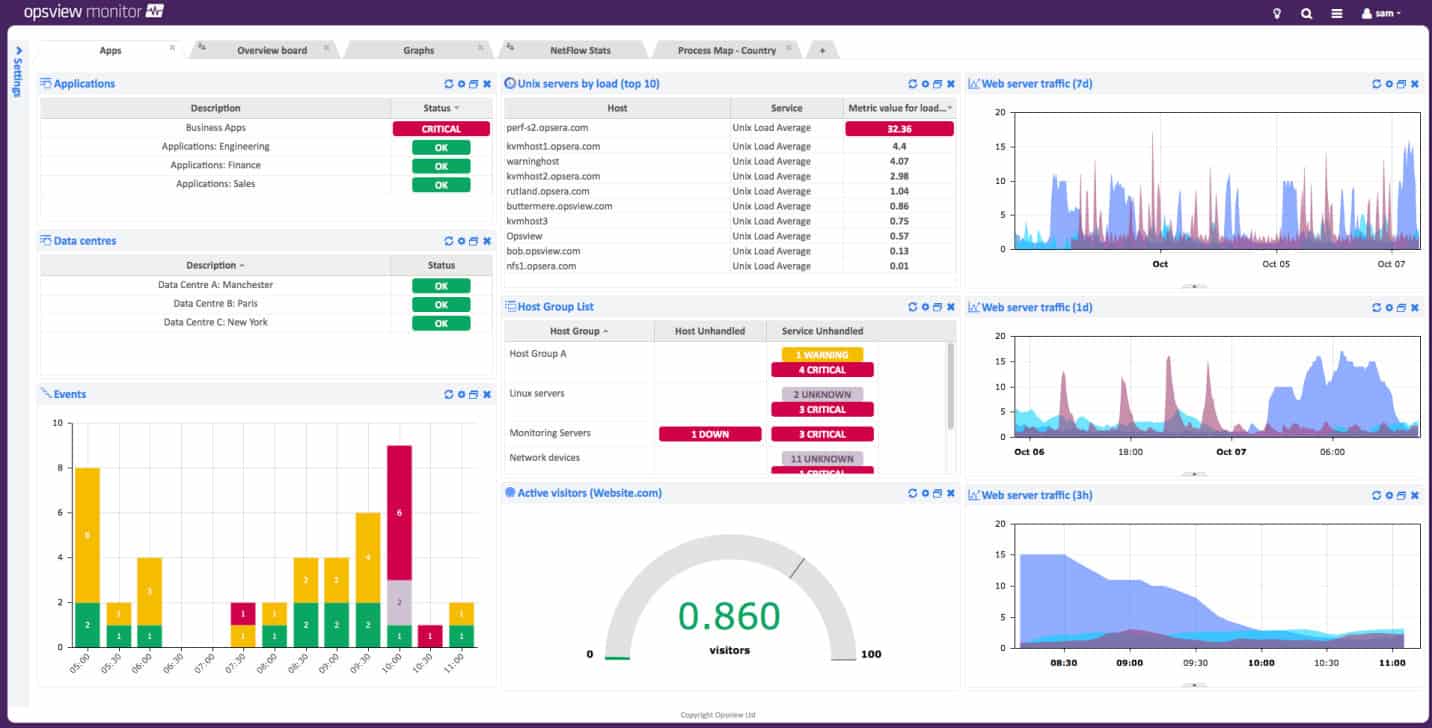
Opsview is an adaptable resource monitoring package that covers networks, servers, and applications. Its capabilities can be augmented by a library of add-ons, called “opspacks.” There is an opspacks available to monitor MariaDB. It is also possible to install Nagios plugins into Opsview.
Key Features:
- Opsview Graph Center: Shows the results of Service Checks with the help of the Graph Center. Users can see both the Graph Center and the ‘Investigate mode’ pane of the Service Check.
- Network Analyzer: Automation makes the network process easier, which includes identifying misconfigurations, locating unfamiliar or disconnected devices, and improved security.
- Opsview Log Analytics: Because of its close integration with Opsview Log Analytics, you can easily run queries across the whole dataset.
- SNMP Traps: Service Checks that are set up to receive SNMP traps adhere to a set of guidelines. Each of these rules is examined individually, and if a match is found, a certain action is performed.
Why do we recommend it?
Opsview provides monitoring for servers, services, and applications with an extra module for network monitoring. This platform provides extensions, called Opspacks and there is one of these that will monitor MySQL and MariaDB databases. The service monitors both on-premises servers and cloud platforms and your databases can be deployed in either of these systems.
The MariaDB opspack adds screens to the system dashboard and makes a data collecting agent available. This agent will collect information on replication and interactions with server resources. It also examines the performance of queries. It allows you to select a particular query and watch the variations in its execution performance over time. This is particularly useful for focusing on the performance of a critical database action.
Opsview is able to monitor other database management systems as well as MariaDB. It gives you a single console to monitor all IT resources. As well as monitoring your on-premises services, this tool can check on the performance of cloud resources. It is able to blend together services in overviews that cover resources located on your premises and in the cloud.
The Opsview system includes an autodiscovery service that explores your network and identifies all resources. This extends up to the logging of software and applications. The system scan is continuous, so it spots any changes you make to your infrastructure and updates its records automatically. It will also map VMWare structures. This means that the system sets itself up and keeps itself updated.
Opsview includes a performance threshold system for each of the metrics that it tracks. These trip alerts if crossed and those alerts can be sent out as notifications by email, SMS, or Slack message. The Opsview system creates a stack map and provides support for anomaly detection and root cause analysis.
Who is it recommended for?
Opsview is affordable for all sizes of enterprises and there is a plan for SMBs. The Enterprise edition downloads onto Linux, and the Cloud edition is a SaaS package. Opsview Cloud is considerably more expensive but it includes the Network Analyzer, which is a paid extra on the Enterprise plan.
Pros:
- Helps Business Service Monitoring: Monitors your business, IT estate, and alerts admins to problems about the system and maintains good speed.
- Gives Customizable Reports: Some of the generated reports can be modified according to business needs. You can download them in multiple formats like PDF, .docx, and xlsx and send them via email to make suitable changes.
- Event Handlers and Viewers: Allows users to have more granular control over event handlers. The events will be shown in a bar graph format with all details like when the issue occurred.
- Includes 39 Performance Metrics: Ensures that the system is running at the optimal speed. Users can make use of 39 performance metrics to monitor and make changes based on that.
Cons:
- Users Find Opsview Pricey: Users reviewed that Opsview is expensive compared to other DB monitoring tools, and they also noticed issues while setting up the database server.
Opsview plans are available in three editions: SMB, Enterprise, and Opsview Cloud. SMB is for small businesses and Enterprise is designed for larger organizations. These are both on-premises packages for installation on Linux servers. Opsview Cloud is a hosted SaaS system. All versions have the same functions and all will take the MariaDB opspack. Get a free trial of the cloud service.
7. LogicMonitor
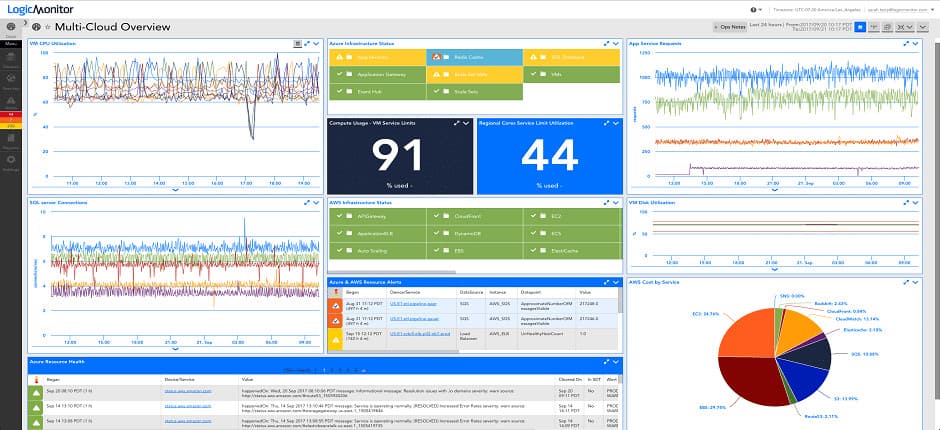
LogicMonitor applies its monitoring system for MySQL to MariaDB monitoring. This service is part of a cloud-based IT resource monitoring package that can be extended by integration. The MySQL service is one of a library of 2000 integrations.
Key Features:
- Agentless Data Collection: Without requiring the installation of additional software, LogicMonitor discovers your MySQL databases automatically and keeps an eye on crucial events like transactions, blocks, and table scans.
- Deploy Anywhere: Closely monitors your MySQL databases and provides you with thorough performance metrics, whether they are hosted on virtual machines in your office or on cloud platforms.
- Data Forecasting: Makes it easier to identify patterns and trends so you can prevent delays or issues before they arise.
- Proactive Alerting: It learns what’s normal for your system and only alerts you if something needs your attention, cutting down on unnecessary notifications.
Why do we recommend it?
LogicMonitor is similar to Opsview but it is only available as a SaaS platform. This is a full-stack monitoring package and it also offers some system management tools, such as configuration management and log management. This system can also be used for security monitoring and it is able to watch over MariaDB databases.
The database monitoring service examines query performance, database management system activity, interactions with server resources and the network, and access by applications and users. All of the metrics that the service collects are displayed as graphs and charts in the dashboard.
The LogicMonitor service deploys AI to set performance expectations and it uses these to generate alerts if anomalies are detected. The system creates a full-stack view, crossing networks, servers, and applications and linking their dependencies. This speeds up root cause analysis for problems, which is also AI-supported.
Who is it recommended for?
LogicMonitor doesn’t publish its prices and that makes assessing its suitability for small businesses difficult. The SaaS platform is cable to monitor both on-premises systems and cloud platforms equally. The bundle has two plan levels with both including Maria DB monitoring capabilities. The top plan adds on AI-based demand forecasting and application sandboxing.
Pros:
- Tracks Your SQL Query Cache: Helps in database tuning by tracking the SQL cache, users can fine tune the database by applying variable options like enlarge, reduce, disable etc.
- Over 2000 Integrations: The tool comes with over 2000 built-in integrations, so you can easily connect the logic monitor with your desired software to achieve smooth business workflow.
- Quick Deployment from Anywhere: The tool is easy to deploy from anywhere as it uses automation and machine learning methods, so no more struggles to deploy, you can choose your desired integration service and get it done quickly.
- AIOPS: 90% less alert noise meaning no unnecessary alerts and panicking. It will show only the critical parts of the database that matters for your organization to take action instantly.
Cons:
- Highly Dependent on Stable Internet Connection: Users find the logic monitor tool didn’t work properly if the internet connection is poor, not allowing you to use advanced features or customization options.
LogicMonitor has a Core system and also a Website Monitor service – these are two separate packages and you only need the Core system to monitor MariaDB. This plan is available in two editions. These are called Pro and Enterprise – these have the same basic facilities but Enterprise will monitor more than 200 devices and includes the AI features of the service. You can assess LogicMonitor for a 14-day free trial.
MariaDB monitoring FAQs
Is MariaDB secure?
MariaDB databases are secured by encryption and the requirement for user accounts for access means that all activity within a database instance is traceable and logged.
Does MariaDB replace MySQL?
MariaDB is a very close copy of MySQL. The two systems are mutually compatible. However, there are no plans to retire MySQL so MariaDB can’t be considered as its replacement.
Is MariaDB better than MySQL?
Analysts claim that MariaDB is faster at searching data than MySQL. A high number of concurrent connections can slow down the response times of a MySQL instance but that doesn’t happen with MariaDB.
