Moogsoft is a well-established AIOps (Artificial Intelligence for IT Operations) platform designed to help IT teams improve incident management through automation, machine learning, and event correlation. It focuses on reducing alert noise, speeding up issue detection, and improving operational efficiency across complex IT environments.
Moogsoft works by ingesting large volumes of event data from monitoring tools and applying machine learning to identify patterns and relationships between alerts. Instead of presenting teams with isolated notifications, it groups related events into meaningful incidents and helps prioritise them based on impact and relevance. This reduces the volume of alerts and makes it easier for teams to focus on the most important issues.
The platform is well suited to organisations operating in cloud-native, microservices, and container-based environments where traditional monitoring tools can generate excessive noise. It integrates with a wide range of third-party systems, allowing teams to centralise incident management and gain a unified view of operational health. Custom dashboards and analytics further support visibility across complex infrastructures.
Overall, Moogsoft helps organisations streamline IT operations by reducing manual workload, improving incident response times, and enhancing system reliability through AI-driven insights.
About Moogsoft
Moogsoft began operations in 2011. The company is based in San Francisco, California, and is still a private company. However, the two founders of the business are still running the board, and the company has attracted an impressive list of investors, including Cisco Systems, Redpoint, and Singapore Technologies Telemedia.
The Moogsoft platform is categorized as an IT Operations Analytics (IOTA) system. It acts as a hub, linking to the status reporting functions of devices and software and maintaining connections through collaboration tools, work schedules, and project management systems. Notifications received from one set of associated services get forwarded to another set of services.
Moogsoft includes Machine Learning processes to enable it to assess incoming reports. This is a little like the processes performed by SIEM systems, which look through log messages for signs of malicious activity. However, instead of looking for security breaches, Moogsoft looks through status reports for performance problems. It generates its alerts and also receives pre-generated alerts and assesses them.
The Moogsoft Platform
Moogsoft operates as a SaaS platform. The principal value of this system is that it receives operations data and alerts from other systems and processes them. The strategy is boiled down into six stages:
- Ingest
- Deduplication
- Enrich
- Correlate
- Collaborate
- Notify
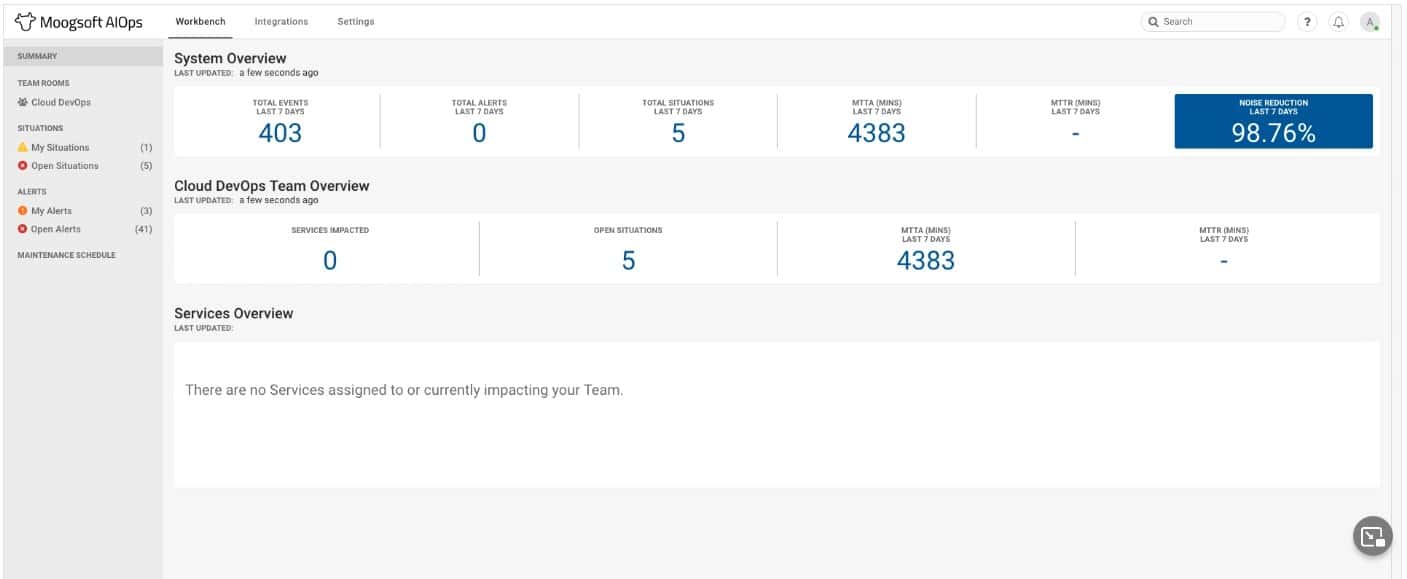
This translates as data coming in, that data is interpreted and displayed on the system dashboard. The system measures performance metrics against acceptable performance levels, spots related issues, and identifies the root cause. The system then checks in a rulebase and acts accordingly. Those rules tell the Moogsoft system where to send a notification about the event and what format the message should take.
Ingest
The Ingest part of Moogsoft’s tasks involves data exchange agreements with monitoring services. Some of those data inputs come from status reports from software and devices. For example, Windows Events are log messages from the Windows operating system, and the format is also used by many Windows-resident software or Microsoft products, such as Microsoft 365. So, in essence, the Ingest system acts as a log server.
Other sources of system performance information come from device agents resident on network equipment, such as switches and routers. These agents send out status reports under procedures laid down in the Simple Network Management Protocol (SNMP). The SNMP system requires a controller to send out requests for reports, and the Moogsoft system performs this role, gathering and centralizing the responses. An SNMP agent will also send out a warning message without waiting for a request if it detects a problem on its monitored device. Moogsoft collects these, too. Servers and firewalls can also use SNMP to communicate statuses.
Compatibility with monitoring packages, such as Datadog, New Relic, AppDynamics, and Zabbix. These interfaces are called “integrations.” You have to activate integrations when you set up your account – they are not running automatically.
There are also integrations for operating systems, such as Windows, Linux, Azure, and AWS. Status reports from virtualizations, such as Hyper-V and VMWare, can also be ingested, as can container statuses from Kubernetes and Docker. Databases, Web servers, file servers, and mail systems can also send performance metrics to Moogsoft.
It is also possible to set up your custom data feeds. The dashboard of Moogsoft facilitates this process. You need to set up your data source to send its feeds to the Moogsoft server and then tell Moogsoft what to do with each piece of data. This setup would include specifying performance thresholds and setting rules to tell the platform what to do if a point is crossed.
Deduplication, Enrich, and Correlate
The core of the Moogsoft system is its ability to sort through data. Moogsoft receives monitoring data from many sources. These are from different monitoring systems and are collected from several points on the systems.
If a problem occurs in one area of the system, it will ripple through to impact performance at many other points. For example, if one switch gets overloaded, traffic will slow at different points on the network, and interactive applications will report slow responses or lost packets. In such a case, Moogsoft will receive many error reports.
Moogsoft uses AI to identify the root cause of the problem when it receives multiple reports in the same short period. This is what is referred to as deduplication and correlation.
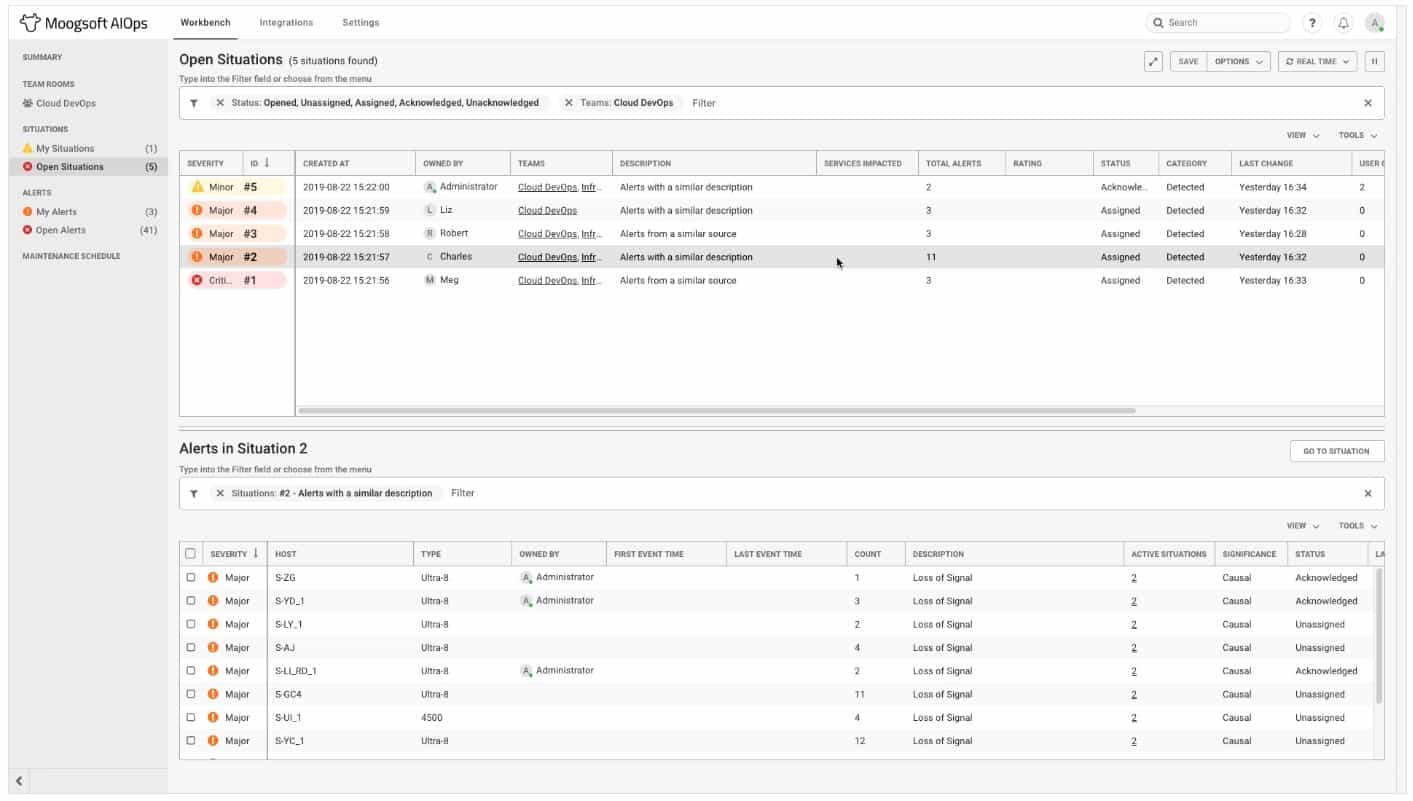
The monitoring systems covering different parts of the network or separate applications don’t know what is happening elsewhere. This is a correlation. Events in isolation might not be apparent problems, but they show an issue that needs to be dealt with when they are combined.
The Moogsoft service scans for performance anomalies by checking the level of statistics that come in against its performance thresholds. Those thresholds get adjusted constantly to alter what is regarded as standard performance. This anomaly detection process is aided by Machine Learning and reduces the number of false alarms raised by the system. This is how Moogsoft enriches the data that it receives.
Collaborate
The Moogsoft system uses integrations to promote solution collaboration. For example, the tool can send the alerts it deduces in the central server through collaboration software, specifically Slack and PagerDuty.
Notify
Moogsoft uses the same integrations listed for Collaborate – Slack, and PagerDuty – to provide routing for the Notify stage of its operations.
Moogsoft deployment options
Moogsoft is a SaaS platform. That means that it is hosted on Cloud servers. Those servers run all of the service software and provide storage space for received status reports. An account for the Moogsoft system allows many users accounts apart from the core administrator account. The number of accounts you can create depends on the plan that you choose. Separate user accounts enable the administrator to track the activities of each user and allocate different capabilities.
Moogsoft prices
Moogsoft is a subscription service with a charge rate per year. There are three plans available:
- Free
- Team
- Enterprise
The Team account is the standard option, with the Enterprise plan being a customized option. Unfortunately, the free version doesn’t have any outbound integration. That means that the alerts generated by the system get displayed in the console, and the technicians need to decide what to do about them.
All options include the anomaly detection service, but the free version only allows you to set up one correlation rule – you get 10 with the Team edition. You can only plug in 25 inbound integrations with the free version, but there is no limit with the Team version. You can set up your customized integrations with all versions without limits, so you could probably use that allowance to connect to more input data sources with the Free plan.
Moogsoft offers a service level agreement (SLA) of 99.9 percent system availability for the two paid options, but there is no guarantee for the Free plan. You don’t get live support with the Free edition, but it is included with the paid plans.
All of the plans are hosted on the Moogsoft server, which stores data for analysis. Even though it costs nothing, the Free program includes data storage with a retention period of 30 days. The two paid plans will retain data for a year.
The price of the team plan depends on the number of events and metrics that you want the system to process per month.
The options are:
- 15,000 events and 1.5 million metrics = $9,996 per year
- 25,000 events and 2.5 million metrics = $16,500 per year
- 35,000 events and 3.5 million metrics = $23,004 per year
- 45,000 events and 4.5 million metrics = $29,496 per year
- 55,000 events and 5.5 million metrics = $36,000 per year
- 65,000 events and 6.5 million metrics = $42,504 per year
- 75,000 events and 7.5 million metrics = $48,996 per year
- 85,000 events and 8.5 million metrics = $55,500 per year
- 100,000 events and 10 million metrics = $62,004 per year
You can get a 14-day free trial of the Team edition.
Moogsoft strengths and weaknesses
Moogsoft is an exciting package. It generates alerts and routes them through to incident management and communications tools. However, you could just feed all of the input sources straight into PagerDuty, which takes feeds from all of the integrations that Moogsoft has and Slack integration.
Pros:
- Inputs from a wide range of monitoring tools
- Output to PagerDuty and Slack
- AI processes to generate alerts
- Views of events shown live in the dashboard
- Cloud storage for data retention
Cons:
- No on-site option
- Could just skip Moogsoft and feed data directly through to PagerDuty
- Moogsoft alternatives
Moogsoft is an incident management system, but it offloads the actual incident management to PagerDuty. Better yet, as many monitoring tools include notification forwarding for alerts, do you need an incident manager at all?
Moogsoft Alternatives
Here is our list of the five best alternatives to Moogsoft.
- Datadog Incident Management This tool is part of a SaaS platform that includes monitoring tools as separate subscriptions. This tool is aimed at DevOps environments, but it could also be used just for operations. The service has its integrated collaboration tool so you can assign tasks to team members without having to stream them out to Slack. The device will integrate with any of the Datadog monitoring tools, and there are also distributed tracing and continuous profiler options on the platform. As Datadog is one of the integrations available in Moogsoft, you could use the Datadog Incident Management toll instead and keep all of the data exchanges on one single platform. Datadog also integrates AI into its alert correlation system, and it has an application dependency mapping service for root cause analysis.
- PagerDuty This is the incident management implementation tool that Moogsoft writes out. This system has integrations with more input monitoring tools than Moogsoft, so you could just bypass Moogsoft altogether and feed all alerts generated by the associated monitoring tools straight through to PagerDuty. Just like Moogsoft, PagerDutry has an integration with Slack for team collaboration functions.
- SolarWinds Service Desk This SaaS platform includes a ticketing system that can automatically route tasks to team members. The tool isn’t just for Help Desk operations because alerts can be fed directly into the system from monitoring services, especially those monitoring tools produced by SolarWinds. In addition, the Service Desk system can integrate with Jira for project management and DevOps redevelopment loops, and it integrates with Slack for extra collaboration features.
- OpsGenie This is an on-call and alert management system from Atlassian and is a stablemate of Jira, the project management tool. Atlassian enables these two tools to work together on its SaaS platform. OpsGenie includes an alert assessment that can merge and prioritize messages. In addition, the service organizes incoming alerts and routers them to team members, letting Jira provide goal attainment supervision, capacity planning, and timeline tracking.
- Splunk On-Call, This add-on service for the Splunk data analysis tool is directed towards businesses that run 24-hour operations and need to call out specialists at any hour. The tool can route tasks to individuals or teams, and it can also be used as a collaboration tool to allow technicians to find a solution. This service can process incoming messages from Microsoft Teams or Slack, and it can also send out notifications through those same channels.
