

Reliable data storage has become a critical part of modern IT infrastructure, especially as organisations run increasingly complex workloads across on-premise and cloud environments. NetApp is a major provider of enterprise storage systems, supporting use cases such as data protection, virtualisation, and cloud storage. Without proper visibility into these systems, performance degradation, capacity issues, or unexpected downtime can quickly impact operations.
Here is our list of the best NetApp monitoring tools:
- ManageEngine OpManager EDITOR’S CHOICE Get network and general server monitoring tools alongside specific routines for tracking NetApp performance. Available for Windows Server, Linux, Azure, and AWS. Start a 30-day free trial.
- Site24x7 NetApp Monitoring (FREE TRIAL) This cloud-based tool monitors the health metrics of your NetApp systems. It provides visibility into disk usage, utilization rates, and more from a single dashboard. It also provides instant alerts for proactive actions. Sign up for a 30-day free trial.
- IntelliMagic Vision for SAN This package provides live monitoring for multi-unit storage configurations, such as the FAS or the SAN. This system can track issues with equipment that comes from a list of providers, including NetApp, and it creates automatically adjusted alert thresholds through the deployment of machine learning. Available as a virtual appliance or as a cloud service.
- NetApp Cloud Insights A SaaS package from NetApp that enables infrastructure monitoring that includes both on-premises and cloud-based NetApp systems.
- Nagios NetApp Monitoring Built-in capabilities for NetApp and other SAN monitoring within this package of system monitoring tools. Installs on Linux.
- Icinga 2 NetApp Monitoring This free Nagios clone can be extended to monitor NetApp systems through the use of a plug-in. Runs on Linux, Windows, and AWS.
- SolarWinds NetApp Storage Performance Monitoring Monitors clusters, individual servers, and each server resource for a range of storage solutions, including NetApp. Runs on Windows Server.
- Zabbix NetApp Monitoring This free monitoring system can be extended by a template to monitor NetApp systems. Runs on Linux, Docker, or all the major virtualizations.
NetApp monitoring tools focus on tracking the operational state of storage systems in real time, helping IT teams understand how resources are being used and where pressure points are developing. This includes monitoring key areas such as capacity levels, system behaviour, and performance trends across the storage environment.
These tools are particularly useful in large or complex NetApp environments, where manual monitoring becomes inefficient. Centralised dashboards, automation features, and integration with wider IT systems help streamline operations and reduce the need for manual intervention. Reporting capabilities also support compliance requirements and long-term capacity planning by tracking performance trends over time.
This guide will explore the best NetApp monitoring tools available, highlighting key features, benefits, and considerations for selecting the right solution for your organisation. Any size or type of business that uses a NetApp storage system should find our candidate list useful.
The Best NetApp Monitoring Tools & Software
NetApp is essentially a system that coordinates clusters of servers for direct access over a network. This is a typical Storage-Attached Network configuration, and you will find that most SAN monitoring systems will automatically be able to monitor your NetApp FAS implementation.
Our methodology for selecting NetApp monitoring tools
We reviewed the market for NetApp storage monitoring systems and analyzed the options based on the following criteria:
- Monitoring for FAS controllers
- Individual storage device monitoring
- Load balancer monitoring
- Storage server resource monitoring
- Alerts that trigger off performance indicators or resource capacity exhaustion thresholds
- A free trial or a demo package that enables the service to be assessed before buying
- Value for money from a monitoring service that can improve the efficiency and cost-effectiveness of a NetApp storage system
The following sections provide greater details of the best monitoring packages to watch over NetApp implementations.
1. ManageEngine OpManager (FREE TRIAL)

ManageEngine OpManager is a monitoring package for networks and servers. This combination of abilities is perfect for a system such as NetApp, which is a collection of storage servers that are fronted by the network function of load balancing. The ManageEngine package will monitor all servers on a network simultaneously and detect traffic patterns between them.
Key Features:
- Monitors networks and servers
- I/O activity monitoring
- Storage demand forecasting
- Throughput measurement
Like all other ManageEngine tools, this package has a series of performance thresholds inside it. These trigger alerts can be sent out as notifications by email, SMS, or Slack post. This means that technicians don’t have to worry about watching the monitoring console. Forecasting demand is another method that this package offers to prevent problems arising in your NetApp system.
Pros:
- Monitors traffic in and out of storage
- Tracks the distribution of activity on NetApp installations
- Provides forecasting for storage requirements and network capacity
- Root cause analysis that includes connected systems, such as the network
Cons:
- Doesn’t track application activity
ManageEngine OpManager is available in four editions and the first of these is Free. However, that package will only monitor three devices, which doesn’t offer much capacity. The other three packages provide options for single networks and WANs. The software is available to install on Windows Server, Linux, Azure, and AWS and you can get OpManager on a 30-day free trial.
EDITOR'S CHOICE
ManageEngine OpManager is our top pick for a NetApp monitoring tool because it provides real-time insights into the performance and health of NetApp devices, enabling IT teams to quickly identify and resolve issues. At the same time, the package keeps a constant track of the statuses of network devices, such as switches and routers. One of OpManager’s strengths is its ability to monitor key metrics such as disk utilization, latency, and throughput, which are crucial for maintaining optimal performance in a NetApp environment. The tool supports SNMP and can automatically discover NetApp storage devices, making setup and ongoing management straightforward. The customizable dashboards and reports allow users to visualize storage performance and trends, helping in capacity planning and resource allocation. OpManager’s alerting system can notify administrators of potential issues before they escalate, ensuring proactive management. This tool is a good choice for organizations looking for a reliable solution to monitor NetApp environments as part of a wider network monitoring package. Network discovery and automated topology mapping are other reasons to buy.
Download: Get a 30-day FREE Trial
Official Site: https://www.manageengine.com/network-monitoring/download.html
OS: Windows Server, Linux, AWS, and Azure
2. Site24x7 NetApp Monitoring (FREE TRIAL)

Site24x7 is an SNMP-based NetApp monitoring platform that operates from the cloud. It provides unified views of your infrastructure by correlating the data from your NetApp storage with the metrics collected from other areas of your network. It also generates insightful and audit-ready reports for different audiences.
Key Features:
- Monitors all the essential metrics via SNMP.
- Presents the metrics on intuitive dashboards for effective analysis.
- Sends instant alerts through email, SMS, voice calls, or any other incident management tool.
- Support custom configurations and thresholds.
- Provides unified views of your infrastructure.
Site24x7 is a cloud-based tool that is easy to set up and use, without requiring intensive resources upfront. At the same time, it can comprehensively monitor your NetApp storage devices to gather data about the current disk capacity, status, utilization rate, and more. Furthermore, it displays these analyses on intuitive dashboards that support informed decision-making.
Pros:
- Monitors key storage metrics.
- Supports SNMP-based monitoring.
- Generates alerts through multiple channels.
- Provides a unified view of your infrastructure.
- Reduces overhead.
Cons:
- Reports are less flexible.
Site24x7 comes in three editions: Lite ($9), Professional ($42), and Enterprise ($625). Note that all prices are per month. Sign up for a 30-day free trial.
3. IntelliMagic Vision for SAN

IntelliMagic Vision for SAN is a storage server monitoring package that specializes in watching over storage clusters. As well as monitoring Storage-Attached Network (SAN) configurations, it can monitor the Fabric-Attached Storage systems created by NetApp.
Key Features:
- Network activity monitoring
- Load balancing monitor
- Server coordination monitor
- Tracks server resource utilization
- Alerts on performance problems
As is explained in the name of this product, IntelliMagic Vision for SAN can monitor all SAN brands, not just NetApp. You can be running several types of SAN on different platforms and the IntelliMagic service will monitor all of them, providing a consolidated overview of the performance of all of those systems on one screen.
When monitoring your NetApp system, IntellMagic will report on the performance of the array, each individual server, and array management issues such as port availability and replication activity. Server resources, such as storage space availability and block usage are also tracked by the IntelliMagic package.
The IntelliMagic system includes alerts that trigger if there are hold-ups in access to resources or slowing data throughput. These alerts are automatically adjusted through a machine-learning process.
Other features in the IntelliMagic system include demand projections and space requirement forecasting. The system also provides root cause analysis whenever problems arise. The IntelliMagic service will also identify port throughput imbalances in a storage array.
Pros:
- Live monitoring for a range of SAN brands
- Demand forecasting with a report on the number of days before exhaustion
- Identification of port captivity imbalances on array ports
- Machine learning for alert threshold adjustments
- Overview and drill down screens for all SAN activities
Cons:
- No SaaS option
You can install the IntelliMagic Vision for SAN software and run it over a hypervisor as a virtual appliance, or run it on your cloud account – it isn’t a SaaS package, however. You can examine the IntelliMagic Vision for SAN system by accessing a 30-day free trial.
4. NetApp Cloud Insights

NetApp Cloud Insights is a SaaS package, resident in the cloud, that monitors the activities of another NetApp SaaS product, which is called BlueXP. The BlueXP system enables you to integrate your on-premises NetApp system with storage on various cloud platforms. It can even integrate multiple cloud platforms with your on-premises NetApp system.
Key Features:
- Hybrid monitoring system
- Based on BlueXP
- Problem resolution
The merger of on-premises and cloud infrastructure requires special mechanisms for coordination and delivery. The technology that underpins the BlueXP system is containers. So, NetApp Cloud Insights needs to monitor container activity as part of its storage monitoring package. The Cloud Insights system can identify when delivery systems are failing or operating inefficiently. It will also measure factors such as load balancing and throughput per module, treating each platform individually and then as a group.
Pros:
- Identifies the cause of performance problems
- Watches the interaction between platforms
- Spots irregular activity, such as cyber threats
Cons:
- Only monitors NetApp BlueXP
NetApp Cloud Insights is a SaaS package and it is only worth using if you already implement NetApp BlueXP. You can get a 30-day free trial of NetApp Cloud Insights.
5. Nagios NetApp Monitoring

Nagios is available in a free version, called Nagios Core, and a paid package called Nagios XI. Both of these editions can perform NetApp monitoring. Nagios is a software package that monitors networks, servers, and applications – the central package will give you NetApp monitoring but you can get even more detailed monitoring by activating plug-ins. The Nagios system can be extended by these free plug-ins that are available from the user community through Nagios Exchange.
Key Features:
- Full stack monitoring
- Storage device tracking
- Network interaction monitoring
The base package of Nagios monitors NetApp systems in the same way that it would track the activity on any other server. The main issue that it records is storage space capacity and utilization. Nagios Core supplies exactly the same monitoring services at this level as Nagios XI. Load balancing functions in NetApp are treated as networking features by the Nagios monitoring system.
Beyond the base package’s NetApp server monitoring, you can add a selection of extra monitoring capabilities from Nagios Exchange, which has 30 NetApp plug-ins available. These range from the application of the Simple Network Management Protocol (SNMP) to gather device status resorts to ONTAP querying systems that extract activity information from the NetApp management system.
Pros:
- Provides NetApp monitoring in the context of your entire system
- Can be extended by plug-ins for detailed NetApp monitoring
- Provides customizable performance alerts
Cons:
- Doesn’t provide IOPS monitoring
Both versions of Nagios were written for Linux. It is also possible to run it on Docker or as a virtual appliance over VMware or Hyper-V. If you want to run the software on a Windows computer, you would go for the virtual appliance option. You can download Nagios Core for free or get a 30-day free trial of Nagios XI.
6. Icinga 2 NetApp Monitoring
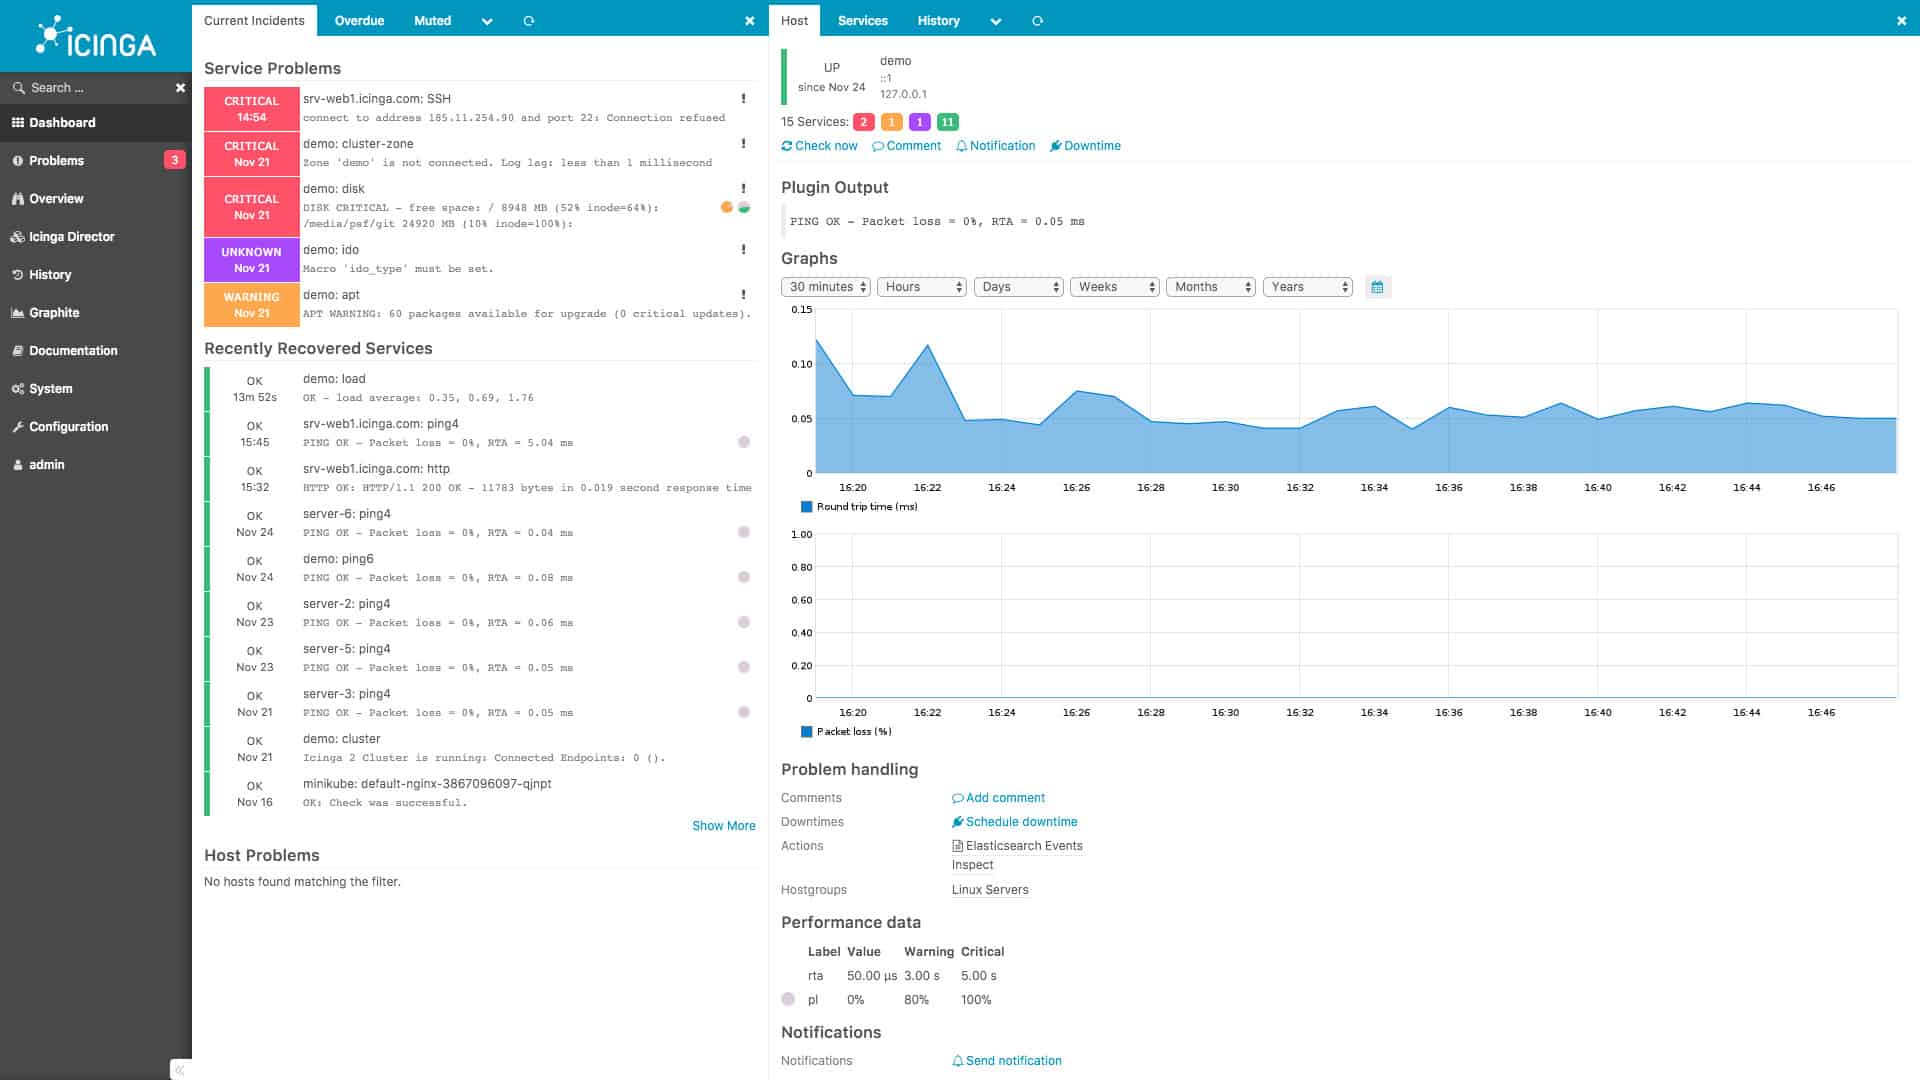
Icinga 2 is a fork of Nagios, and it provides a very similar NetApp monitoring service. That is, the main package includes storage server monitoring, which will watch over NetApp instances. This unit implements storage space availability monitoring, and there are alerts integrated into the package to draw the attention of technicians if space is running short.
One problem with the free Nagios Core is that it doesn’t have a front end with it. Icinga2 is also free to use but it has its own Web-based interface to display statistics. The monitoring screens of Icinga 2 can be customized and, like the Nagios system, the Icinga2 package can be expanded by plug-ins.
Key Features:
- Expandable package
- Monitors NetApp storage
- Performance alerts
As it is based on the framework of Nagios, Icinga 2 can take any plug-in that is written for Nagios. So, Icinga users can just go to Nagios Exchange and download free plug-ins there. However, Icinga also has its own registry of extensions, which is called Icinga Exchange. There are additional plug-ins for monitoring NetApp available there.
Pros:
- Compatible with Nagios plug-ins
- Can monitor cloud platforms as well as on-premises systems
- Customizable screens and alert thresholds
Cons:
- No professional support
Icinga 2 is a software package for Linux and Windows and it can also be installed on AWS accounts. You can download Icinga 2 for free.
7. SolarWinds NetApp Storage Performance Monitoring
SolarWinds Storage Resource Monitor provides NetApp performance monitoring along with the capacity to watch over many other types of storage servers. This system examines key metrics for the array, such as throughput, latency, and IOPS activity. The service helps you to identify specific units that are underperforming or overloaded. The package also provides alerts for evolving performance issues.
Key Features:
- Live SAN monitoring
- Traffic replays
- Capacity planning
An interesting feature of this package is that it allows you to record traffic and replay it into your NetApp system to examine the causes of past errors. The system also provides capacity demand forecasting that will let you know whether you need to buy more hardware to keep your NetApp system meeting requirements. This monitoring package isn’t exclusively produced for monitoring NetApp systems. It will simultaneously monitor all of your other storage servers.
Pros:
- Live monitoring of array management and interface activity
- Capacity planning projections
- Monitors multiple storage servers from different providers simultaneously
Cons:
- Not available as a cloud package
SolarWinds Storage Resource Monitor is an on-premises software package that runs on Windows Server and you can get it on a 30-day free trial.
8. Zabbix NetApp Monitoring

Zabbix is a free system monitoring package that covers networks, servers, and applications. This service offers a similar prospect to those of Nagios and Icinga 2 because you can use the core functionality of the out-of-the-box package to monitor the server properties of a NetApp system and identify network activity in and out of the array. However, Zabbix can be extended by templates, which operate in the same way as Nagios plug-ins.
Key Features:
- General server monitoring
- Specific NetApp monitoring
- Alerts for problems
There are several free templates available for NetApp monitoring in the Zabbix integrations list. These enable device checking via SNMP and also data interfacing with ONTAP to extract operating statistics. There are also templates for specific NetApp models, such as the NetApp AFF A Series. While you are using the NetApp monitoring extension, you still have access to the general server monitoring tools and also the network and applications monitoring services. There are extensions for other SAN types and there is no limit to the number of templates that you can add to your Zabbix monitor.
All of the monitoring mechanisms in Zabbix provide performance thresholds or capacity checks that trigger alerts if problems are detected. This matches the functionality of all of the paid monitoring tools on this list. However, it doesn’t provide machine learning to adjust threshold levels.
Pros:
- Extendable for NetApp or other SAN and NAS services
- Simultaneous monitoring of networks, servers, and applications
- Customizable monitoring system
Cons:
- Doesn’t track cloud NetApp implementations
Zabbix is free to use and it is an on-premises package that was written for Linux. You can also run it over Docker or any of the major virtualization systems. Download Zabbix for free.
