Remote Monitoring and Management (RMM) tools give IT teams and managed service providers (MSPs) the ability to oversee and control IT systems without needing direct access to devices. From monitoring performance to resolving issues and deploying updates, they provide a central way to manage distributed infrastructure efficiently.
A key advantage of open-source RMM solutions is their flexibility and customisation potential. Because the source code is available, organisations can adapt the software to fit their specific requirements, integrate it with other systems, or extend functionality. Many also benefit from active communities that contribute updates, plugins, and ongoing support.
Here is our list of the best free and open source RMM software systems:
-
- Nagios Core EDITOR’S CHOICE This is the leading open source system monitoring package that many others are forked from. It provides network, endpoint, and cloud service monitoring, and it can also be set up to monitor remote sites. Runs on Linux, macOS, or Linux.
- Zabbix This open source system monitoring package is professionally managed and can be expensed for system maintenance automation. Runs on Linux, Docker, cloud platforms, or a VM.
- Checkmk Raw This free, open source system monitoring package is available for Linux, Docker, or on its own virtualization.
- Icinga This on-premises monitoring package is a fork of Nagios and adherents of the two system argue over which is better. Available for Linux, Unix, Windows, and AWS.
- LibreNMS This package focuses on network monitoring, and it includes an autodiscovery service that eases the management of network devices. Runs on Linux or a VM.
- Netdata Community This is the free edition of the open source infrastructure monitoring system that operates on a hybrid model with both on-premises and cloud-based units. On-premises elements install on Linux, Unix, macOS, or Docker.
- OpenNMS Horizon This is the free version of OpenNMS, and it provides monitoring for networks, servers, and applications. Runs on Linux.
Need more: To fully explore all the leading commercial RMM packages available and take advantage of free trial software, check out our Best RMM Software post.
These tools allow IT teams to monitor system health, deploy updates, and resolve issues without requiring physical access to devices. This makes them particularly useful for managing remote teams, distributed environments, and large-scale IT infrastructures.
However, selecting the right open-source RMM solution can be challenging, as platforms vary in features, setup complexity, and support models.
This guide to open-source RMM tools explores leading options, highlighting their strengths and limitations to help you make an informed choice. It is designed for MSPs managing multiple clients as well as internal IT teams looking to improve operational efficiency and system visibility.
The open-source RMM tools reviewed here provide valuable insight into improving IT management capabilities and selecting a solution that fits different operational needs.
The best free and open source RMM software
As has already been stated, the RMM market is very broad. However, there are a few core principles that define the category and there are some other points that we looked for when selecting candidates for this list.
Our methodology for selecting free and open source RMM software
We reviewed the market for RMM package and narrowed down the options based on the following criteria:
- Must be completely free to use and an open source system
- RMM packages must be permanently free and not just a free trial
- A free open source RMM system can be the free edition of a paid package
- The source code for the package should be accessible for alteration
- Must be able to monitor networks and/or devices from across the network and the internet
- A system that includes management services, such as maintenance task automation
- Options to monitor multiple sites from one location
The following sections provide details on each of the packages that we selected.
1. Nagios Core

Nagios Core is a leading system monitoring package that can be expanded by a very large library of free plug-ins. Nagios started out as a free open source package and that option is still available, called Nagios Core. The creators now focus their attention on Nagios XI, which is a commercial package. Nagios Core is still maintained – Nagios XI is based on Nagios Core.
Key Features:
- Network device monitoring: Includes system discovery
- Network documentation: An inventory and topology map
- Endpoint monitoring: Watches performance and resource availability
- Nagios Exchange: A large library of free plug-ins to expand the package’s capabilities
- Monitors virtual systems: Tracks virtualizations and cloud virtual servers
Why do we recommend it?
Nagios Core is the leader of the pack in the field of free and open source RM tools. This is a system monitoring package that you can set up to watch over all of your IT assets. Install collectors on remorse sites to monitor a WAN and point data collectors on your cloud services to Nagios Core and get them included in the monitoring service as well.
I remember Nagios caused a showdown in the open source community when it set up Nagios XI. As it had been an open source system, most of Nagios was developed by volunteers who gave their expertise for free. Those enthusiasts felt exploited when the project leaders announced that they were going to take all of that free work and make money off it. The worker bees copied the entire code base of Nagios and set up their own free rivals.
Who is it recommended for?
Nagios Core is suitable for all sizes of businesses. Owner-managed companies with no IT budget will try to install the software themselves – that’s possible, I did it without any trouble. Bigger businesses will probably want to budget some money to build a new front end, which many users do with Kibana.
Pros:
- Full stack observability: Cover all layers of the stack with this package
- Modifiable code: Most people who customize this system start with the user console
- A supportive user community: The community is very active, and you can search through message boards for solutions to your problems or post your own questions
- Completely free to use: Nagios will try to get you to buy Nagios XI, but they can be ignored
- Wired and wireless systems: Include your WiFi system in the monitoring service
Cons:
- No network traffic monitoring: Bandwidth analysis and traffic flow monitoring have been moved into a paid package
There are a few reasons not to opt for Nagios Core. Large corporations are often obliged to only use software that is fully supported in order to meet the requirements of their professional insurance. Nagios Core doesn’t have that, but Nagios XI does. The system is available for Linux and any derivative of Unix, so you can install it on macOS as well. Although you can extract performance data from Windows, you can’t run the Nagios Core software on that OS. However, you can set up a VM with Hyper-V or VMware vSphere and run Nagios Core on that.
Nagios makes several attempts to divert you to the Nagios XI product page when you go to download Nagios Core for free. However, persevere and you will win.
EDITOR'S CHOICE
Nagios Core is our top pick for a free open source RMM software package because it is the leader in system monitoring services. The only problem with this service that could get it excluded from this list is that it is very light on the “management” part of RMM. However, you can integrate all of your own scripts into the system via the plug-in mechanism, so you can centralize all of your network administration tasks in the package. The console for Nagios Core is lousy, so while you are adjusting the system to suit your needs, look up a better dashboard with Kibana, Grafana, or Prometheus.
Official Site: https://www.nagios.org/downloads/nagios-core/
OS: Unix, Linux, macOS
2. Zabbix
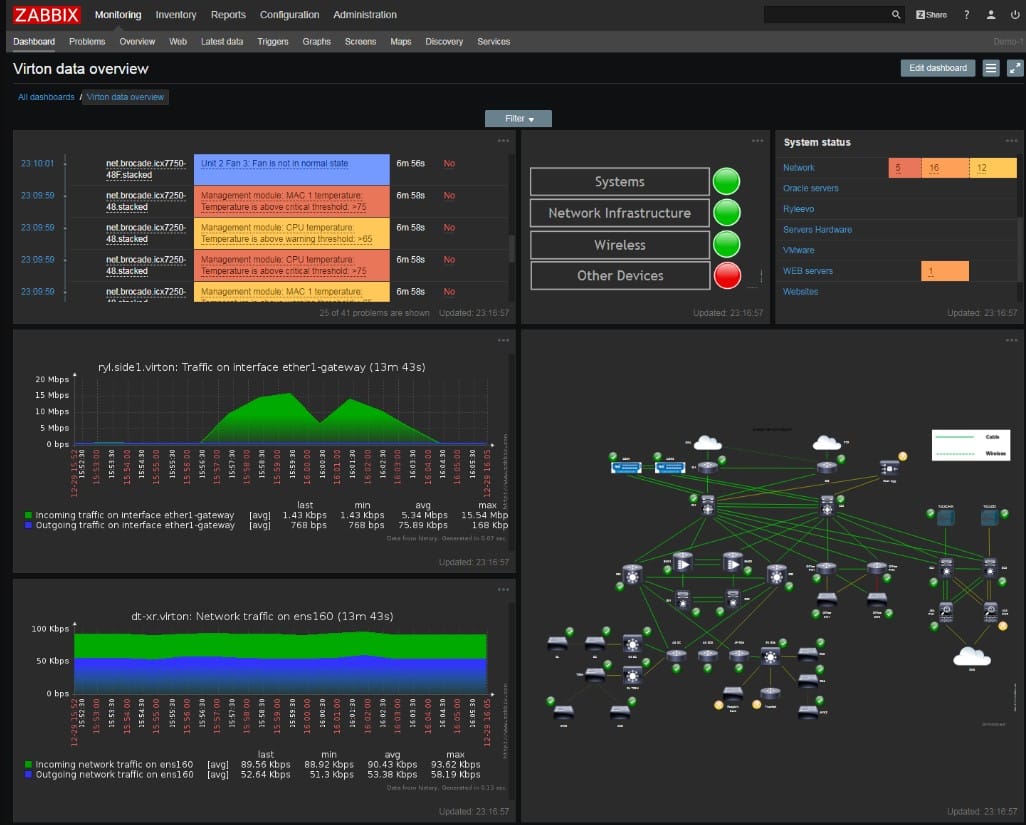
Zabbix is a system monitoring package that can be installed on premises or on a cloud account. This system is also available in an architecture for managed service providers (MSPs). The monitoring services in Zabbix look after networks, endpoints, and software. Unfortunately, like Nagios Core, the system management features in these packages are not very extensive. However, Zabbix can be expanded by templates and the service will accept expansions written in Ruby, Perl, PHP, and Java. It is also possible to import your shell scripts into the system. Automated maintenance tasks can be managed through Puppet, cfengine, bcfg2, or Chef.
Key Features:
- Distributed monitoring features: Look after multiple sites from one location
- Suitable for managed service providers: A multi-tenant architecture is available
- Community support: Professional support packages are available
- Network traffic flow monitoring: Available through an extension
Why do we recommend it?
Zabbix is an attractive and smooth-running monitoring package that can be extended to implement system management tasks through automation scripts and orchestration mechanisms. The service can monitor multiple sites through one console and it is able to run on cloud platforms. I noted that this tool would have been our Editor’s Choice were it not for Nagios Core’s unassailable superstar status.
The Zabbix team has created a strategy that straddles the definition of proprietary and open source. It is an open source package, but it is supported by a professional, full-time, paid team of technicians who also contribute to its development. The system can be installed off-the-shelf, and then you can activate extra features through the integrations library to create a tailored package that is the perfect fit for your organization. If you want to go further, you can write your own scripts and run them through the Zabbix interface on alert triggers or timers.
Who is it recommended for?
Zabbix is completely free, so it will be interesting for any business. The platform’s recent expansion to cater to managed service providers will expand its customer base even further. The users of Zabbix include some very large organizations, such as Dell, SEAT, and the European Space Agency.
Pros:
- Integration with third-party tools: Connect to other systems to extract performance data
- Orchestration and automation: Manage system maintenance tasks through scripts and data exchanges
- Full-stack observability: Monitor networks, endpoints, and software for performance problems
- Alerts for automated monitoring: Leave the system to watch over regular activity because you will be called in for your input when a problem arises
Cons:
- Won’t run on Windows: Put it on Docker or a VM to host it on Windows Server
Large organizations that need professional support can pay for a package from Zabbix. The company also offers a consultancy service. The software for Zabbix is available for installation on all of the major cloud platforms. It will run on most distros of Linux but, unfortunately, not on Windows or macOS. You can run it over Docker or a VM and that will let you host the system on a Windows computer. Check out all of the installation options on the Zabbix download page.
3. Checkmk Raw
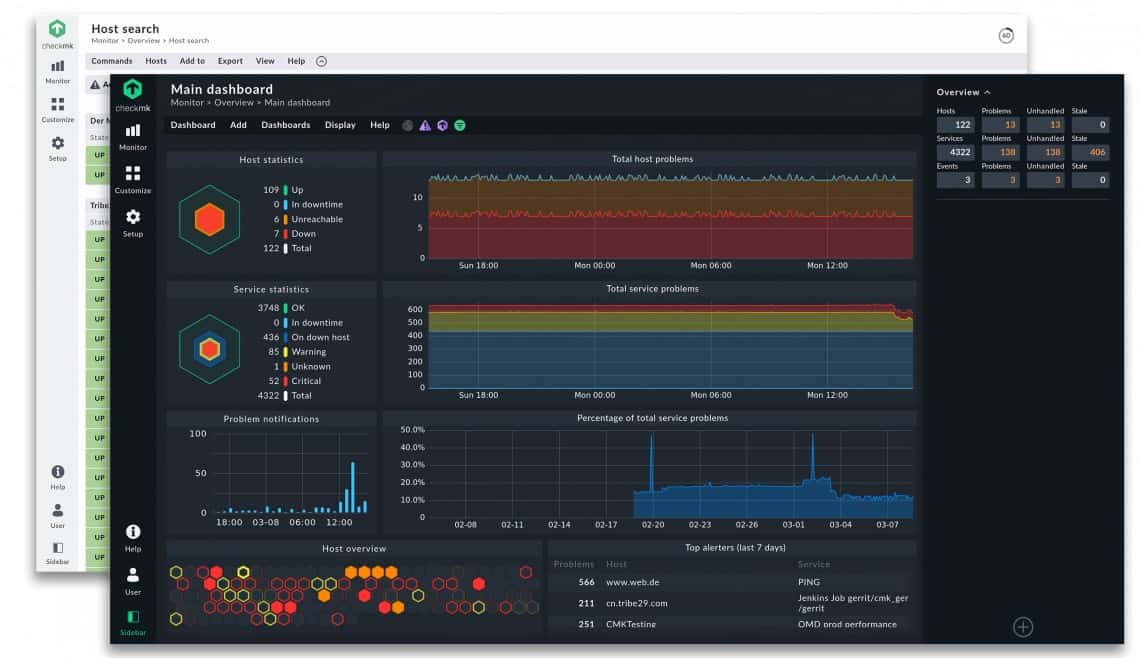
Checkmk is a monitoring package and its core is the Checkmk Raw open source system. Like Nagios, Checkmk offers paying subscribers more features in its higher plans than the users of the free version get. There aren’t many system management tools in this package but, like Zabbix, Checkmk can be expanded by scripts to provide those features. The service includes monitoring for networks, servers, and applications, but you have to upgrade to a paid edition to get container, virtualization, and cloud monitoring.
Key Features:
- System discovery: Creates a network inventory that lists endpoints as well
- Integrations library: Add on extra features to monitor specific technologies
- Alerts for system problems: Get notified if issues arise
Why do we recommend it?
Checkmk is an appealing and professional package that is well presented with easy-to-read screens that contain charts and graphs. I determined that this service is enhanced by more than 2000 plug-ins that give the dashboard specific screens for tracking the applications and equipment that you have on your site.
Checkmk Raw has a few limitations. It won’t monitor containers, virtualizations, or cloud platforms. That puts the package at a disadvantage in comparison with Nagios Core and Zabbix. However, its monitoring of on-premises systems is very competent, and its screens enable fast root cause analysis to identify where errors arose to cause performance problems.
Who is it recommended for?
The Checkmk Raw package is a good option for SMBs. You probably wouldn’t get this tool if you operate a hybrid environment. If you use containers, virtualizations, and cloud systems, you would be better off looking at the paid plans offered by this platform. Support is provided by the user community, which could be a problem for large organizations.
Pros:
- Log management: The free edition provides a log server that can consolidate and store logs plus make them available for analysis
- Network device and traffic monitoring: This package includes bandwidth analysis as well as SNMP-based device monitoring
- Troubleshooting tools: Use a port scanner and a switch port mapper plus Ping and Traceroute to investigate issues
Cons:
- No Windows version: Run the package on its own VM if you have Windows
This service is a software package that will install on Linux. You can also run the package on Docker. If you have a Windows server, you could go the Docker route or get the Virtual Appliance version, which runs within a proprietary virtualization. Download Checkmk Raw for free.
4. Icinga

Icinga is the most successful of the clutch of clones of Nagios. This package was created by the bulk of the team that had previously developed Nagios. This is a monitoring package, and it doesn’t have any system management services other than the discovery and inventory creation system.
Key Features:
- Monitors multiple sites: remote agents feed data through to the central console
- Monitor physical, virtual, and cloud: Covers all types of technology
- Full stack monitoring: Networks, servers, and applications
Why do we recommend it?
Icinga is a good alternative to Nagios. It is actually called Icinga 2. The monitoring package doesn’t have a front end, and you can use it at the command line. However, the download package includes a separate Web interface that is compatible. I found that you can easily choose to interface to a different front end, such as a Kibana interface.
This system can be a little tricky to set up. However, it is compatible with Nagios plug-ins, so once you have got the core package working well, you can expand it easily. This system is completely free and doesn’t have a paid version. However, the Icinga team will sell you a support package and that helps large businesses use the package.
Who is it recommended for?
Icinga is an interesting alternative for those who want to try something to compare Nagios to. It is free to use, and those technicians who have taken the time to learn the ins and outs of Nagios will be able to adapt to Icinga very easily. Icinga has some very important clients, including Adobe, Audi, and Siemens.
Pros:
- Free system: There is no paid version
- Community supported: You can buy a professional support package
- Adaptable system: Add on plug-ins, create your own front end, change the code
Cons:
- Competes with Nagios: Some say Nagios is better, others are staunchly loyal to Icinga
The Icinga package also provides you with a log manager and a data analyzer for capacity planning. The software can be installed on Linux, Unix, Windows, and AWS. The software can be acquired from the Icinga download page.
5. LibreNMS

LibreNMS is a basic automated network monitoring system. However, its automated discovery system creates a system inventory and that promotes the management of IT hardware. This system is unusual in that it uses the Link Layer Discovery Protocol (LLDP) and the very rare XDP for discovery. Like many network monitoring systems, this tool relies on the facilities of the Simple Network Management Protocol (SNMP) for status reporting. That standard can be activated on endpoints as well, and it can be used to report on system activity.
Key Features:
- Network discovery: Uses the Simple Network Management Protocol
- Endpoint monitoring: Can show system activity
- Multiple discovery protocols: Provides a “belt and braces” method to find devices
Why do we recommend it?
LibreNMS is a less complicated package than services such as Nagios and Zabbix. This means that you don’t get so many functions from LibreNMS, but it also means that the package is a lot easier to use. The service will identify and track all devices, sending alerts when problems are detected.
This package sticks to the basics of system monitoring and doesn’t have many extra features. The console can be set up to show time-series graphs of performance. Those performance graphs can also extend to server activity displays.
Who is it recommended for?
I noted that this package is going to be of interest to small businesses. Larger businesses will be more interested in the larger packages, such as Zabbix or Nagios Core. This package won’t run on Windows because it is only written for Linux. However, if you want to host the package on Windows, you can run it on a VM.
Pros:
- A simple system: Easy to set up
- Customizable dashboard: Decide which metrics to show in the console
- An alerting mechanism: Get notifications by email, IRC, or Slack
Cons:
- Not available for Windows: Written for Linux
The LibreNMS system is well documented and has guides for installation and usage that non-technical people could follow. You can get the software for free from the LibreNMS download page.
6. Netdata Community
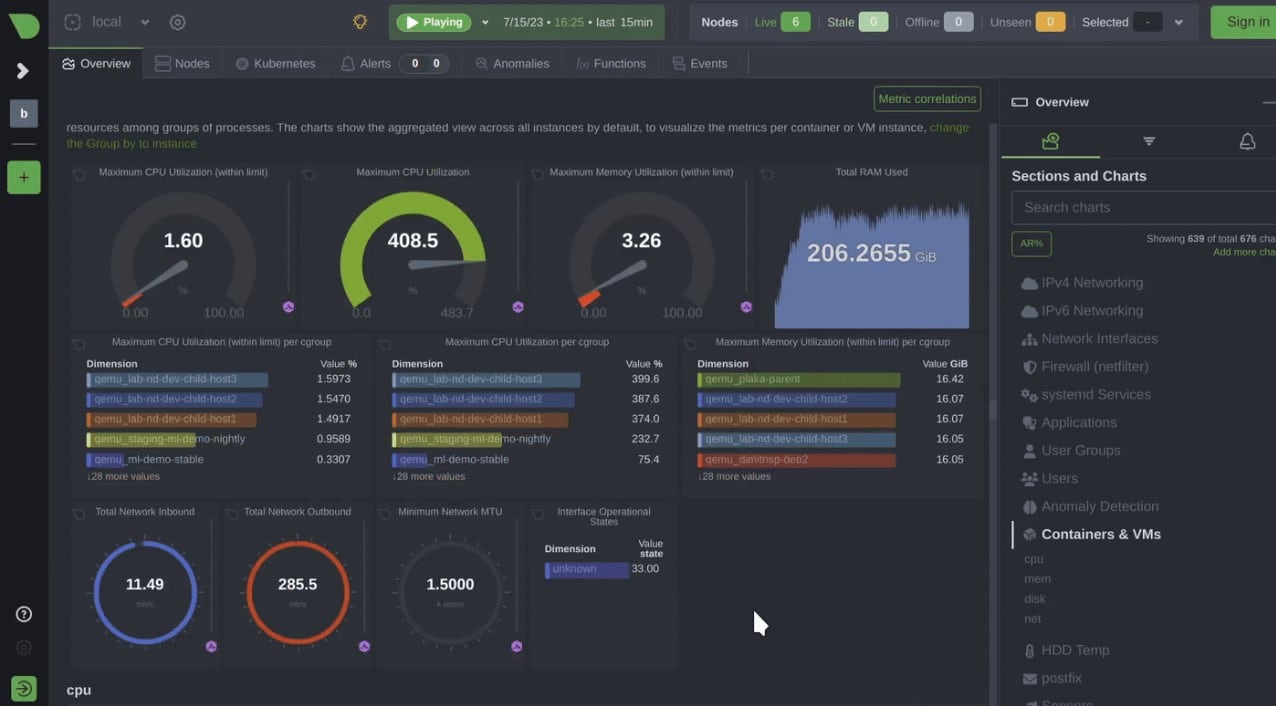
Netdata Community is a free edition for the Netdata system. The core of Netdata is a network monitor, but the package also includes a log manager and analyzer. The system has an autodiscovery service that identifies all of the equipment on your network and then continuously monitors it. The Netdata system also includes device configuration management.
Key Features:
- Monitors IT assets: Collects activity and performance data
- Hybrid monitoring: Physical and virtual servers, containers, and cloud services
- Extensible system: The console is hosted in the cloud and can be extended with plugins
Why do we recommend it?
Netdata is a sophisticated package that provides a hosted console and an on-premises engine. The users of the Community edition get to use that cloud-based dashboard, but all of the data retention is housed within the on-premises agent. Thus, you decide how long to retain data, which includes both stored metrics and logs.
I observed that this system operates a little like a SIEM. It gathers system messages, such as SNMP messages and logs. The central server sorts through that data looking for anomalous behavior. Rather than looking for security issues, this system searches for outlying load indicators, such as traffic surges or endpoint resource usage spikes. The package also provides opportunities for manual activity analysis.
Who is it recommended for?
Netdata is going to appeal to SMBs. However, the company has some large organizations on its client list, including SAP, Intel, and Nvidia. The package is new and its hybrid hosting model is a little unusual. The package’s Log Management unit is a useful extra service.
Pros:
- Customizable: This is an open source system with much of the backend hosted on your server
- Alerting mechanism: The system is driven by a series of performance expectations that trip alerts when crossed
- Data security: Data is held on your servers and access to it by the data manager is protected by encryption
Cons:
- Not available for Windows: The software is written for Linux, Unix, and macOS
Netdata has a hosted cloud-based element but the bulk of the system is actually installed on your own server. The server can be running Linux, Unix, or macOS. Unfortunately, there isn’t a version for Windows. However, the package will run on Docker, and that provides an opportunity for businesses that only run Windows. Sign up for the free Community edition.
7. OpenNMS Horizon
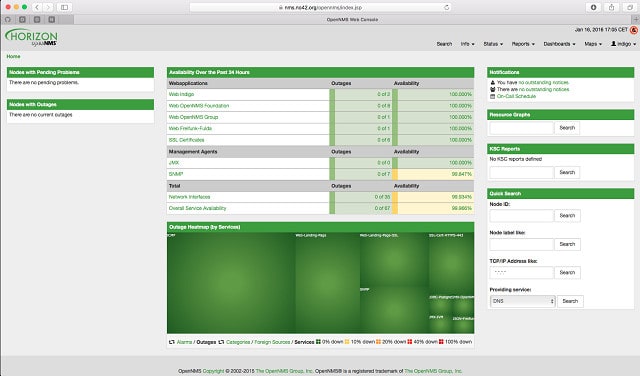
OpenNMS Horizon is the free version of OpenNMS, the paid version being OpenNMS Meridian. This open source system monitors networks and endpoints and can be extended by integrations to gather statistics from applications.
Key Features:
- Easy to set up: This system sets itself up through an autodiscovery process
- Remote monitoring: A remote site agent will send data through to a central console
- Web application monitoring: uses telemetry to gather data from microservices
Why do we recommend it?
OpenNMS Horizon is a very competent system monitoring package, and its asset tracking service provides management functions as well. I tested the Horizon package which is the Beta version of OpenNMS Meridian, so it could have some bugs. However, it includes some very sophisticated tools, such as distributed tracing.
Who is it recommended for?
The Horizon package has a lot of features and no limits on capacity. The only difference between this and the paid version of OpenNMS is that this release hasn’t been fully tested. So, there is an element of risk involved in taking on this package. However, as it is mainly a monitoring system, there is little damage that it can do to your system.
Pros:
- Cutting edge system: The Horizon release is the latest version of OpenNMS
- Open source: Check the source code and alter it if you want
- Attractive console: The dashboard includes charts, graphs, and maps
Cons:
- Not for Windows: The system is written for Linux
You can install OpenNMS Horizon on Linux. The software is available on GitHub to download for free.
