Overview of PagerDuty
PagerDuty is a SaaS-based incident management platform that provides notifications, automatic escalations, on-call scheduling, and other functionality to help teams detect and fix infrastructure problems. It is headquartered in San Francisco with operations in Toronto, Atlanta, the United Kingdom, and Australia. The service uses machine learning and automation to alert users to disruptions and outages. The software operates as a standalone service or can be integrated with just about any monitoring service.
PagerDuty also provides prescriptive analytics using machine learning that helps you gain valuable insights into your team’s performance trends, the health of your operations, the business impact of an incident, and more. The tool also engages the right people to accelerate issue resolution.
PagerDuty’s key capabilities include:
- Modern incident response: automate work across teams, execute detailed playbooks, and accelerate resolutions.
- On-call management: alerting and scheduling so your teams are ready and empowered to take fast action.
- Integration: Integrates with any tool in your ecosystem, aggregating and transforming any signal into real-time insight and action.
- Coordinated response: drive coordinated business response with stakeholders in real-time through proactive notifications and status dashboards.
- Event intelligence: apply machine learning for full incident context, real-time triaging, and personalized recommendations.
- Analytics: understand the systemic impact of issues on your customers, teams, and bottom line.
A 14-day-trial with full access to all the features is available for free with no credit card required. After the 14 day trial, it will default to the Free plan unless you upgrade to the premium plan of your choice.
| Free | Professional | Business | Digital Operations | |
|---|---|---|---|---|
| Max users per account | 5 | Unlimited | Unlimited | Unlimited |
| Features | On-call scheduling, Unlimited API calls, 600+ out-of-box integrations | Free plan + Unlimited international phone/SMS notifications, schedules,escalation policies, SSO, Ticketing integrations, Email, and chat support | Professional Plan + Streamlined incident response, Advanced admin features, ITSM integrations, Unlimited data access | Business plan features + Intelligent noise reduction, Real-time context for faster triage Advanced analytics, Customizable operations dashboard, Live call routing |
| SMS/Phone notifications | 100/month | Unlimited | Unlimited | Unlimited |
| Price | $0 up to 5 users /month | $19 per user /month | $39 per user /month | On request |
Table 1.0 | PagerDuty licensing and price plans
Overview of Datadog
Datadog is a SaaS-based infrastructure monitoring service for cloud applications, servers, databases, tools, and services. It’s headquartered in New York and has offices in Boston, Dublin, Paris, Singapore, Sydney, and Tokyo.
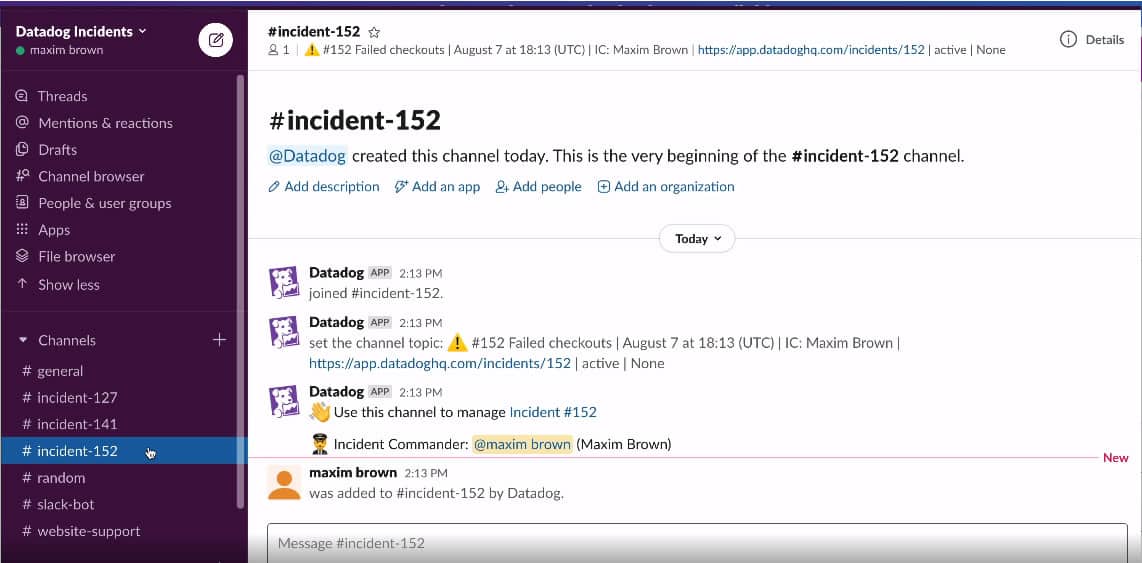
The Datadog platform is also integrated with an Incident Management module that enables teams to effectively manage their incident response workflows and resolve issues directly in the Datadog platform. Datadog Incident Management unifies your incident response workflow with the rest of your infrastructure performance monitoring activities so that your teams can seamlessly create, track and resolve incidents within Datadog without needing to switch tools.
Datadog is agent-based and uses its auto-discovery service to explore and identify devices in your network. The outcome of the auto-discovery service is then used to create a device inventory and network topology map, which forms an index for the complete monitoring service. Once all devices and links have been identified, you can overview all network activity from the Datadog dashboard. In addition, traffic flow analysis features let you see which applications or endpoints generate the most traffic on your network.
Other Datadog’s key features and capabilities include:
- Network monitoring—allows companies to visualize traffic flow in cloud-native environments and analyze performance using meaningful, easy-to-understand tags.
- Application performance management—monitors, troubleshoots, and optimizes application performance.
- Automated incident management: Coordinate response efforts across teams and resolve issues directly on the platform.
- Log management—allows users to search, filter quickly, and analyze logs for troubleshooting and data analysis.
- Alerts—companies can create custom alerts for any metric or performance problem. Notifications are available via email, PagerDuty, Slack, etc.
- Integrations—the software integrates with multiple products and development stacks to aggregate metrics and events.
- Dashboards—high-resolution interactive dashboards help companies monitor and graph real-time metrics and events.
- Collaboration—collaboration tools provide visibility across teams by letting users annotate changes, record problems and communication, and discuss issues in context with production data.
- Application programming interface (API)—API access helps companies observe apps and infrastructure by capturing events and metrics using client libraries.
A free 14-day-trial with full access to all the features is available for download. After that, the software is generally sold through monthly/annual subscription plans based on hosts, events, or logs.
Pros & Cons
Datadog
Pros:
- Offers numerous real user monitors via templates and widgets
- Can monitor both internally and externally giving network admins a holistic view of network performance and accessibility
- Changes made to the network are reflected in near real-time
- Allows businesses to scale their monitoring efforts reliably through flexible pricing options
Cons:
- Would like to see a longer trial period for testing
PagerDuty
Pros:
- Combination of communication and incident response platform
- Ideal for small to medium-sized teams
- Leverages AI to improve alerting functions
- Is offered as a flexible SaaS product
Cons:
- Enterprises might be left wanting more
- No self-hosted version is available
PagerDuty Vs. Datadog: How They Compare
Systems Requirements and Installation
Being a SaaS-based application, there are no on-premise system requirements other than a modern web browser with JavaScript enabled; and no installation requirements other than the usual signup process–which is pretty straightforward. Once the signup process is completed, you’ll be required to install a PagerDuty mobile app (available for Android and iOS), and that’s about it.
Similarly, since Datadog is a SaaS-based application, there are no on-premise system requirements and no installation hassles. However, you’ll be required to install local agents specific to the device or service you wish to monitor for the most part. An agent-based mode means no auto-discovery feature, so you have to deploy an agent for all your devices individually. Datadog supports integration with VMware vSphere, but the setup process is a bit complicated. That said, Datagod provides enough documentation and setup instructions to guide you through the installation and configuration process.
Dashboards and Visualizations
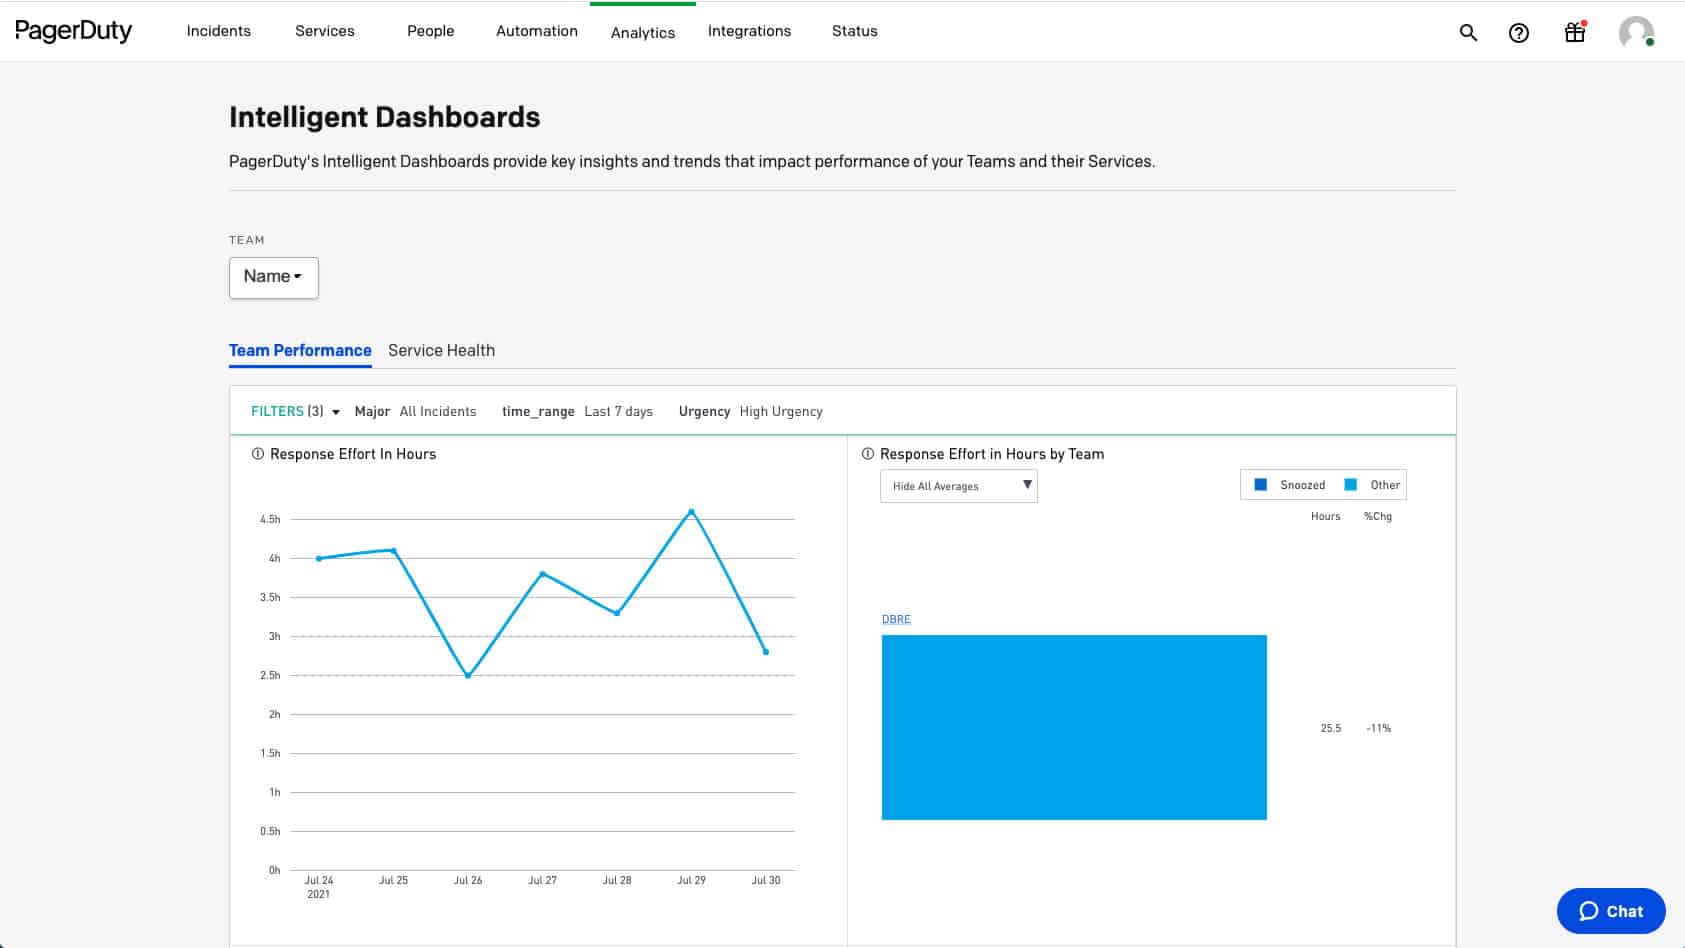
PagerDuty comes with a dashboard that displays the status of incidents and alerts across all of your monitoring tools. In addition, PagerDuty provides various pre-built dashboards such as intelligent dashboards, status dashboards, among others. These dashboards and their GUI are designed with simplicity in mind. This makes navigation and configuration of policies so easy.
Datadog is aesthetically pleasing from a visual perspective with its clean and modern dashboard design. The Datadog Incidents UI provides a central view of all incidents, including both active and resolved. In addition, Datadog allows you to customize your dashboards with a vast library of visualization tools and drag-and-drop widgets. Anyone can add widgets from dashboards within Datadog that show relevant metrics. But it requires a lot of setup work to get things working as well. Thankfully, Datadog provides all the documentation you need to get things working.
Alerts and Notifications
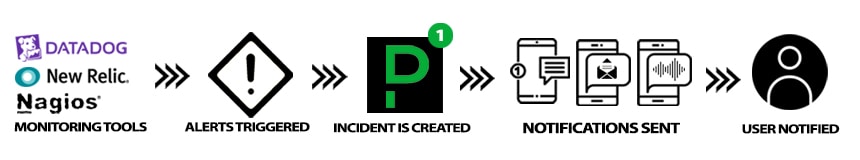
Figure 3.0 | Diagram showing PagerDuty alert flowchart
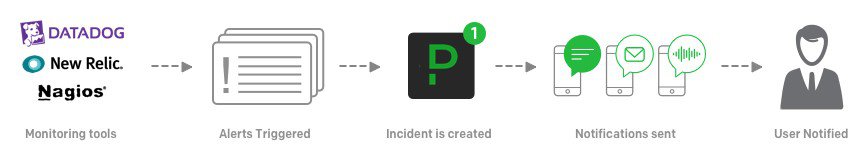
Figure 3.0 | Diagram showing PagerDuty alert flowchart | Credit: PagerDutyPagerDuty has some of the best alerting features that balance effectiveness with ease of use. The alerting system is intended to elicit a response and accelerate issue resolution. The service can be configured to deliver alerts via email, SMS, voice call, or mobile apps (iOS and Android). In addition, PagerDuty is designed to ensure that you are notified of incidents in a timely fashion, wherever they occur, and re-notifying when no action has been taken to resolve the issues. This unique approach to alerts and notifications helps organizations keep mean time to resolution (MTTR) as low as possible and minimize downtimes.
Similarly, Datadog’s approach to alerts and notifications is based on machine learning (ML), which it calls Watchdog. Watchdog uses ML techniques to identify problems in your infrastructure, applications efficiently and services, and flag anomalies. Alerts in Datadog are called Monitors. Users can receive alerts using Pagerduty, Slack, and email. These can be based on nearly any metric that Datadog can capture. As a result, every alert is specific, actionable, and contextual—even in large and temporary environments. This unique approach to alerts and notifications makes Datadog stand out and helps to minimize downtime and prevents alert fatigue.
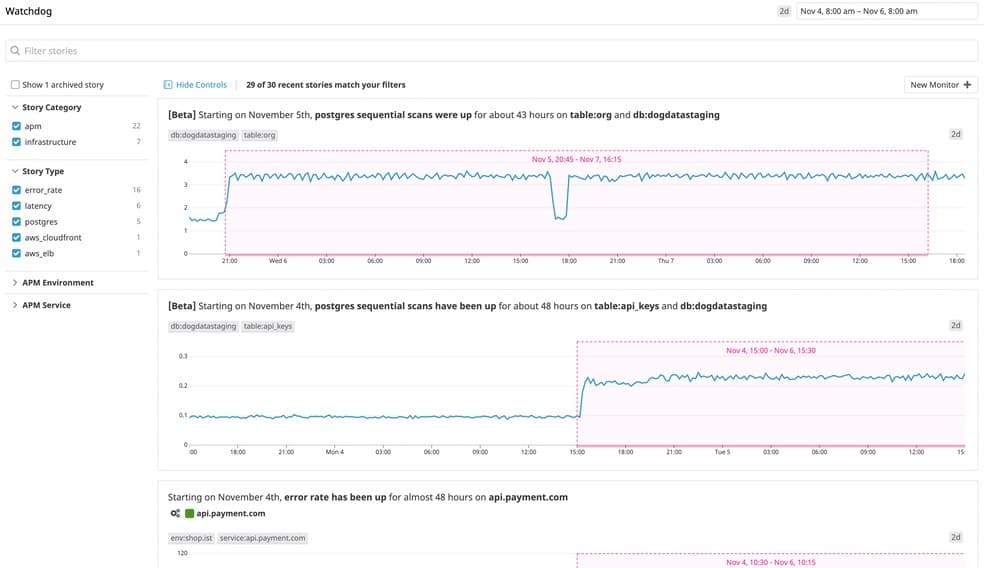
Figure 4.0 | Screenshot showing Datadog watchdog interface
Reporting and Integration
PagerDuty provides various exportable out-of-the-box reports depending on your subscription plan. Summary metrics that show the meantime to acknowledge, the meantime to resolve, the number of escalated incidents, and more are also provided. The real power of PagerDuty lies in its ability to integrate with tons of third-party infrastructure and application monitoring tools, including Datadog, to enrich and accelerate your incident response process. When you integrate PagerDuty with Datadog or any third-party monitoring tool, an event in the tool can immediately trigger an incident in PagerDuty, which creates an alert, thereby kicking off your team’s incident response process right person can acknowledge and resolve the incident.
Instead of generating the usual out-of-the-box reports that most network admins expect, the Datadog approach to reporting aims to make metrics easily searchable, and it does excellently. Although some network managers prefer the excellent old nicely generated fixed PDF report, not everybody needs it. Therefore, Datadog also comes equipped with inbuilt integration support for PagerDuty, and an easy-to-use API that can significantly extend the range of what Datadog can track. The Datadog API is an HTTP REST API that can access the Datadog platform programmatically and returns JSON from all requests.
Licensing and Price Plans
PagerDuty’s licensing model is based on per user, per month price plans (billed monthly or annually), and it’s free for up to 5 users. The premium price plans include Professional, Business, and Digital operations, as shown in Table 1.0 above. However, PagerDuty’s pricing model tends to make customers pay more to enable them to unlock complete reporting and other essential add-on features. This may seem high for most small and mid-sized organizations.
Datadog pricing model is based on per server, per month, and it’s free for up to 5 hosts (with 1-day data retention). But some customers complain that it becomes costly at scale. As a result, Datadog is available in several different pricing tiers:
The Network Performance tier–suitable for monitoring networks and systems for most small to midsize businesses.
The Infrastructure tier– ideal for organizations that want to use the software as a centralized monitoring service for systems and services.
The APM tier–designed for larger organizations looking to fix service and device-layer problems.
Serverless tier–aimed at those looking to monitor network and application issues.
Log Management tier–meant for companies with large amounts of log data to parse for context and retention.
There are also different tiers for security, synthetic, and accurate user monitoring, each appropriate pricing for the core task.
All Datadog prices are billed annually, making it one of the most price-customizable management apps.
| Features | PagerDuty | Datadog |
|---|---|---|
| Target market | Ideal solution for SMBs to large-scale enterprises. | Developers, freelancers, IT operations teams, security engineers, and business users from SMB to large organizations in the cloud age. |
| Supported platform | Online | Online, Mac OS X, Windows, and Linux |
| Deployment model | SaaS-based | SaaS-based |
| APIs calls | REST API | HTTP REST API |
| Support methods | Knowledge base Email/chat Telephone | Phone Online Knowledge base Video tutorials |
| Licensing and pricing model | Free Professional Business Digital operations | Free trial available No credit card required Free account Subscription-based |
Table 2.0 | Comparison of PagerDuty and Datadog key features
Concluding Remarks
PagerDuty is a powerful modern incident management tool. MSPs and other organizations committed to keeping mean time to resolution (MTTR) as low as possible will find PagerDuty very appealing. On the flip side, the reporting appears to be tailored towards operational use. This means that customers that want to use an external reporting solution will have to upgrade to the more expensive premium plans.
Similarly, with Datadog Incident Management, Datadog customers can effectively manage and resolve incidents in a single, unified platform without needing to switch tools. This saves your team significant time. However, it cannot automatically create incidents when datadog alerts are triggered—which means that users are expected to develop incidents manually—and most customers find this approach very inconvenient.
Overall, PagerDuty and Datadog are two leaders in incident response and performance monitoring. Both platforms complement each other in various ways and rank as one of each other’s most popular integrations. As a result, several organizations trust and rely on them to monitor their environments, collaborate across teams, and respond to issues.

Thanks for sharing this informative post with us. I read it and must say very impressive and informative.